
Responsible Sourcing


Climate change is the biggest challenge of our time and Drax has a crucial role in tackling it.
All countries around the world need to reduce carbon emissions while at the same time growing their economies. Creating enough clean, secure energy for industry, transport and people’s daily lives has never been more important.
Drax is at the heart of the UK energy system. Recently the UK government committed to delivering a net-zero carbon emissions by 2050 and Drax is equally committed to helping make that possible.
We’ve recently had some questions about what we’re doing and I’d like to set the record straight.
At Drax we’re committed to a zero-carbon, lower-cost energy future.
And we’ve accelerated our efforts to help the UK get off coal by converting our power station to using sustainable biomass. And now we’re the largest decarbonisation project in Europe.
We’re exploring how Drax Power Station can become the anchor to enable revolutionary technologies to capture carbon in the North of England.
And we’re creating more energy stability, so that more wind and solar power can come onto the grid.
And finally, we’re helping our customers take control of their energy – so they can use it more efficiently and spend less.
No. Since 2012 we’ve reduced our CO2 emissions by 84%. In that time, we moved from being western Europe’s largest polluter to being the home of the largest decarbonisation project in Europe.
And we want to do more.
We’ve expanded our operations to include hydro power, storage and natural gas and we’ve continued to bring coal off the system.
By the mid 2020s, our ambition is to create a power station that both generates electricity and removes carbon from the atmosphere at the same time.
Our energy system is changing rapidly as we move to use more wind and solar power.
At the same time, we need new technologies that can operate when the wind is not blowing and the sun is not shining.
A new, more efficient gas plant can fill that gap and help make it possible for the UK to come off coal before the government’s deadline of 2025.
Importantly, if we put new gas in place we need to make sure that there’s a route through for making that zero-carbon over time by being able to capture the CO2 or by converting those power plants into hydrogen.
No.
Sustainable biomass from healthy managed forests is helping decarbonise the UK’s energy system as well as helping to promote healthy forest growth.
Biomass has been a critical element in the UK’s decarbonisation journey. Helping us get off coal much faster than anyone thought possible.
The biomass that we use comes from sustainably managed forests that supply industries like construction. We use residues, like sawdust and waste wood, that other parts of industry don’t use.
We support healthy forests and biodiversity. The biomass that we use is renewable because the forests are growing and continue to capture more carbon than we emit from the power station.
What’s exciting is that this technology enables us to do more. We are piloting carbon capture with bioenergy at the power station. Which could enable us to become the first carbon-negative power station in the world and also the anchor for new zero-carbon cluster across the Humber and the North.
I took this job because Drax has already done a tremendous amount to help fight climate change in the UK. But I also believe passionately that there is more that we can do.
I want to use all of our capabilities to continue fighting climate change.
I also want to make sure that we listen to what everyone else has to say to ensure that we continue to do the right thing.

Shipping is widely considered the most efficient form of cargo transport. As a result, it’s the transportation of choice for around 90% of world trade. But even as the most efficient, it still accounts for roughly 3% of global carbon dioxide (CO2) emissions.
This may not sound like much, but it amounts to 1 billion tonnes of CO2 and other greenhouse gases per year – more than the UK’s total emissions output. In fact, if shipping were a country, it would be the sixth largest producer of greenhouse gas (GHG) emissions. And unless there are drastic changes, emissions related to shipping could increase from between 50% and 250% by 2050.

As well as emitting GHGs that directly contribute towards the climate emergency, big ships powered by fossil fuels such as bunker fuel (also known as heavy fuel oil) release other emissions. These include two that can have indirect impacts – sulphur dioxide (SO2) and nitrogen oxides (NOx). Both impact air quality and can have human health and environmental impacts.
As a result, the International Maritime Organization (IMO) is introducing measures that will actively look to force shipping companies to reduce their emissions. In January 2020 it will bring in new rules that dictate all vessels will need to use fuels with a sulphur content of below 0.5%.
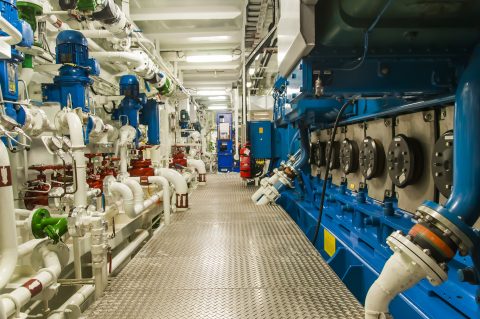
One approach ship owners are taking to meet these targets is to fit ‘scrubbers’– devices which wash exhausts with seawater, turning the sulphur oxides emitted from burning fossil fuel oils into harmless calcium sulphate. But these will only tackle the sulphur problem, and still mean that ships emit CO2.
Another approach is switching to cleaner energy alternatives such as biofuels, batteries or even sails, but the most promising of these based on existing technology is liquefied natural gas, or LNG.
In its liquid form, natural gas can be used as a fuel to power ships, replacing heavy fuel oil, which is more typically used, emissions-heavy and cheaper. But first it needs to be turned into a liquid.
To do this, raw natural gas is purified to separate out all impurities and liquids. This leaves a mixture of mostly methane and some ethane, which is passed through giant refrigerators that cool it to -162oC, in turn shrinking its volume by 600 times.
The end product is a colourless, transparent, non-toxic liquid that’s much easier to store and transport, and can be used to power specially constructed LNG-ready ships, or by ships retrofitted to run on LNG. As well as being versatile, it has the potential to reduce sulphur oxides and nitrogen oxides by 90 to 95%, while emitting 10 to 20% less CO2 than heavier fuel alternatives.

The cost of operating a vessel on LNG is around half that of ultra-low sulphur marine diesel (an alternative fuel option for ships aiming to lower their sulphur output), and it’s also future-proofed in a way that other low-sulphur options are not. As emissions standards become stricter in the coming years, vessels using natural gas would still fall below any threshold.
The industry is starting to take notice. Last year 78 vessels were fitted to run on LNG, the highest annual number to date.
One company that has already embraced the switch to LNG is Estonia’s Graanul Invest. Europe’s largest wood pellet producer and a supplier to Drax Power Station, Graanul is preparing to introduce custom-built vessels that run on LNG by 2020.
The new ships will have the capacity to transport around 9,000 tonnes of compressed wood pellets and Graanul estimates that switching to LNG has the potential to lower its CO2 emissions by 25%, to cut NOx emissions by 85%, and to almost completely eliminate SO2 and particulate matter pollution.
LNG might be leading the charge towards cleaner shipping, but it’s not the only solution on the table. Another potential is using advanced sail technology to harness wind, which helps power large cargo ships. More than just an innovative way to upscale a centuries-old method of navigating the seas, it is one that could potentially be retrofitted to cargo ships and significantly reduce emissions.
Drax is currently taking part in a study with the Smart Green Shipping Alliance, Danish dry bulk cargo transporter Ultrabulk and Humphreys Yacht Design, to assess the possibility of retrofitting innovative sail technology onto one of its ships for importing biomass.
Manufacturers are also looking at battery power as a route to lowering emissions. Last year, boats using battery-fitted technology similar to that used by plug-in cars were developed for use in Norway, Belgium and the Netherlands, while Dutch company Port-Liner are currently building two giant all-electric barges – dubbed ‘Tesla ships’ – that will be powered by battery packs and can carry up to 280 containers.
Then there are projects exploring the use of ammonia (which can be produced from air and water using renewable electricity), and hydrogen fuel cell technology. In short, there are many options on the table, but few that can be implemented quickly, and at scale – two things which are needed by the industry. Judged by these criteria, LNG remains the frontrunner.

There are currently just 125 ships worldwide using LNG, but these numbers are expected to increase by between 400 and 600 by 2020. Given that the world fleet boasts more than 60,000 commercial ships, this remains a drop in the ocean, but with the right support it could be the start of a large scale move towards cleaner waterways.

People love to celebrate inventors. It’s inventors that Apple’s famous 90s TV ad claimed ‘Think Different’, and in doing so set about changing the world. The renewable electricity sources we take for granted today all started with such people, who for one reason or another tried something new.
These are the stories of the people behind five sources of renewable electricity, whose inventions and ideas could help power the world towards a zero-carbon future.
Using rushing rivers as a source of power dates back centuries as a mechanised way of grinding grains for flour. The first reference to a watermill dates from all the way back to the third century BCE.
However, hydropower also played a big role in the early history of electricity generation – the first hydroelectric scheme first came into action in 1878, six years before the invention of the modern steam turbine.
What important device did this early source of emissions-free electricity power? A single lamp in the Northumberland home of Victorian inventor William Armstrong. This wasn’t the only feature that made the house ahead of its time.
Water pressure also helped power a hydraulic lift and a rotating spit in the kitchen, while the house also featured hot and cold running water and an early dishwasher. One contemporary visitor dubbed the house a ‘palace of a modern magician’.
The first commercial hydropower power plant, however, opened on Vulcan Street in Appleton, Wisconsin in 1882 to provide electricity to two local paper mills, as well as the mill owner H.J. Rogers’ home.
After a false start on 27 September, the Vulcan Street Plant kicked into life in earnest on 30 September, generating about 12.5 kilowatts (kW) of electricity. It was very nearly America’s first ever commercial power plant, but was beaten to the accolade by Thomas Edison’s Pearl Street Plant in New York which opened a little less than a month earlier.

When the International Space Station is in sunlight, about 60% the electricity its solar arrays generate is used to charge the station’s batteries. The batteries power the station when it is not in the sun.
For much of the 20thcentury solar photovoltaic power generation didn’t appear in many more places than on calculators and satellites. But now with more large-scale and roof-top arrays popping up, solar is expected to generate a significant portion of the world’s future energy.
It’s been a long journey for solar power from its origins back in 1839 when 19-year old aspiring physicist Edmond Becquerel first noticed the photovoltaic effect. The Frenchman found that shining light on an electrode submerged in a conductive solution created an electric current. He did not, however, have any explanation for why this happened.
American inventor Charles Fritts was the first to take solar seriously as a source of large-scale generation. He hoped to compete with Thomas Edison’s coal powered plants in 1883, when he made the first recognisable solar panel using the element selenium. However, they were only about 1% efficient and never deployed at scale.
It would not be until 1953, when scientists Calvin Fuller, Gerald Pearson and Daryl Chapin working at Bell Labs cracked the switch from selenium to silicon, that the modern solar panel was created.
Bell Labs unveiled the breakthrough invention to the world the following year, using it to power a small toy Ferris wheel and a radio transmitter.
Fuller, Pearson and Chapin’s solar panel was only 6% efficient, a big step forward for the time, but today panels can convert more than 40% of the sun’s light into electricity.

Offshore wind farm near Øresund Bridge between Sweden and Denmark
Like hydropower, wind has long been harnessed as a source of power, with the earliest examples of wind-powered grain mills and hydro pumps appearing in Persia as early as 500 BC.
The first electricity-generating windmill was used to power the mansion of Ohio-based inventor Charles Brush. The 60-foot (18.3 metres) wooden tower featured 144 blades and supplied about 12 kW of electricity to the house.

Charles Brush’s wind turbine charged a dozen batteries each with 34 cells.
The turbine was erected in 1888 and powered the house for two decades. Brush wasn’t just a wind power pioneer either, and in the basement of the mansion sat 12 batteries that could be recharged and act as electricity sources.
Small turbines generating between 5 kW and 25 kW were important at the turn of the 19thinto the 20thcentury in the US when they helped bring electricity to remote rural areas. However, over in Denmark, scientist and teacher Poul la Cour had his own, grander vision for wind power.
La Cour’s breakthroughs included using a regulator to maintain a steady stream of power, and discovering that a turbine with fewer blades spinning quickly is more efficient than one with many blades turning slowly.
He was also a strong advocate for what might now be recognised as decentralisation. He believed wind turbines provided an important social purpose in supplying small communities and farms with a cheap, dependable source of electricity, away from corporate influence.
In 2017, Denmark had more than 5.3 gigawatts (GW) of installed wind capacity, accounting for 44% of the country’s power generation.

Larderello, Italy
Italian princes aren’t a regular sight in the history books of renewable energy, but at the turn of the last century, on a Tuscan hillside, Piero Ginori Conti, Prince of Trevignano, set about harnessing natural geysers to generate electricity.
In 1904 he had become head of a boric acid extraction firm founded by his wife’s great-grandfather. His plan for the business included improving the quality of products, increasing production and lowering prices. But to do this he needed a steady stream of cheap electricity.
In 1905 he harnessed the dry steam (which lacks moisture, preventing corrosion of turbine blades) from the geographically active area near Larderello in Southern Tuscany to drive a turbine and power five light bulbs. Encouraged by this, Conti expanded the operation into a prototype power plant capable of powering Larderello’s main industrial plants and residential buildings.
It evolved into the world’s first commercial geothermal power plant in 1913, supplying 250 kW of electricity to villages around the region. By the end of 1943 there was 132 megawatts (MW) of installed capacity in the area, but as the main source of electricity for central Italy’s entire rail network it was bombed heavily in World War Two.
Following reconstruction and expansion the region has grown to reach current capacity of more than 800 MW. Globally, there is now more than 83 GW of installed geothermal capacity.

Compressed wood pellet storage domes at Baton Rouge Transit, Drax Biomass’ port facility on the Mississippi River
While sawmills had experimented with waste products as a power sources and compressed sawdust sold as domestic fuel, it wasn’t until the energy crisis of the 1970s that the term biomass was coined and wood pellets became a serious alternative to fossil fuels.
As a response to the 1973 Yom Kippur War, the Organization of Arab Petroleum Exporting Countries (OPEC) placed oil embargoes against several nations, including the UK and US. The result was a global price increase from $3 in October 1973 to $12 in March 1974, with prices even higher in the US, where the country’s dependence on imported fossil fuels was acutely exposed.
One of the most vulnerable sectors to booms in oil prices was the aviation industry. To tackle the growing scarcity of petroleum-based fuels, Boeing looked to fuel-efficiency engineer Jerry Whitfield. His task was to find an alternative fuel for industries such as manufacturing, which were hit particularly hard by the oil shortage and subsequent recession. This would, in turn, leave more oil for planes.
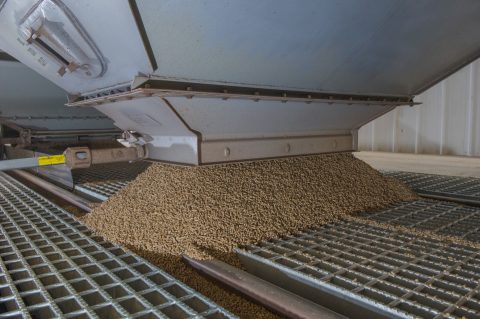
Wood pellets from Morehouse BioEnergy, a Drax Biomass pellet plant in northern Louisiana, being unloaded at Baton Rouge Transit for storage and onward travel by ship to England.
Whitfield teamed up with Ken Tucker, who – inspired by pelletised animal feed – was experimenting with fuel pellets for industrial furnaces. The pelletisation approach, combined with Whitfield’s knowledge of forced-air furnace technology, opened a market beyond just industrial power sources, and Whitfield eventually left Boeing to focus on domestic heating stoves and pellet production.
One of the lasting effects of the oil crisis was a realisation in many western countries of the need to diversify electricity generation, prompting expansion of renewable sources and experiments with biomass cofiring. Since then biomass pellet technology has built on its legacy as an abundant source of low-carbon, renewable energy, with large-scale pellet production beginning in Sweden in 1992. Production has continued to grow as more countries decarbonise electricity generation and move away from fossil fuels.
Since those original pioneers first harnessed earth’s renewable sources for electricity generation, the cost of doing so has dropped dramatically and efficiency skyrocketed. The challenge now is in implementing the capacity and technology to build a safe, stable and low-carbon electricity system.
View here

Electricity systems around the world are decarbonising and increasingly switching to renewable power sources. While intermittent sources, such as solar and wind, are the fastest growing types of renewables being installed globally, the reliability and flexibility of biomass and its ability to offer grid stabilisation services such as frequency control and inertia make it an increasingly necessary source of renewable power. According to the International Energy Agency biomass generation is forecast to expand as planned projects come online.
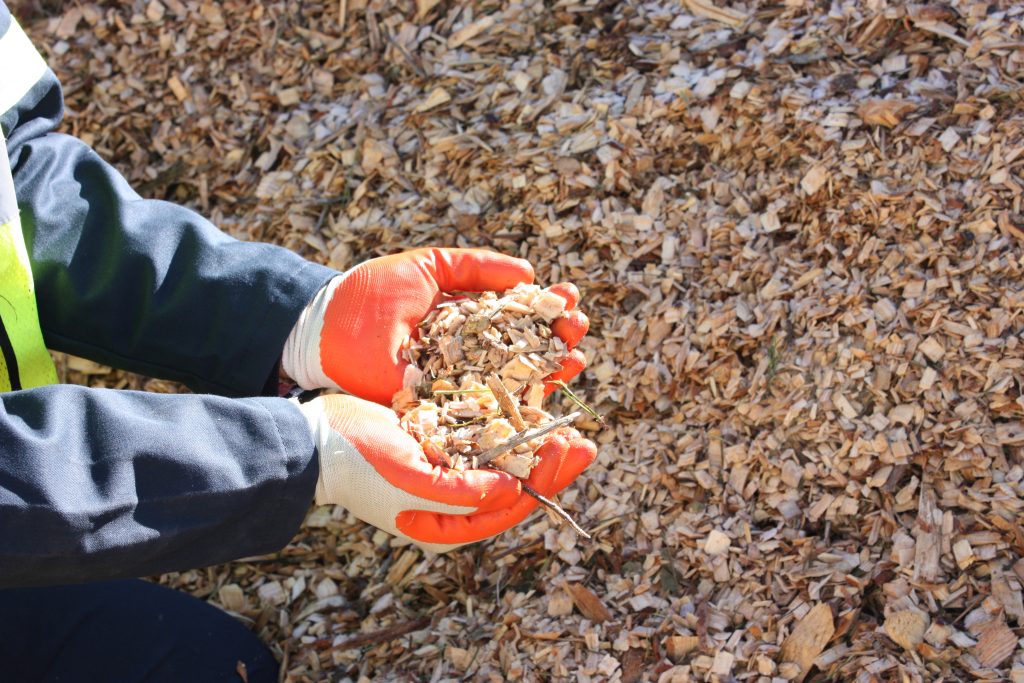
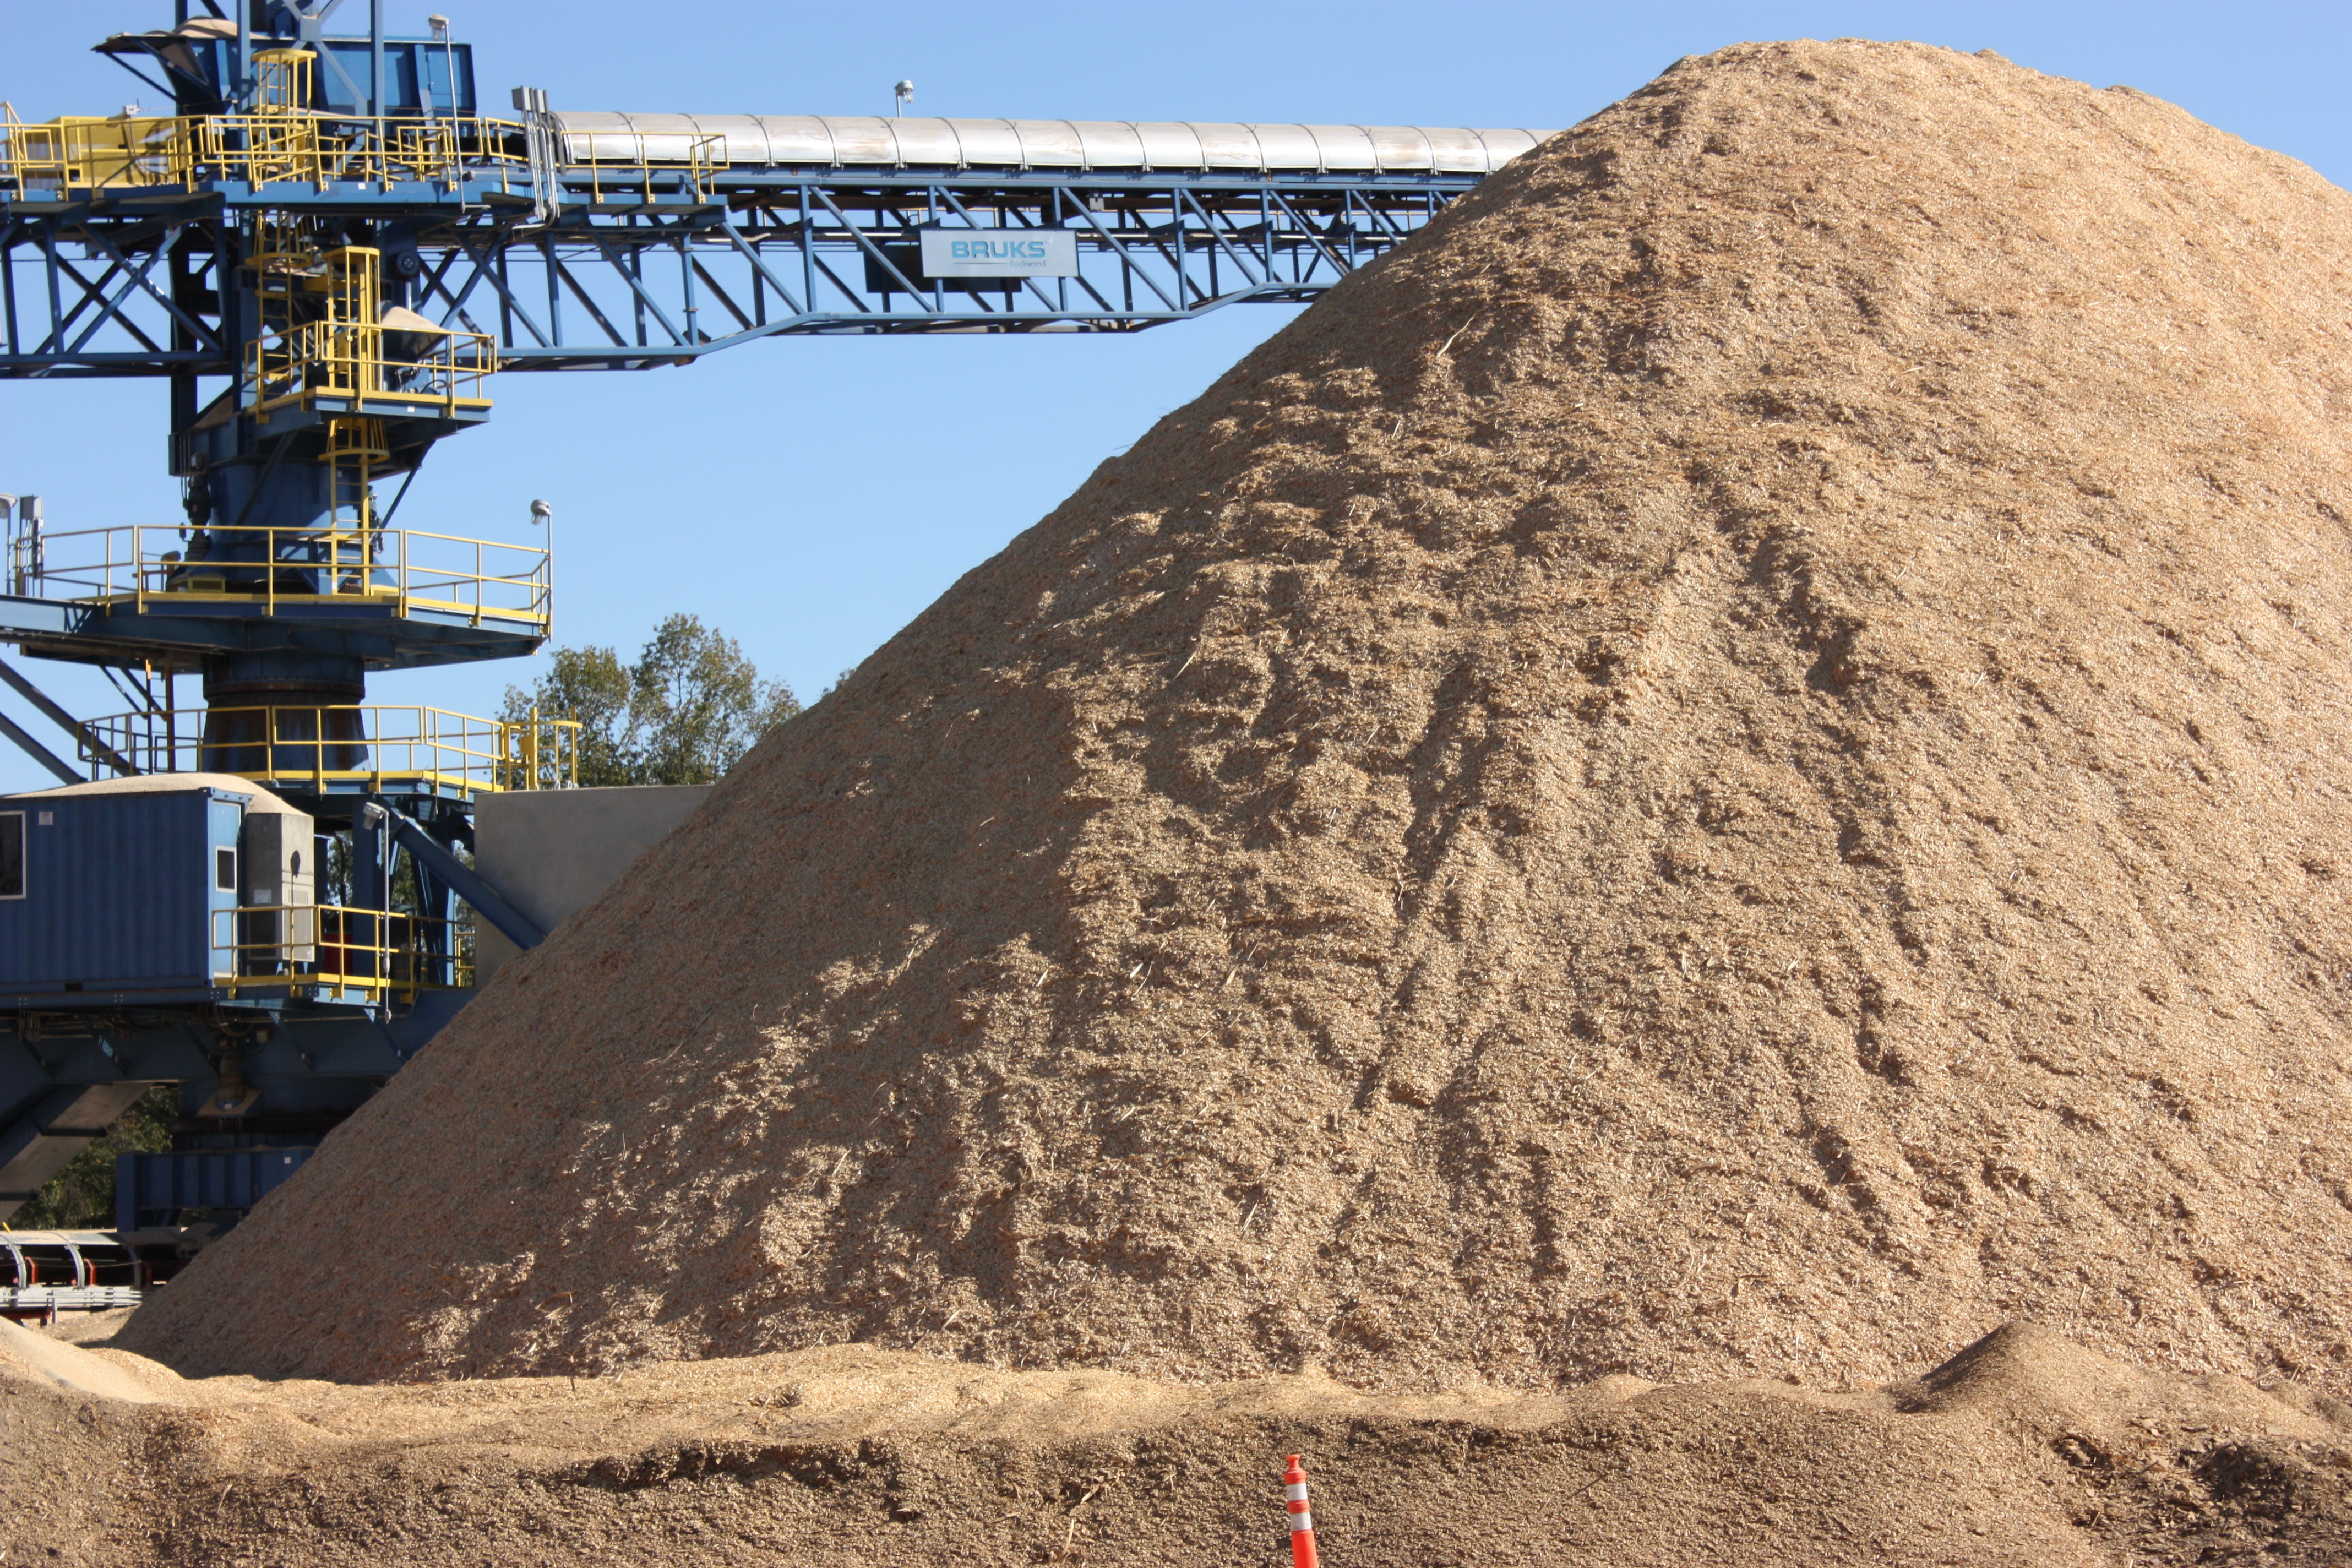
Biomass comes in many different forms. When looking to assess future demand and use, it is important to recognise benefits that different types of biomass bring. Compressed wood pellets are just one small part of the biomass spectrum, which includes many forms of agricultural and livestock residues, waste and bi-products – much of which is currently discarded or underutilised.
Maximising the use of these wastes and residues provides plenty of scope for expansion of the biomass energy sector around the world. The global installed capacity for biomass generation is expected to reach close to 140 gigawatts (GW) by 2026, which will be fuelled primarily by expansion in Asia using residues from food production and the forestry processing industry.
However, the use of woody biomass can also provide many benefits too, such as supplying a market for thinnings, providing a use for harvesting residues, encouraging better forest management practices and generating increased revenue for forest owners.
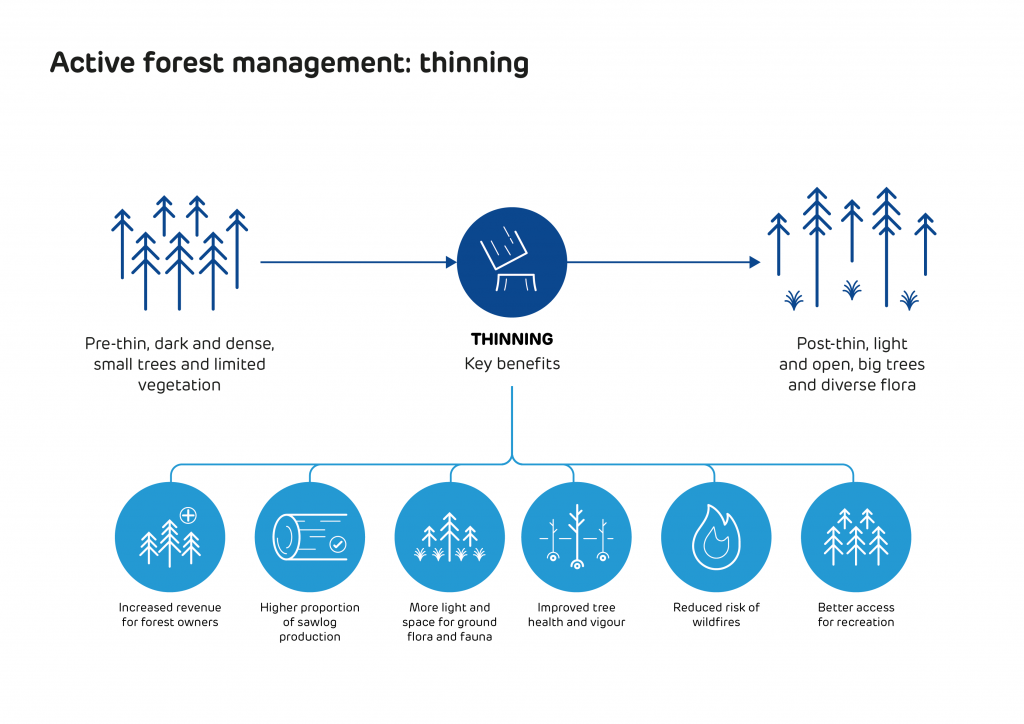
In areas like the US South, traditional markets for forest products have declined, whilst forest growth has significantly increased. According to the USDA Forest Inventory and Analysis (FIA) data, there is an average annual surplus of growth in the US South of more than 176 million cubic metres compared to removals – that’s enough to make around 84 million tonnes of wood pellets a year, from just one supply region.
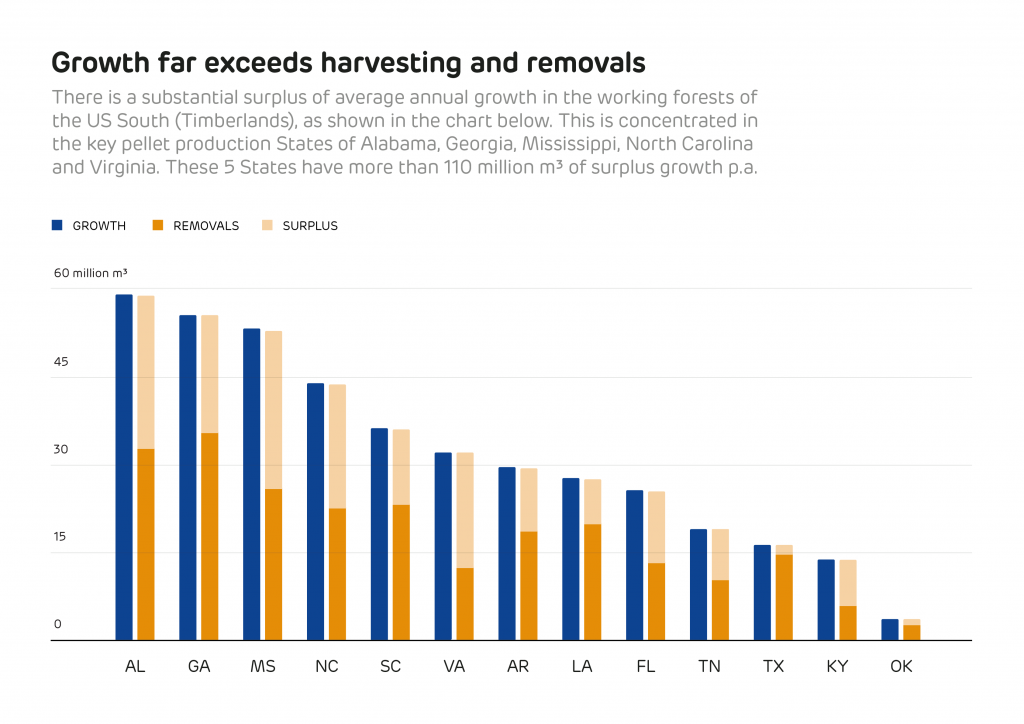
Of course, not all of this surplus growth could or should be used for bio-energy, much of it is suitable for high value markets like saw-timber or construction and some of it is located on inaccessible or protected sites. However, new and additional markets are essential to maintain the health of the forest resource and to encourage forest owners to retain and maintain their forest assets.
In the current wood pellet supply regions for Europe, Pöyry management consulting has calculated that there is a surplus of low grade wood fibre and residues that could make an additional 140 million tonnes of wood pellets each year.
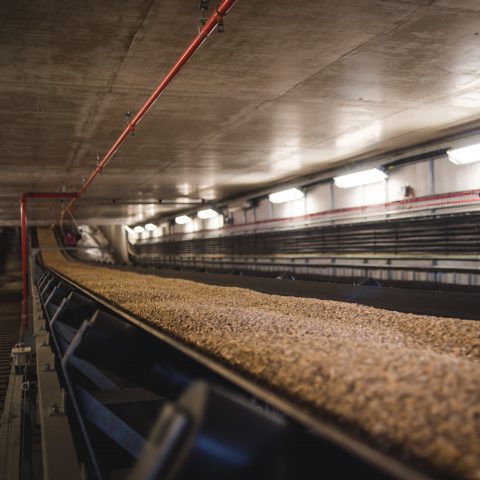
Compressed wood pellets on a conveyor belt
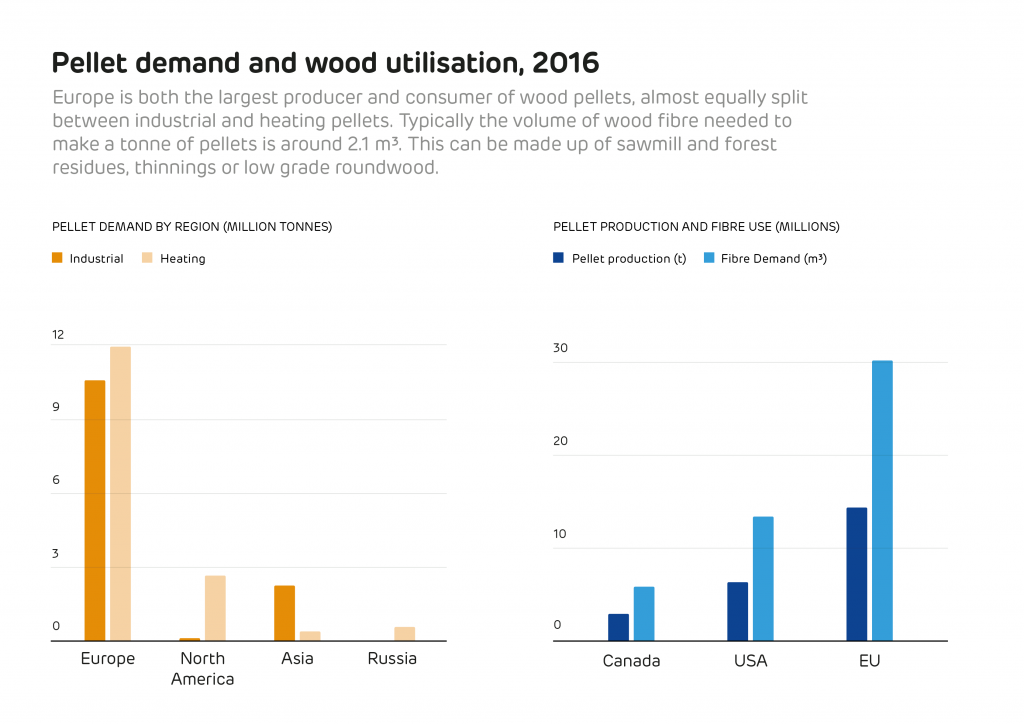
It is also necessary to look at the global production of all wood products to put wood pellet production into context. In 2016 the global production of industrial roundwood (the raw material used for construction, furniture, paper and other wood products) was 1.87 billion cubic metres, while the global production of wood fuel (used for domestic heating and cooking) was 1.86 billion cubic metres[1]. Only around 1.6% of this feedstock was used to make wood pellets, both for industrial energy and residential heat. The total production of wood pellets in 2016 was 28.4 million tonnes, of which only 45% was used for industrial energy[2].
While Forestry consulting and research firm Forisk predicts demand for industrial wood pellets (those used in electricity generation rather than residential heating) will grow globally at an annual rate of 15% for the next five years, reaching 27.5 megatonnes (Mt) by 2023, they are also clear that this growth, in context, will not impact forest volumes or other markets:
‘The wood pellet industry in the US South is not exploding, it is a tiny component of the overall market. Forest volumes in the South in total will continue to grow for decades no matter what bioenergy markets or housing markets do. The wood pellet sector simply and unequivocally cannot compete economically with US pulp and paper mills (80% of pulpwood demand in South) for raw material on a head-to-head basis[3].’
So, while demand for wood pellets is likely to increase over the next 10 years, this increase will be well within the scope of existing surplus fibre. The question, therefore, is can suppliers keep up with this demand? And can they do this while ensuring it remains sustainable, reliable and renewable?
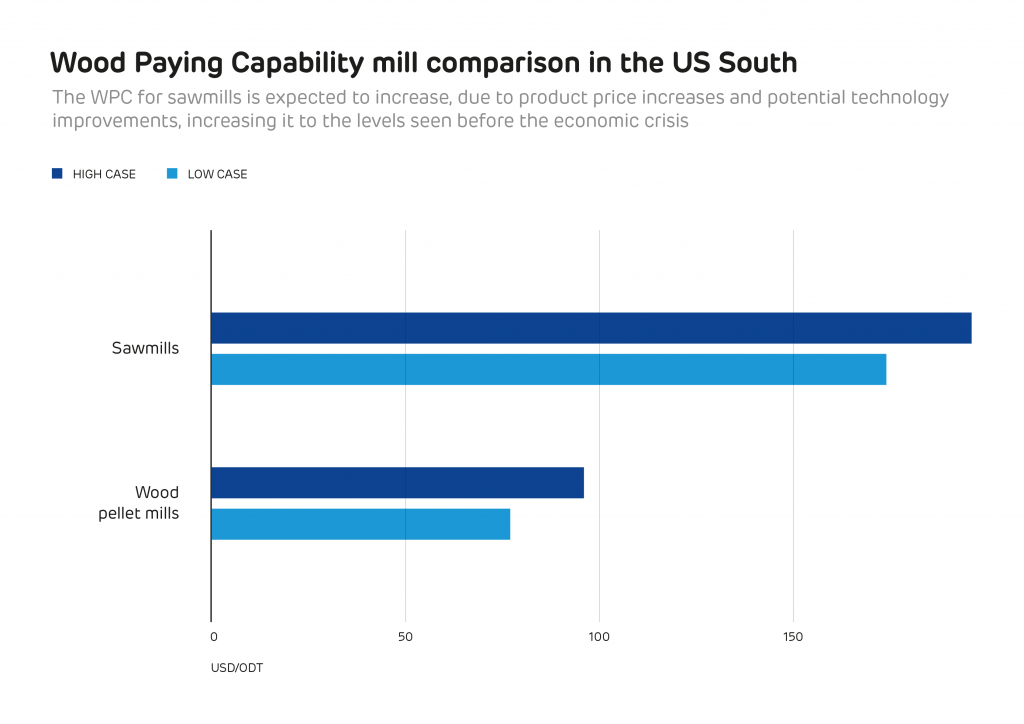
In the short-term, intelligence firm Hawkins Wright estimates global demand will increase by almost 30% during 2018 to reach 20.4 Mt, while Forisk predicts a smaller jump: an almost 5 Mt increase compared to 2017.
Most of this will continue to come from Europe (73% of global demand by 2021, more than 80% in 2018), where projects such as Lynemouth Power Station’s conversion from coal to biomass, as well as five co-firing units in the Netherlands are all set to come online very soon. While smaller in number, Asia is also developing a growing appetite for biomass and in 2018 demand is forecast to grow by 1.98 Mt.
These estimates might paint a picture of a continually soaring demand, but Forisk’s forecast actually expect this growth to plateau, levelling off around 2023 at 27.5 Mt. Hawkins Wright expects a similar slow down, forecasting manageable growth of under 15% between 2023 and 2026.
A forestry specialist at Drax Group, believes this plateau could come even sooner.
“Current and future forecasts in industrial wood pellet demand are based on a series of planned conversions and projects coming online,” he explains.
“But once these projects are active, demand in Europe will likely plateau around 2021 and then gradually reduce as various EU support schemes for industrial biomass come to an end. Any long term use of biomass is likely to be based on agricultural residues and wastes.”
But even with this expected slowdown, the biomass demand of the near future will be substantially higher than it is right now. So, the question remains, can suppliers meet the need for biomass pellets?
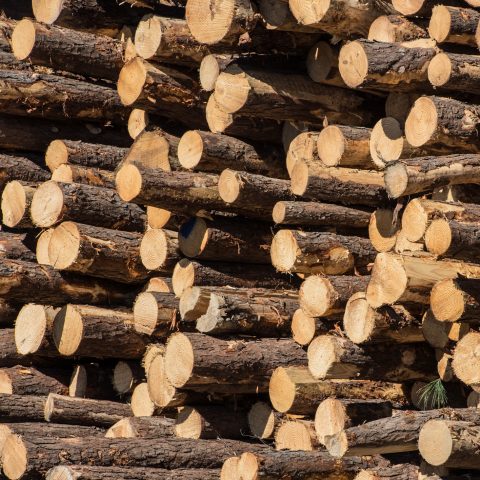
Meeting this growing demand depends on two factors: sufficient raw materials and the production capabilities to turn those materials into biomass pellets.
In today’s market, there’s no shortage of raw materials and low grade fibre. Instead, what could cause challenges is the production of pellets.
Hawkins Wright reports the capacity for global industrial pellet production was roughly 21.4 Mt a year at the end of 2017 and will increase by a further 3 Mt by 2019 as facilities currently under construction reach completion.
It means that to meet even Forisk’s conservative 27.5 Mt prediction by 2023, pellet production needs to increase. However, Drax’s forestry specialist points to the three to four years needed to complete pellet facilities and the relatively short period of time financial support programmes will remain in place as something that could lead to a slowdown in new plants coming online. Instead, he says, expansions of existing plants and the increased use of small-scale facilities will become crucial to increasing overall production.
However the biomass market changes and develops, it remains critical that proper regulation is in place, efficiencies are found and that technological innovation continues within the forestry industry so forests are grown and managed sustainably.
As we move into a low-carbon future we know that biomass demand will increase. But for this to be truly beneficial and sustainable we need to ensure we are not only meeting the demand of today but also of tomorrow, the day after tomorrow and beyond.
[1] Source: FAOSTAT
[2] Source: Hawkins Wright, The Outlook for Wood Pellets, Q4 2017
[3] https://www.forisk.com/blog/2015/10/23/nibbling-on-a-chicken-or-nibbling-on-an-elephant-another-example-of-incomplete-and-misleading-analysis-of-us-forest-sustainability-and-wood-bioenergy-markets/

The UK energy sector is changing rapidly. The boundaries between users, suppliers and generators are blurring as energy users are choosing to generate their own energy and are managing their energy use more proactively while, conversely, generators are increasingly seeing users as potential sources of generation and providers of demand management.
“The UK is undergoing an unprecedented energy revolution with electricity at its heart – a transition to a low-carbon society requiring new energy solutions for power generation, heating, transport and the wider economy”
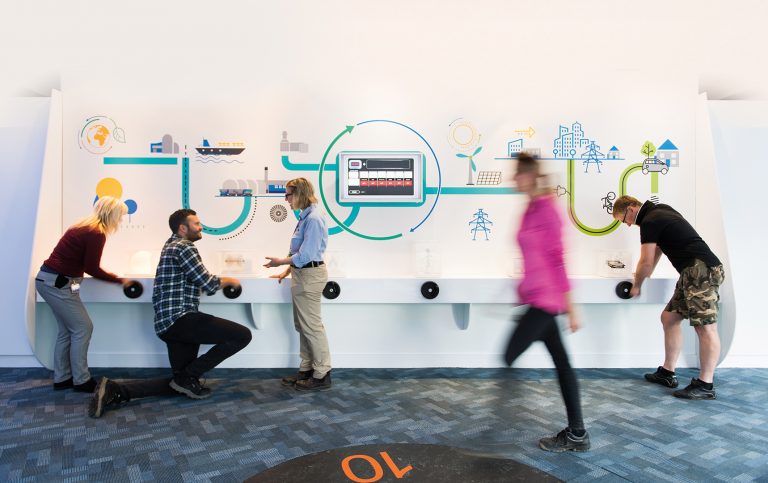
In that context, our Group’s purpose is to help change the way energy is generated, supplied and used for a better future. This means that sustainability, in its broadest sense, must be at the very core of what we do. Successful delivery of our purpose depends on all our people, across all our businesses, doing the right thing, every day. With the right products and services, we can go even further and help our customers make the right, sustainable energy choices.
As our businesses transform and we embrace a larger customer base, different generation technologies and operate internationally, the range of sustainability issues we face is widening and becoming more complex. At the same time, the range of stakeholders looking to Drax for responsible leadership on sustainability is increasing. The need for transparency is greater than ever, so our website’s sustainability section provides a comprehensive insight into the Group’s environmental, social and governance management and performance during 2017.

We initiated a process which would allow us to participate in the United Nations Global Compact (UNGC). We are committed to the initiative and its ten principles, which align with our culture of doing the right thing.
 Our website’s sustainability section also sets out our commitment to achieving the United Nations’ Sustainable Development Goals through our operations, the services we deliver to our customers and in partnership with others.
Global ambitions and goals are important, but so too are our ambitions for our local and regional communities. As such, we have played a key role in the UK Northern Powerhouse Partnership, initiatives such as POWERful Women and a comprehensive programme of stakeholder engagement.
“Sustainability, in its broadest sense, must be at the very core of what we do”
 Finally, I do not believe any organisation, however well intentioned, can get its commitment to sustainability perfect on its own and I am very keen for Drax to learn from people reading our website’s sustainability section. It sets out what we see as our achievements and aspects in which we believe we need to do better. I would like to invite any stakeholder with an interest to comment on what we’re doing and help us improve where we can. Feedback can be submitted at Contact us or via our Twitter account or Facebook page.
Read the Chief Executive’s Review in the Drax Group plc annual report and accounts
In 2015, the United Nations launched 17 Sustainable Development Goals (SDGs) to end poverty, protect the planet and ensure prosperity for all by 2030. At Drax, improved performance has guided our business purpose for over four decades. We are committed to play our part in achieving the UN SDGs through our operations, the services we deliver to our customers and in partnership with others.

We provide 6% of the UK’s electricity and play a vital role in helping change the way energy is generated, supplied and used as the UK moves to a low-carbon future. In 2017, 65% of the electricity we produced came from biomass, rather than coal. Our B2B Energy Supply businesses encourage customers to be more sustainable, including through the provision of reliable, renewable electricity at no premium compared to fossil fuel-generated electricity.

We directly employ over 2,500 people in the United Kingdom and United States and their health, safety and wellbeing remains our highest priority. Our B2B Energy Supply business offers energy solutions and value-added services to industrial, corporate and small business customers across the UK.
We develop innovative energy solutions to enable the flexible generation and lower-carbon energy supply needed for a low-carbon future. We also innovate to improve the efficiency of our operations and increase our production capacity, notably in our biomass supply chain. Our B2B Energy Supply business offers “intelligent sustainability” and innovative products and services to our customers.
Our electricity generation activities are a source of carbon emissions. We are committed to helping a low-carbon future by moving away from coal and towards renewable and cleaner fuels, including biomass electricity generation and our planned rapid-response gas plants. We also help our business customers to be more sustainable through the supply of renewable electricity.
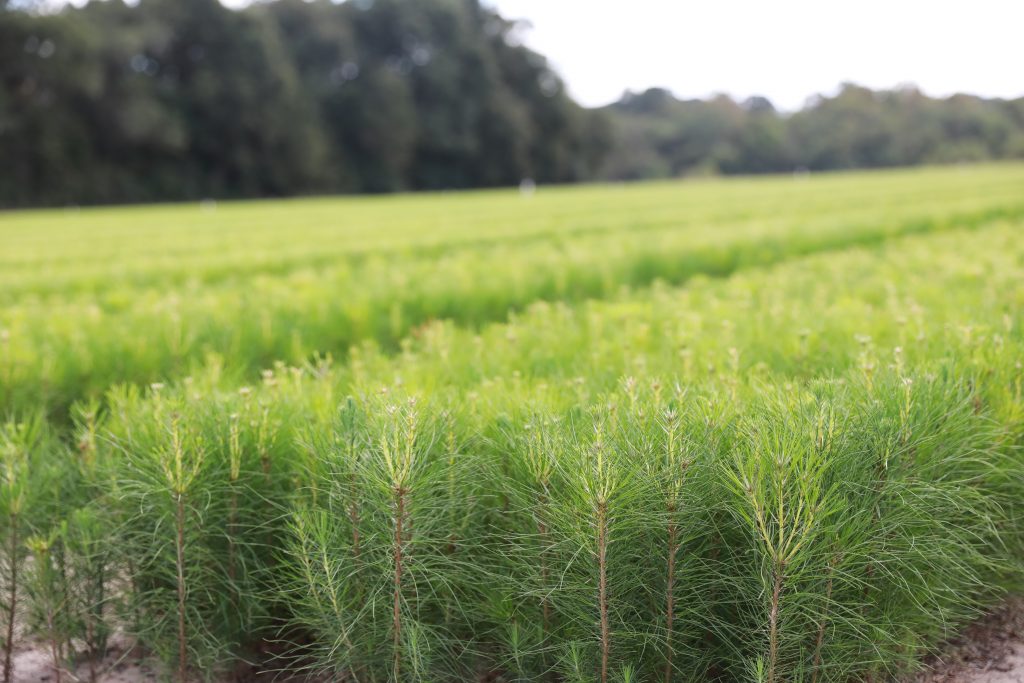
We source sustainable biomass for our electricity generation activities and engage proactively with our supply chain to ensure that the forests we source from are responsibly managed. We work closely with our suppliers and through tough screening and audits ensure that we never cause deforestation, forest decline or source from areas officially protected from forestry activities or where endangered species may be harmed.

We engage with stakeholders regularly and build relationships with partners to raise our standards and maximise what can be achieved. Our collaborations align closely with our business, purpose and strategy.

In 2017, we initiated a process which will allow us to participate in the United Nations Global Compact (UNGC) a global sustainability initiative and we will evidence progress next year. We made progress in preparing for participation outlined in the following sections:
We seek to safeguard fundamental human rights for our employees, contractors and anyone that is affected by our business. We ensure that our suppliers apply high standards to protect human rights.
We have policies and standards in place to safeguard our employees and contractors. We respect our employees’ rights in areas such as freedom of association and collective bargaining and we do not tolerate forced, compulsory or child labour. We are committed to providing a safe and healthy workplace for all our people and we strive to prevent discrimination and promote diversity in our workforce.

As a generator and supplier of electricity, we take our responsibility to protect the environment very seriously. We have transformed our generation business and are seeking to further reduce our environmental impact. We focus on reducing our emissions to air, discharges to water, disposal of waste, and on protecting biodiversity and using natural resources responsibly. We have invested heavily in lower-carbon technology as we continue to transition away from coal to renewable and lower-carbon fuels.
We do not tolerate any forms of bribery, corruption or improper business conduct. Our “Doing the Right Thing” framework sets out the ethical principles our people must uphold, which is supported by the Group corporate crime policy. Our strict ethical business principles apply to all employees and contractors and we expect the same high standards from anyone we do business with.