Tag: sustainability

Chesapeake catchment area analysis

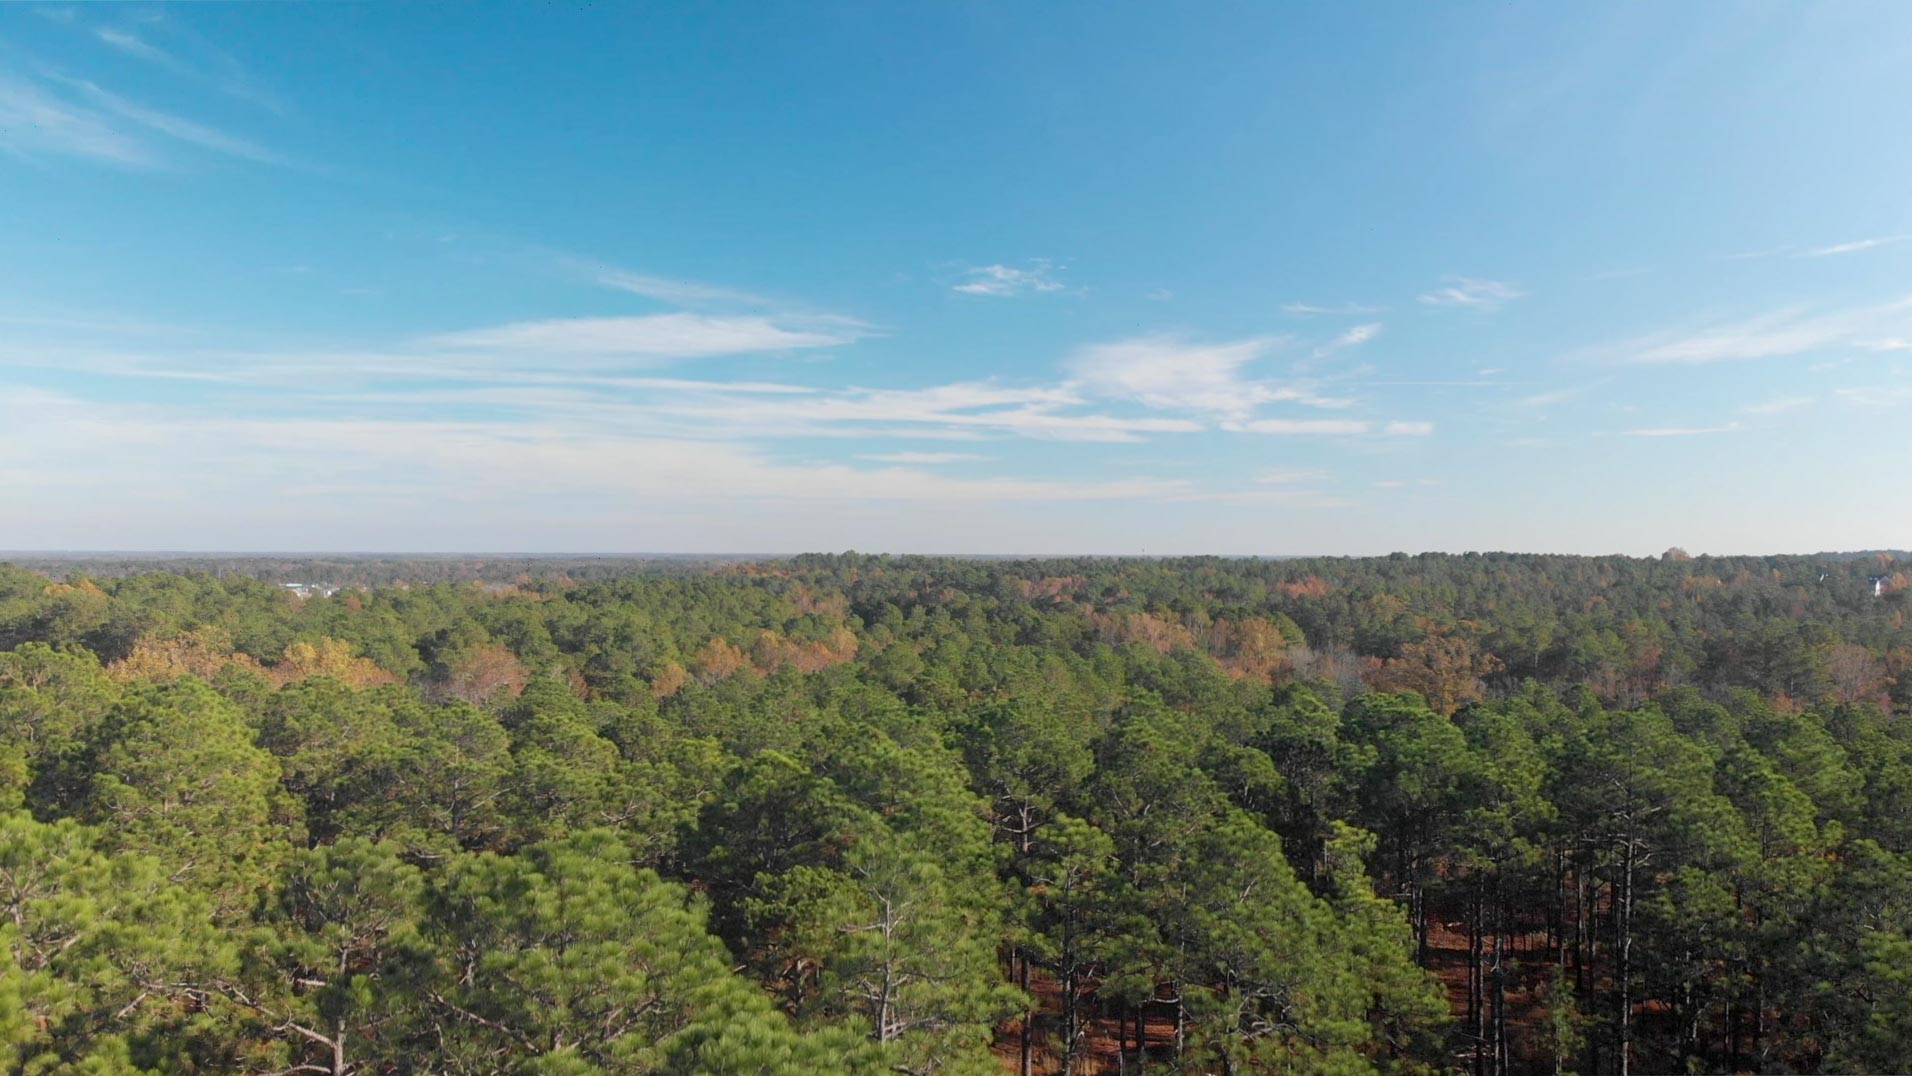
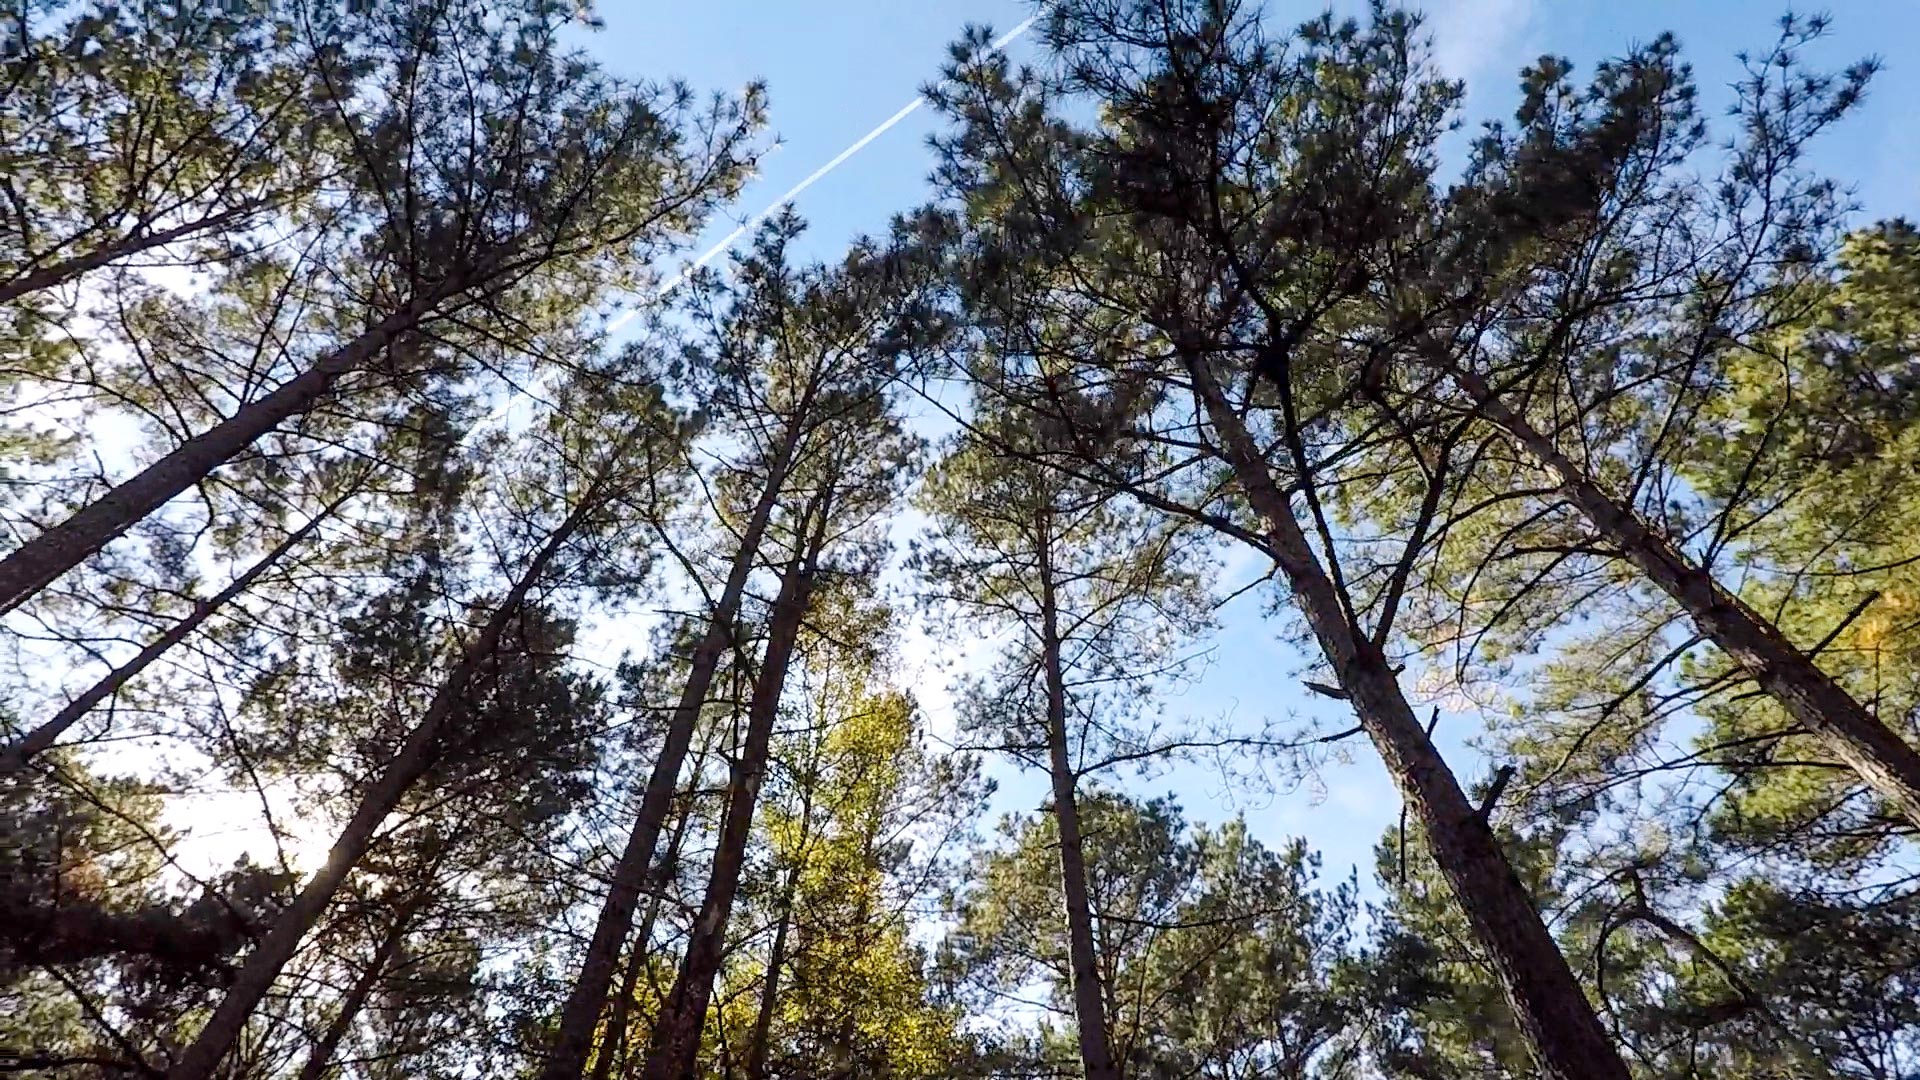
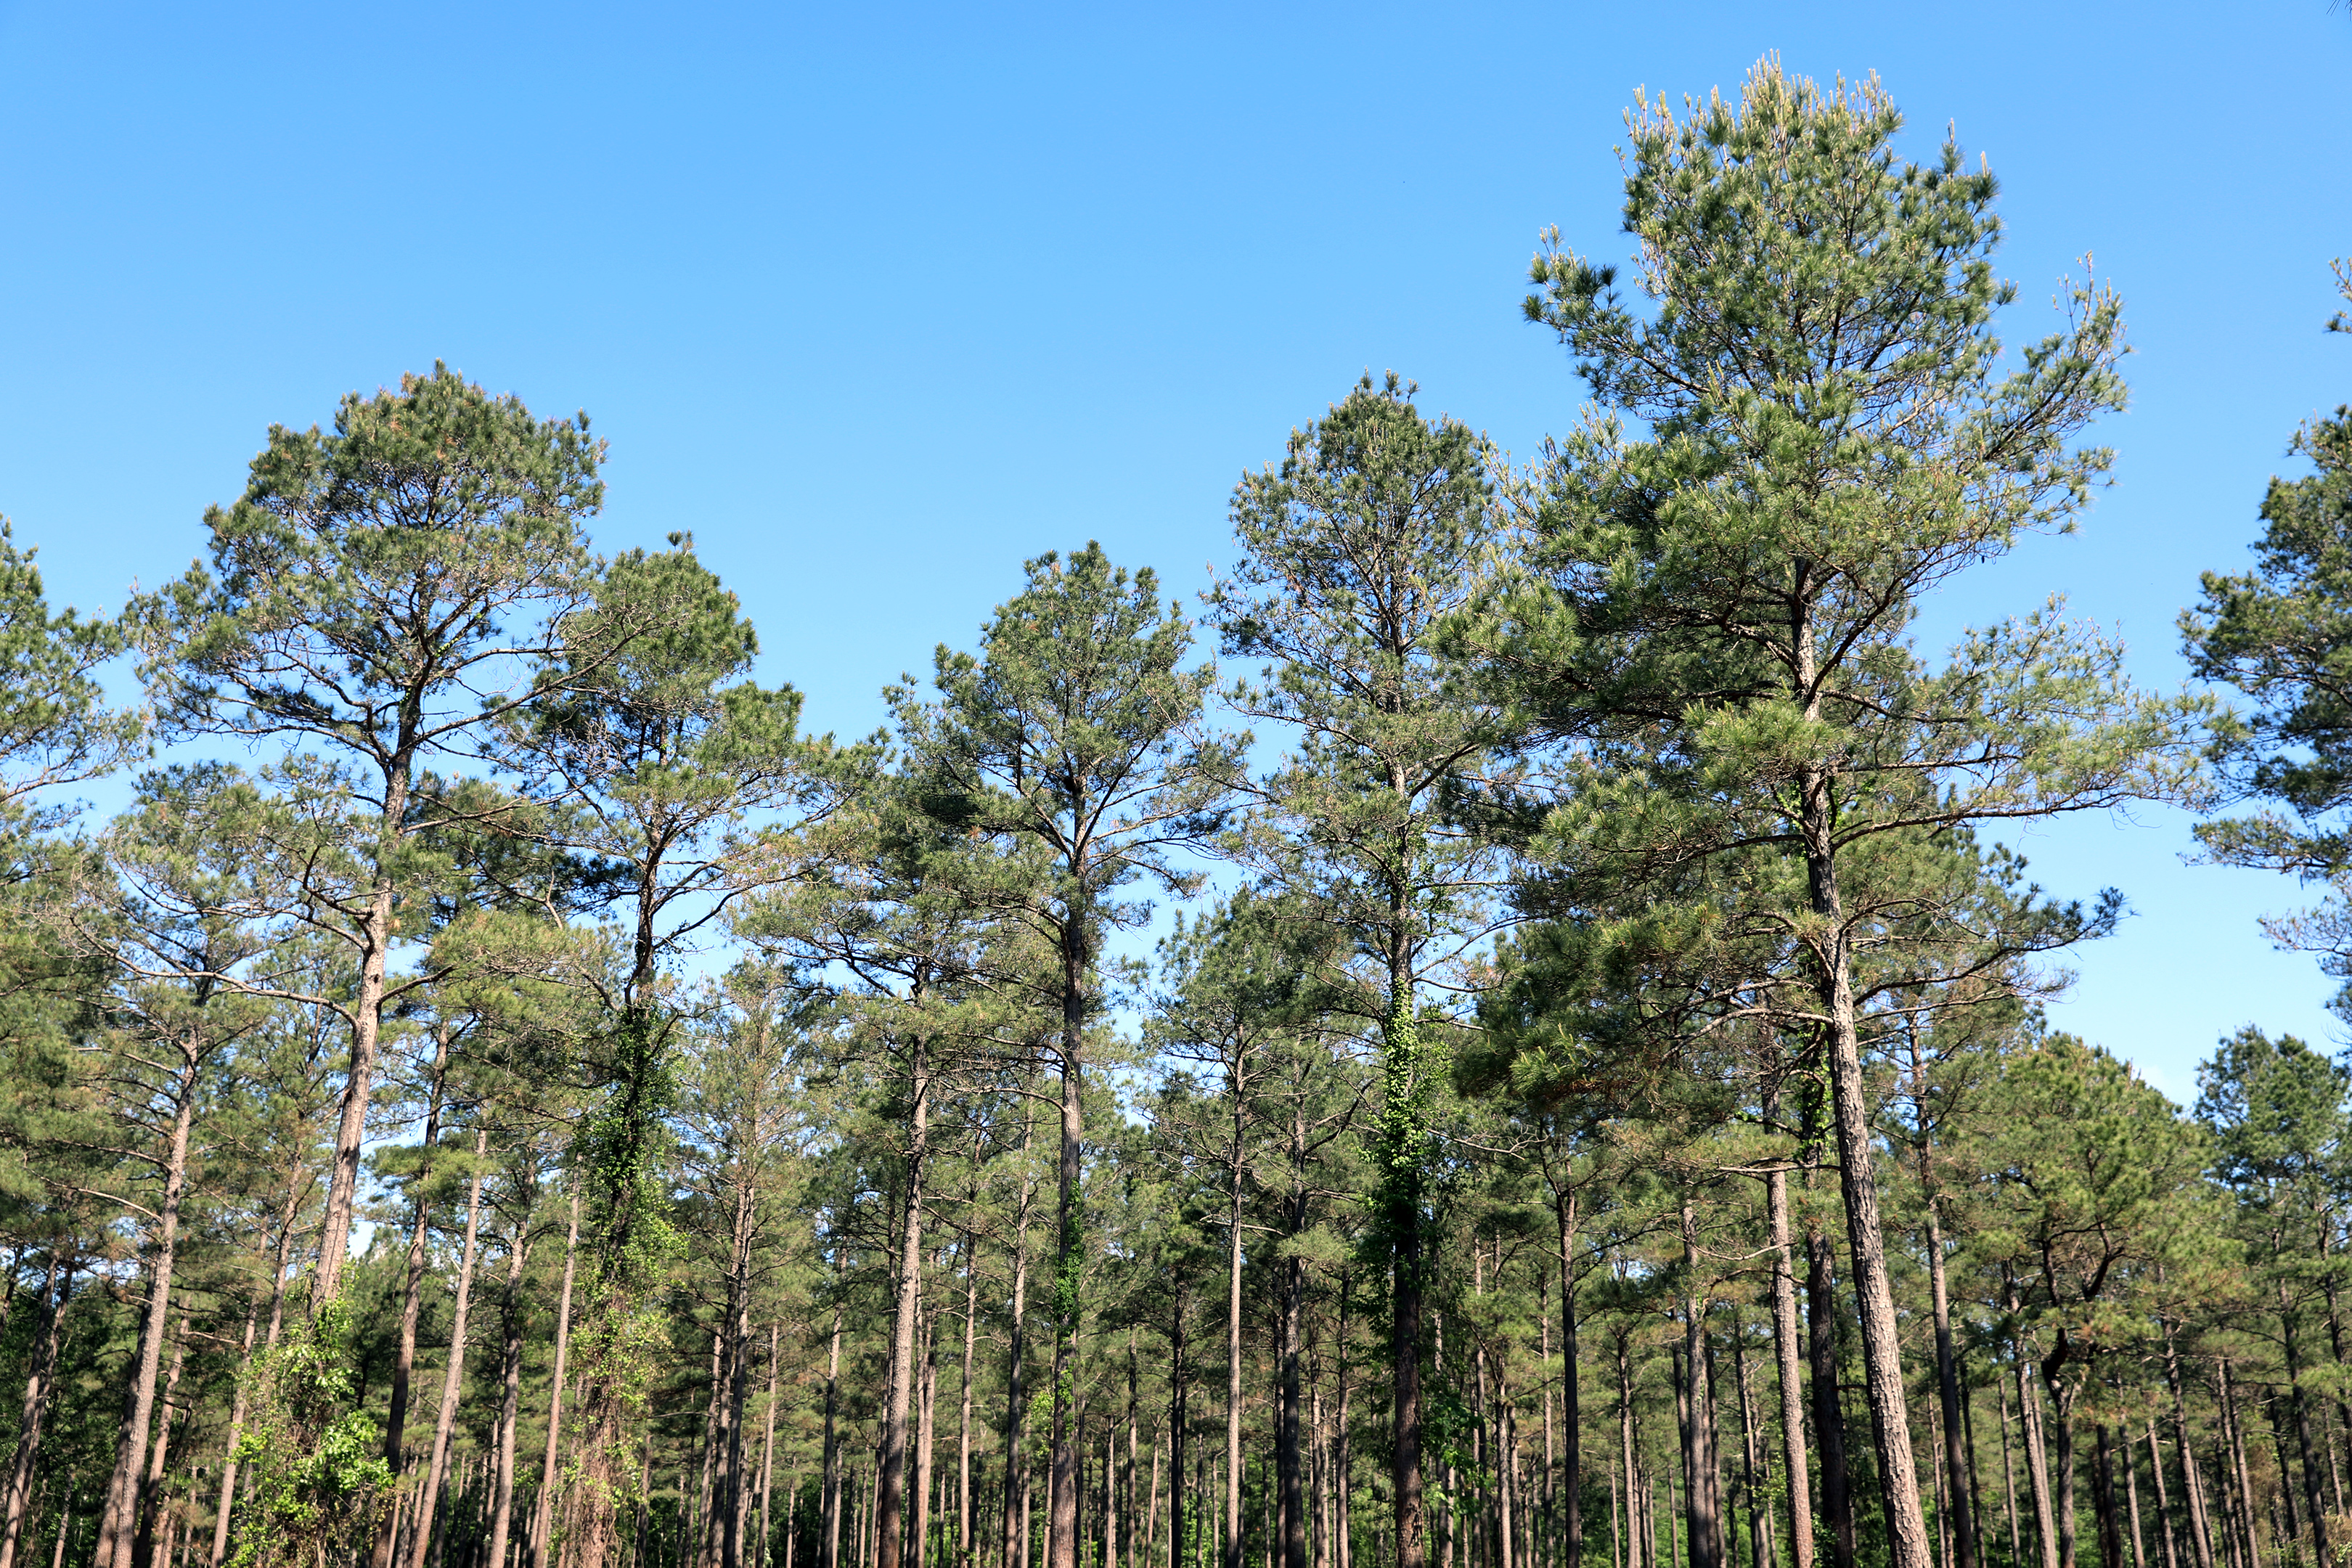
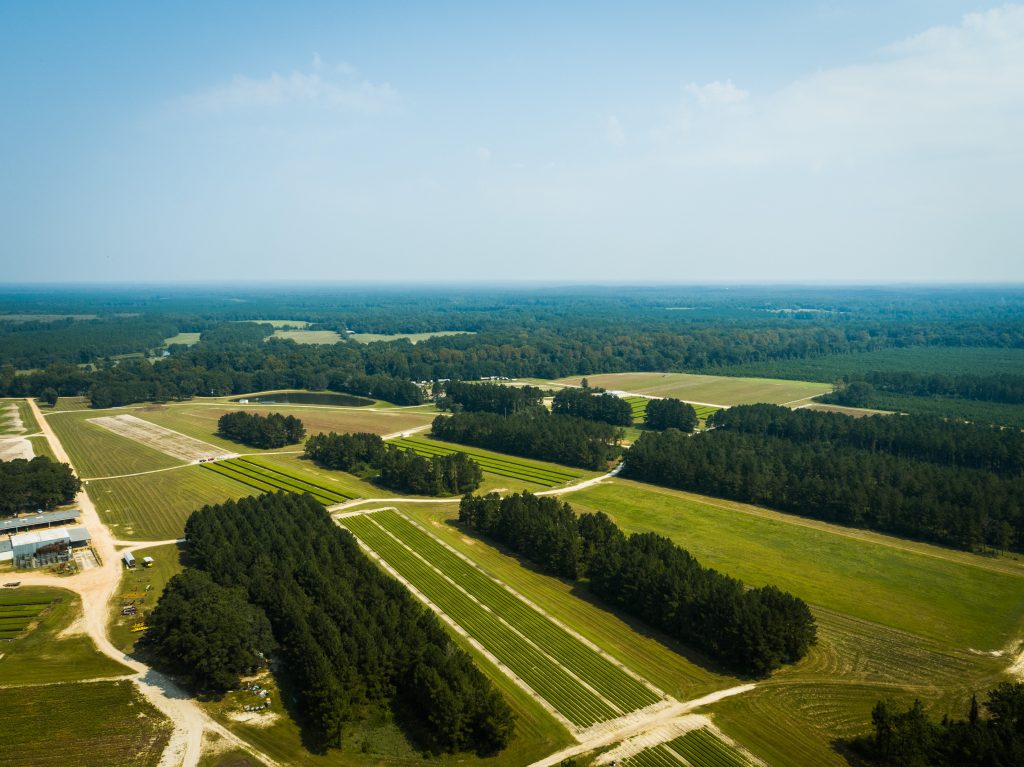
Photos: Roanoke Rapids area near the North Carolina, Virginia border, courtesy of Enviva.

Increased timberland, increased carbon stored in the forest, robust prices and new markets benefiting forest owners and forest workers, are among the findings of a report by Hood Consulting.

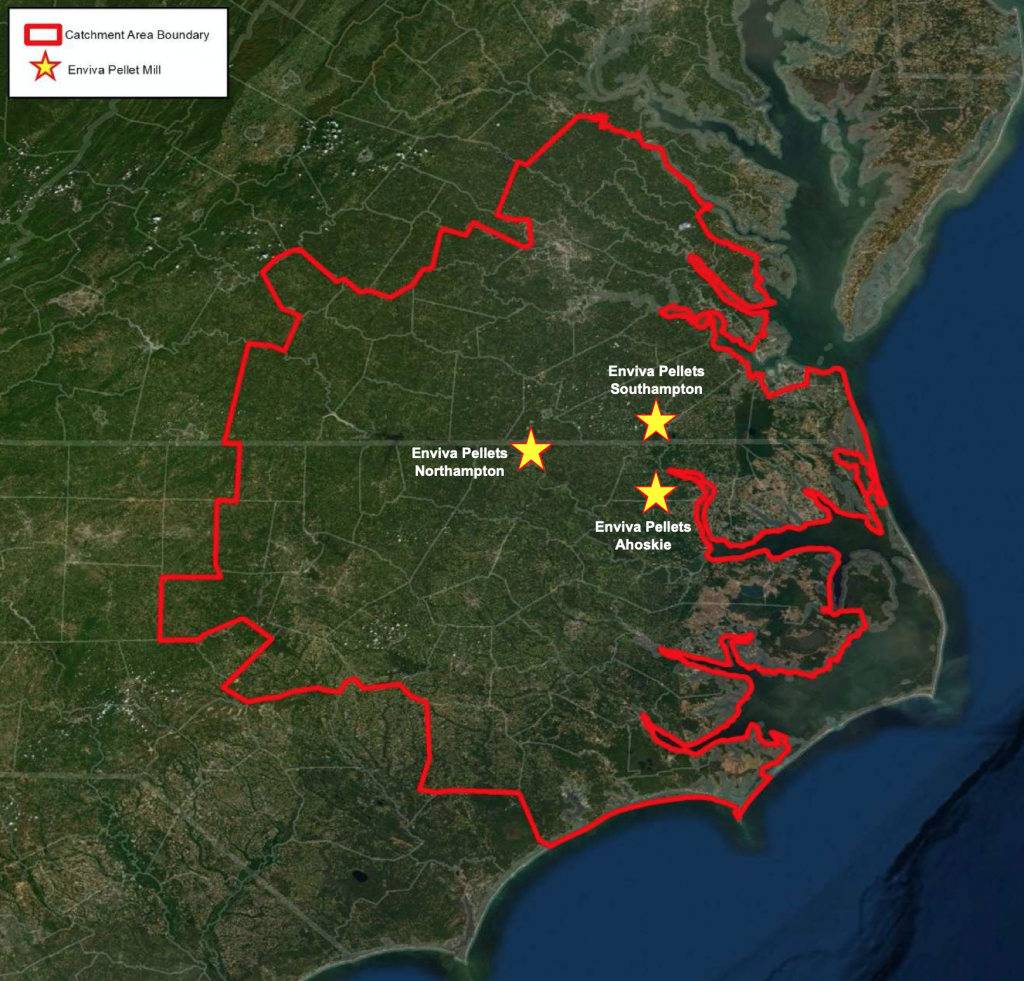
This fourth in a series of catchment area analyses for Drax looks at the area surrounding three pellet plants operated by Enviva: Ahoskie, Northampton and Southampton.

Enviva catchment area in Virginia and North Carolina

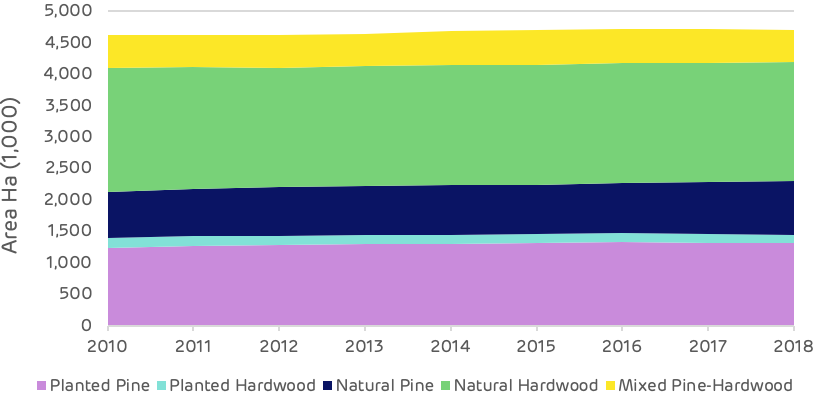
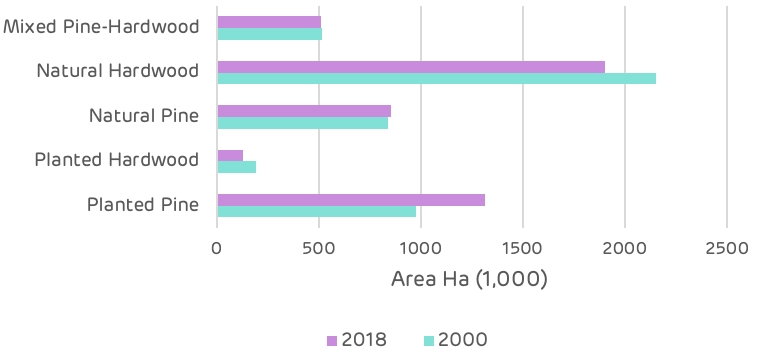
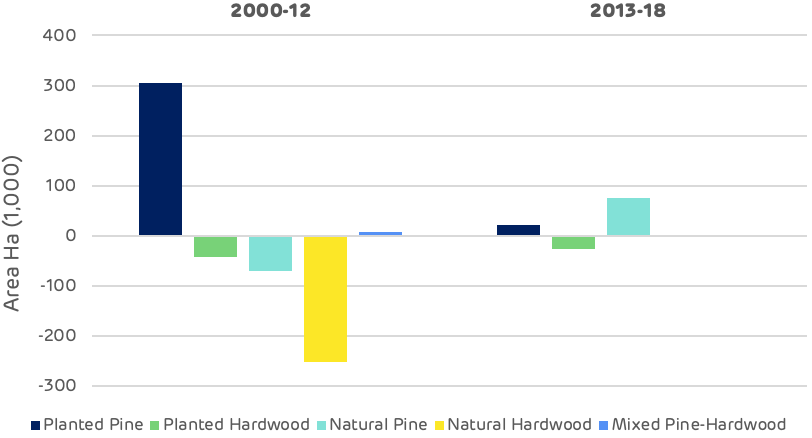
Forests and woodlands represent 68% of the total area at just over 5.4 million hectares (ha) with 87% of this area classified as timberland. The area of timberland (actively managed productive forest) has increased by around 89,000 ha since 2010 and there have been some significant changes in forest type.

The overall area of forest has increased and there is no evidence of deforestation occurring.

Land use by area

Since 2000, the total volume of standing timber in the catchment area has increased by 170 million cubic metres (m3). Sixty five percent of this increase has occurred since 2012, indicating a growing/maturing forest resource and an expanding forest area. Most of the increase in volume has been in the saw-timber categories for both pine and hardwood, although the hardwood pulpwood size class has also increased by nearly 10 million m3 since 2012 following a small decline between 2000 and 2012.

Timber inventory by product category

The increased demand from the three Enviva pellet mills, beginning operation in 2012 in the Chesapeake region, appears to have had no negative impact of the accumulation of forest carbon in the growing stock of the region. Since this time, all categories of timber product have increased.

Timber inventory by product category – pre and post-Enviva

This increase in inventory is also reflected in the comparison of average annual growth to removals. The surplus of un-cut growth has increased substantially since 2010 from 4.7 million m3 per year  to 15.9 million m3 p.a. Over this period annual growth has increased by 35.5% whereas removals have decreased by 8.6%.

Annual growth vs. removals and surplus volume

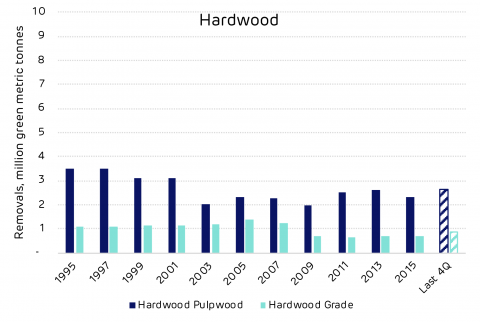
Demand for timber products has fluctuated since 2000. The global financial crisis in 2008-09 impacted all product categories, but particularly pine and hardwood saw-timber where there was a combined drop of over five million tonnes in 2010 compared to 2000. This was a loss of over 20% of total annual demand in the catchment area. Pine saw-timber has now recovered to pre-crisis levels, but hardwood demand has remained low. Hardwood pulpwood demand also declined around this time, with the closure and decline of existing pulp mills in the catchment area. Demand had fallen by one million tonnes p.a. by 2011 prior to the Enviva pellet mills opening. From 2012 the new biomass demand enabled the hardwood pulpwood market to recover to pre-crisis levels with demand in 2018 at almost exactly the same level as in 2000.

Annual demand by product category

This fluctuation in demand is reflected in the average annual stumpage price data shown on the chart below, this is the value that the forest owner gets for each product. The trends are generally as expected, with the exception of the hardwood saw-timber price, which has increased substantially despite a decrease in demand. This is due to supply chain issues, reduced capacity of loggers and access to land.

Average annual stumpage prices

Detailed below is an edited version of the consultant’s review and analysis of key issues in the catchment area.

The full version can be found in the main report.

Is there any evidence that bioenergy demand has caused the following?

Deforestation

No. US Forest Service (USFS) data shows the opposite. The total area of timberland in the Enviva Chesapeake catchment area has increased an estimated 82,818 hectares (+1.8%) since Enviva Pellets Ahoskie commenced full production in 2012.

A change in management practices (rotation lengths, thinnings, conversion from hardwood to pine)?

No / Inconclusive. Changes in management practices have occurred in the catchment area since 2012, but there is little evidence to suggest that bioenergy demand has caused these changes. Conversion of hardwood and mixed pine-hardwood timberland to planted pine timberland has occurred in the catchment area.

Diversion from other markets

No / Inconclusive. Since 2012, pulpwood demand not attributed to bioenergy has decreased 19%; however, this decrease is largely attributed to decreased demand from the pulp/paper sector. Also, demand for softwood and hardwood sawlogs have increased an estimated 14% and 7%, respectively, since 2012.

An unexpected increase in wood prices

No / Inconclusive. The increase in hardwood biomass demand coincided with price increases of 10-24% for delivered hardwood pulpwood. These price increases were likely linked to a combination of both supply chain issues (shortage of local loggers following pulp/paper mill closures in the region) and elevated prices offered by Enviva to ensure guaranteed wood supply for the first several years of operation, as prices for delivered hardwood pulpwood and hardwood chips proceeded to decline 16% and 9%, respectively, from 2014 to2017 once the market stabilised.

Since 2014, prices for pine products have held flat even though softwood raw material purchases (demand) by Enviva have more than doubled. In this catchment area, changes in pine pulpwood and pine chip prices are largely driven by demand attributed to the pulp/paper sector.

A reduction in growing stock timber

No. Total growing stock inventory in the catchment area increased 19% from 2012 through 2018. Over this period, inventories increased as follows for each of the five major timber products: +33% for pine sawtimber, +23% for pine chip-n-saw, +14% for pine pulpwood, +12% for hardwood sawtimber, and +14% for hardwood pulpwood.

The increase in timber inventory can be linked to a combination of increased forest area (additional hectares = additional inventory) and annual harvest levels below the sustainable yield capacity of the catchment area forest (i.e. annual growth has continued to exceed annual removals, resulting in increased inventory levels).

A reduction in the sequestration rate of carbon

No. US Forest Service data shows the average annual growth rate of growing stock timber has increased slightly since 2012. Increased timber growth rates/carbon sequestration rates can be linked to a combination of changes in species composition and silvicultural practices.

Softwood (pine) grows at a much quicker rate compared to hardwood species, and in the Enviva Chesapeake catchment area, pine timberland area increased from 43.6% of total timberland area in 2011 to 46.0% in 2018. Also, improvements in silviculture have continued to enhance growth and overall productivity. Together, these factors help explain how average per hectare volume growth increased from 5.9 m3 in 2011 to 7.7 m3 in 2018.

An increase in harvesting above the sustainable yield capacity of the forest area

No. In 2018, the latest available, growth-to-removals ratio for pine and hardwood pulpwood, the timber products utilised by bioenergy, equalled 2.49 and 2.76, respectively (a value greater than 1.0 indicates sustainable harvest levels). Even with the increased harvesting required to satisfy bioenergy demand, harvest levels remain well below the sustainable yield capacity of the catchment forest area.

What has been the impact of bioenergy demand on?

Timber growing stock inventory

Neutral. Total wood demand increased an estimated 14% from 2012-2018, and much of that increase can be attributed to increased demand from bioenergy. In this catchment area, inventories are so substantial that increases in demand from bioenergy, as well as from other sources, have not been great enough to offset annual timber growth. Total growing stock inventory has continued to increase – an average of 2.9% per year since Enviva first entered this market in 2012.

Timber growth rates

Neutral. Timber growth rates have increased for pine sawtimber, pine chip-n-saw, pine pulpwood, and hardwood pulpwood since 2012; hardwood sawtimber growth rates have declined slightly. Evidence suggests these overall increases in growth rates are linked to changes in age class distribution (i.e. a younger forest), not due to changes in bioenergy demand

Forest area

Positive / Neutral. Total forest (timberland) area in the catchment area increased nearly 83,000 hectares (+1.8%) from 2012 through 2018, the latest available. Our analysis of biomass demand and forest area found a strong positive correlation between these two variables but also a moderately strong correlation between softwood sawlog demand and forest area.

Wood prices

Neutral / Negative. The additional wood demand placed on this market by Enviva from 2012-2014 coincided with a 19% increase in delivered pine pulpwood price and a 24% increase in delivered hardwood pulpwood price. Pine and hardwood chip prices also increased 10-11% over this period. Analysis found evidence that increases in hardwood pulpwood and hardwood chip prices can be linked to increases in total hardwood pulpwood demand. However, given that hardwood bioenergy demand has accounted for over 75% of total hardwood pulpwood demand in the catchment area since 2014, it is reasonable to conclude that hardwood pulpwood demand attributed to bioenergy has had some level of impact on delivered hardwood pulpwood and hardwood chip prices.

Markets for solid wood products

Positive. In the Enviva Chesapeake catchment area, demand for softwood and hardwood sawlogs used to produce lumber and other solid wood products increased 15% and 9%, respectively, from 2012-2018. A by-product of the sawmilling process are sawmill residuals – a material utilied by Enviva’s three mills to produce wood pellets. With the increased production of both softwood and hardwood lumber, so too has come an increase in sawmill residuals, some of which has been purchased/consumed by Enviva.

Not only has Enviva benefited from the greater availability of this by-product, but lumber producers have also benefited, as Enviva’s three mills have provided an additional outlet for these producers and their by-products.

Forest landowners

Positive. Increased demand attributed to bioenergy has been a positive for forest landowners in the Chesapeake catchment area. Not only has bioenergy provided an additional outlet for pulpwood (particularly hardwood pulpwood), but the increase in pulpwood prices as a result of an overall increase in both softwood and hardwood pulpwood demand has transferred through to landowners (improved compensation).

Specifically, since 2013 (the first year all three Enviva pellet mills were operating), hardwood pulpwood stumpage price – the price paid to landowners – has averaged roughly $5.60 per ton in the Chesapeake catchment area. This represents a 47% increase over the approximately $3.80 per ton averaged by hardwood pulpwood stumpage in the catchment area over the 10 years prior (2003-2012). Similarly, pine pulpwood stumpage price has averaged $12.95 per ton in the catchment area since 2013, up 67% from the 2003-2012 average of $7.75 per ton.

Read the full report: Catchment Area Analysis of Forest Management and Market Trends: Enviva Pellets Ahoskie, Enviva Pellets Northampton, Enviva Pellets Southampton (UK metric version). Read the Drax forestry team’s blog ‘Changing forest structure in Virginia and North Carolina. Explore Enviva’s supply chain via Track & Trace. This is part of a series of catchment area analyses around the forest biomass pellet plants supplying Drax Power Station with renewable fuel. Others in the series include: Georgia Mill, Estonia, Latvia, Morehouse Bioenergy and Amite Bioenergy.

In a crisis people come first

This crisis will be remembered for many things. Many are not positive, but some are inspiring. Around the world we’ve seen tremendous acts of kindness and witnessed remarkable resilience from people continuing to live, work and to support one another. The actions we are all taking as individuals, businesses and communities will not only help us get through this crisis, they will shape how we emerge from it.

At Drax we are proud of the ongoing role we’re playing in supporting the UK and its essential services, continuing to generate and supply the electricity needed to keep people healthy and the economy running.

It is what we have always done, and it is what we will continue to do.

This is possible because our people have continued to carry out their important work in these uncertain times safely and responsibly. My leadership team in the UK and US must continue to support them, and we must also support the communities they are a part of.

Employees Drax Power Station show their support and appreciation for the heroic efforts of those within the NHS by turning one of its cooling towers blue at 8pm each Thursday

Employees Drax Power Station show their support and appreciation for the heroic efforts of those within the NHS by turning one of its cooling towers blue at 8pm each Thursday

Our communities are at the core of what we do and who we are. They support our business globally and enable us to supply energy to the country. We have a responsibility to do what we can to help them through this crisis.

To do this we have put together a Covid-19 support package totalling more than three quarters of a million pounds that goes beyond just financing to make a positive impact. I’d like to highlight a few of these.

Supporting communities in Great Britain and the US

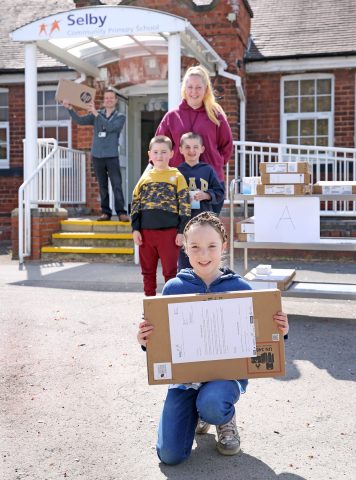
The Robinson family collect their laptop at Selby Community Primary School

The closures of schools and the need to turn homes into classrooms has been one of the biggest changes for many families. With children now depending on technology and the internet for schooling, there’s a very real chance those without access may fall behind, with a long term negative impact on their education.

We want to ensure no child is left out. So, we have donated £250,000 to buy 853 new laptops, each with three months of pre-paid internet access, and delivered them to schools and colleges local to our sites across the UK.

This has been implemented by Drax, working closely with headteachers. As one of our local heads Ian Clennan told us: “Schools don’t just provide education – they’re a whole support system. Having computers and internet access means pupils can keep in touch with their teachers and classmates more easily too – which is also incredibly important at the moment.”

In the US, we’re donating $30,000 to support hardship funds for the communities where we operate. Our colleagues in Louisiana are playing an active role in the community, and in Amite County, Mississippi, they have helped provide PPE to first responders as well as supporting charities for the families worse affected.

Helping businesses, starting with the most vulnerable

As an energy supplier to small and medium sized businesses (SMEs), we must act with compassion and be ready to help those who are most economically exposed to the crisis. To do this, we are launching a number of initiatives to support businesses, starting with some of the most vulnerable.

It’s clear that care homes require extra support at this time. We are offering energy bill relief for more than 170 small care homes situated near our UK operations for the next two months, allowing them to divert funds to their other priorities such as PPE, food or carer accommodation.

But it is also important we understand how difficult a period this is for small businesses of all kinds. Many of our customers are facing financial pressure that was impossible to forecast. To help relieve this, we have agreed deferred payment plans with some of our customers who are unable to pay in full. We have also extended current energy prices for three months for 4,000 customers of Opus Energy who have not been able to secure a new contract during this period.

The impact of this crisis will be long term, so we made a significant, two-year charitable donation to Business Debtline. A dedicated phoneline and webpage will be provided to our small businesses customers, offering free debt advice and helping them to recover for the future.

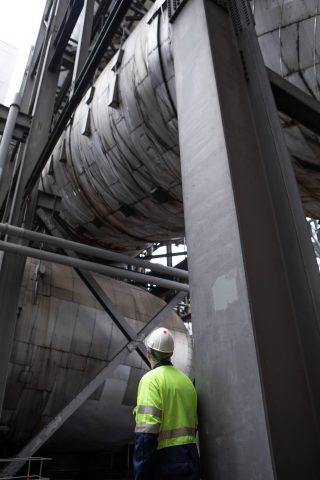
An engineer looks up at flue gas desulphurisation unit (FGD) at Drax Power Station. The massive pipe would transport flue gas from the Drax boilers to the carbon capture and storage (CCS) plant for CO<sub>2</sub> removal of between 90-95%.

An engineer looks up at flue gas desulphurisation unit (FGD) at Drax Power Station. The massive pipe would transport flue gas from the Drax boilers to the carbon capture and storage (CCS) plant for CO2 removal of between 90-95%.

Change for the future recovery

While there is still uncertainty around how the UK, the US and the world will emerge from the pandemic it is the responsibility of the whole energy industry to show compassion for its customers and to take the actions needed to soften the economic blow that Covid-19 is having across the globe.

The disruption to normal life caused by the pandemic has changed how the country uses electricity overnight. In the coming weeks we will be publishing a more in-depth view from Electric Insights showing exactly what effect this has had and what it might reveal for the future of energy.

No matter what that future holds, however, we will remain committed to enabling a zero carbon, lower cost energy future. This will mean not only supporting our people, our communities and our countries through the coronavirus crisis, but striving for a bright and optimistic future beyond it. A future where people’s immediate health, safety and economic wellbeing are prioritised alongside solutions to another crisis – that of climate change.

From steel to soil – how industries are capturing carbon

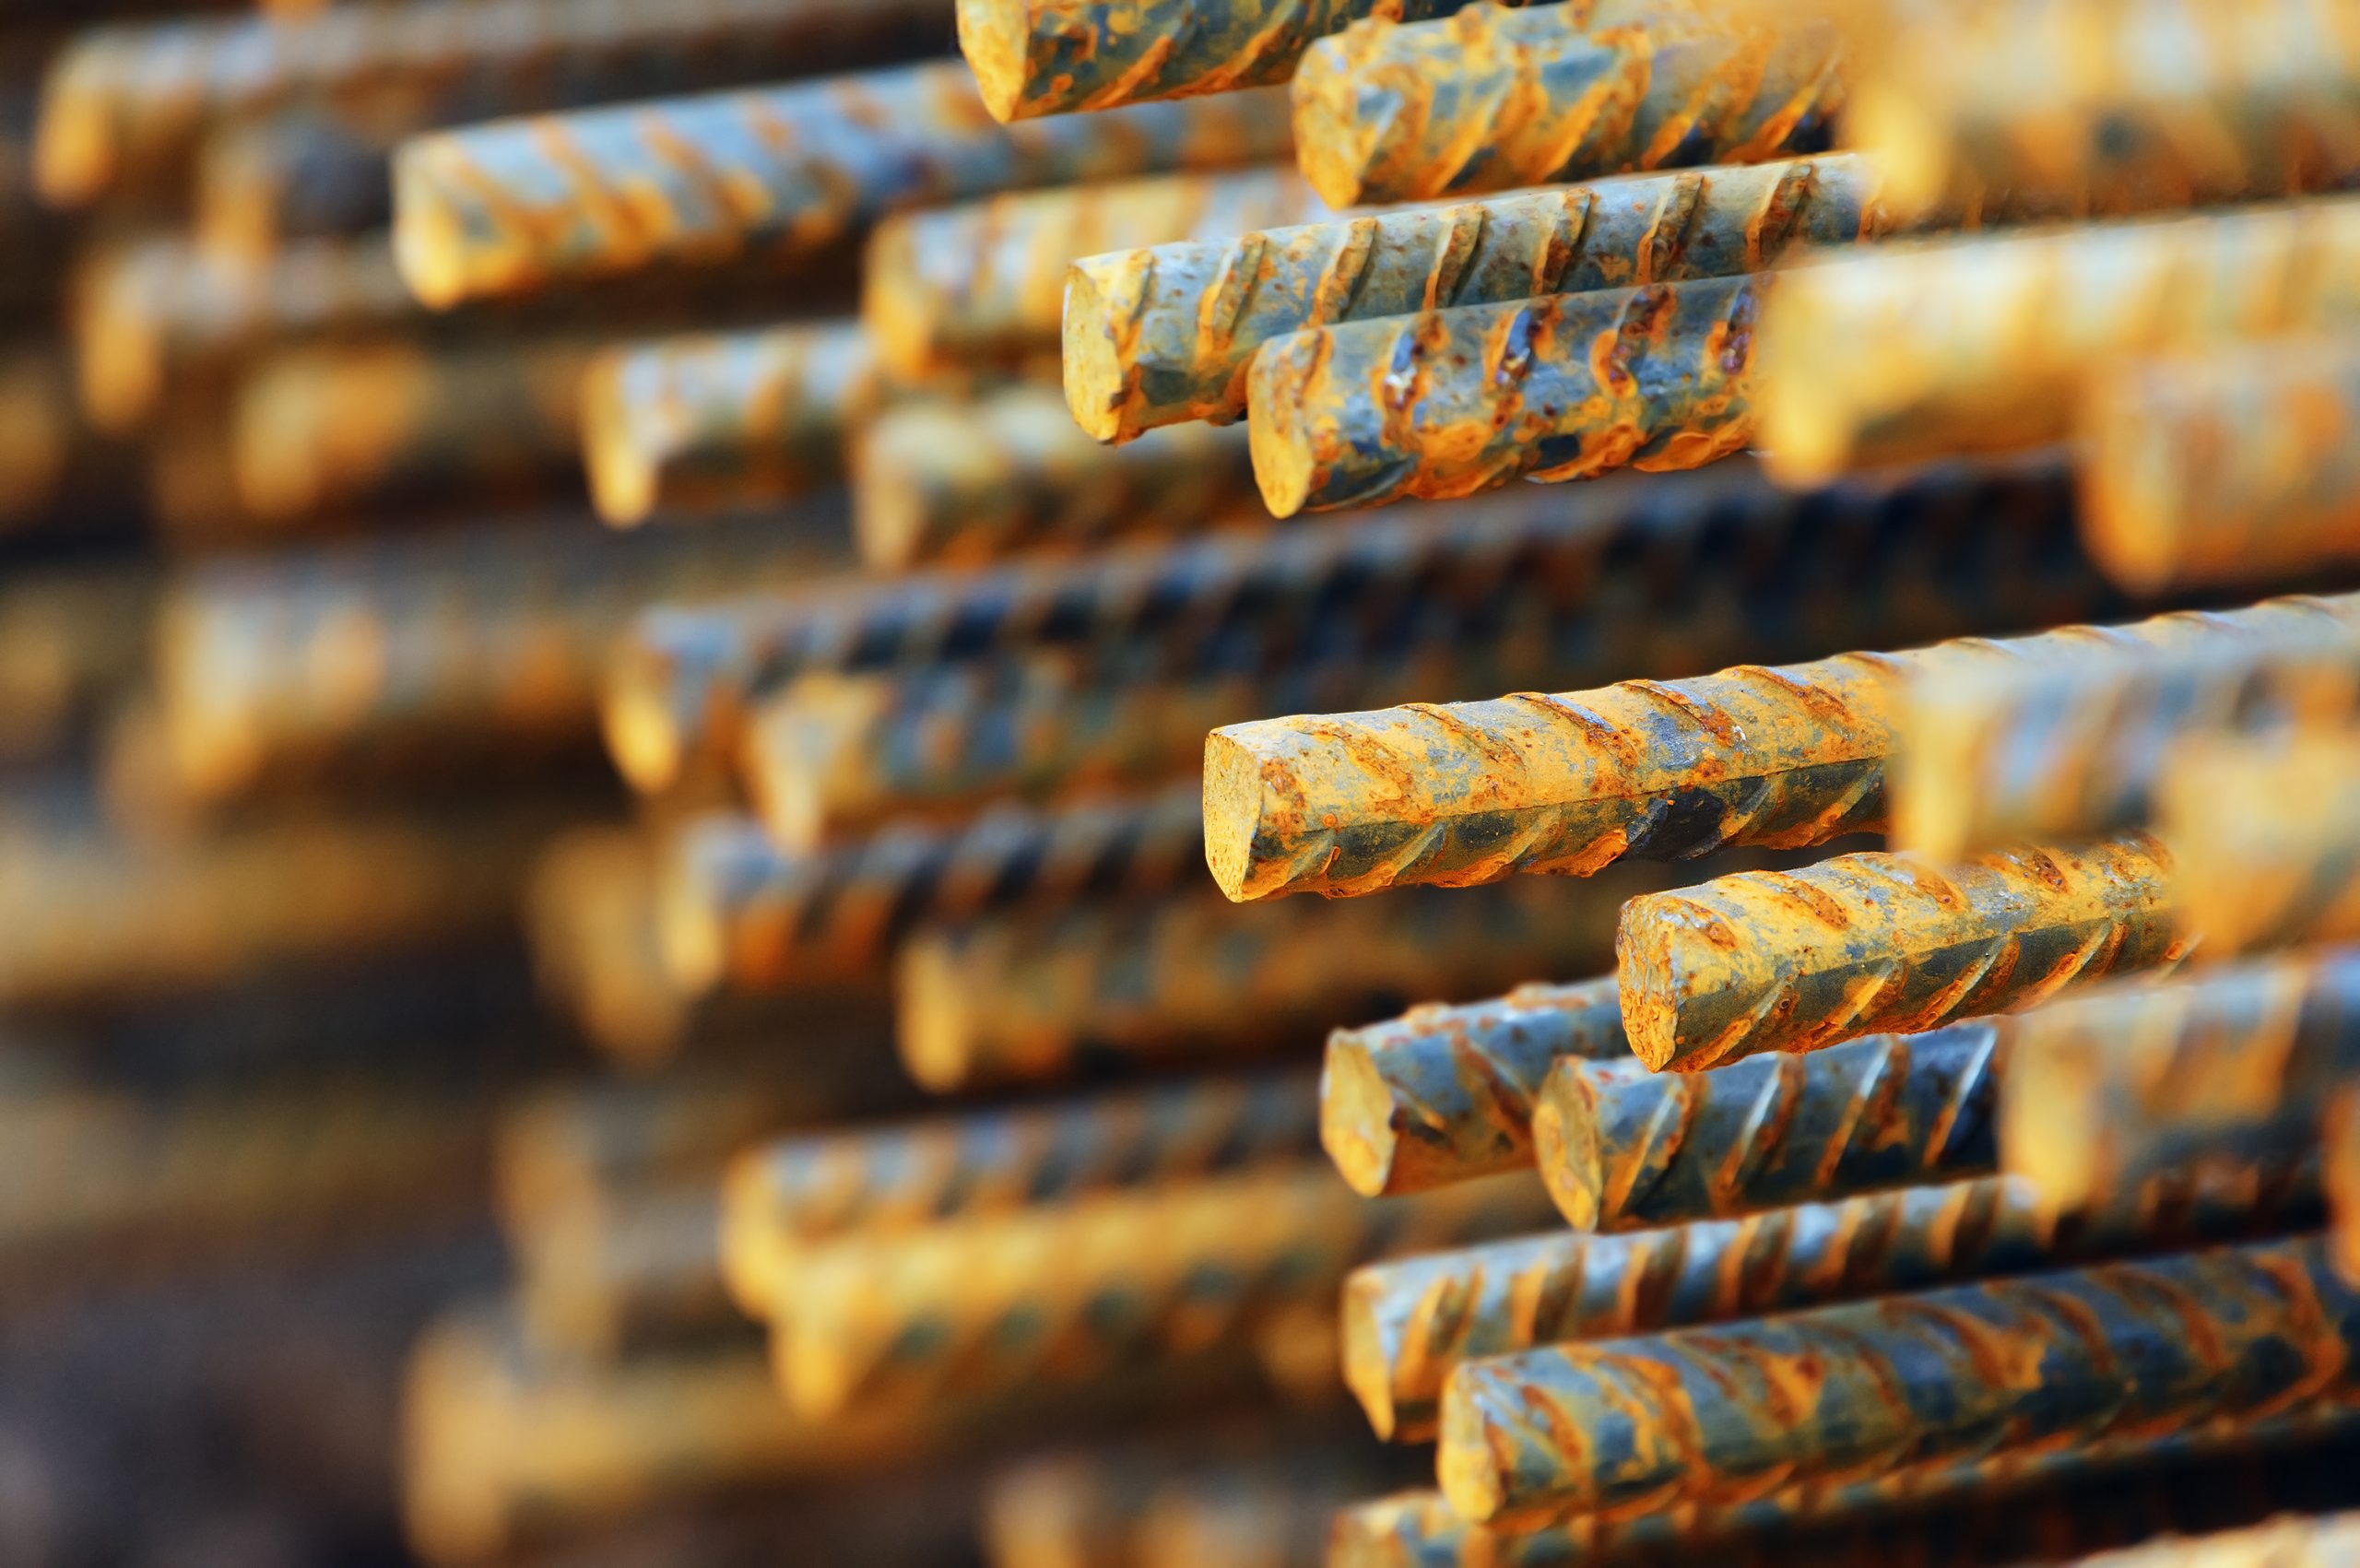
Construction metallic bars in a row

Carbon capture, use and storage (CCUS) is a vital technology in the energy industry, with facilities already in place all over the world aiming to eliminate carbon dioxide (CO2) emissions.

However, for decarbonisation to go far enough to keep global warming below 2oC – as per the Paris Climate Agreement – emission reductions are needed throughout the global economy.

From cement factories to farmland, CCUS technology is beginning to be deployed in a wide variety of sectors around the world.

Construction

The global population is increasingly urban and by 2050 it’s estimated 68% of all people will live in cities. For cities to grow sustainably, it’s crucial the environmental impact of the construction industry is reduced.

Construction currently accounts for 11% of all global carbon emissions. This includes emissions from the actual construction work, such as from vehicle exhaust pipes, but a more difficult challenge is reducing embedded emissions from the production of construction materials.

Steel and concrete are emissions-heavy to make; they require intense heat and use processes that produce further emissions. Deploying widespread CCUS in the production of these two materials holds the key to drastically reducing carbon emissions from the built environment.

Steel manufacturing alone, regardless of the electricity used to power production, is responsible for about 7% of global emissions. Projects aimed at reducing the levels of carbon released in production are planned in Europe and are already in motion in the United Arab Emirates.

Abu Dhabi National Oil Company and Masdar, a renewable energy and sustainability company, formed a joint venture in 2013 with the aim of developing commercial-scale CCUS projects.

In its project with Emirates Steel, which began in 2016, about 800,000 tonnes of CO2 is captured a year from the steel manufacturing plant. This is sequestered and used in enhanced oil recovery (EOR). The commercially self-sustaining nature of this project has led to investigation into multiple future industrial-scale projects in the region.

Cement manufacturing, a process that produces as much as 8% of global greenhouse gases, is also experiencing the growth of innovative CCUS projects.

Pouring ready-mixed concrete after placing steel reinforcement to make the road by mixing in construction site

Norcem Cement plant in Brevik, Norway has already begun experimenting with CCUS, calculating that it could capture 400,000 tonnes of CO2 per year and store it under the North Sea. If the project wins government approval, Norcem could commence operations as soon as 2023.

However, as well as reducing emissions from traditional cement manufacturing and the electricity sources that power it, a team at Massachusetts Institute of Technology is exploring a new method of cement production that is more CCUS friendly.

By pre-treating the limestone used in cement creation with an electrochemical process, the CO2 produced is released in a pure, concentrated stream that can be more easily captured and sequestered underground or harnessed for products, such as fizzy drinks.

Agriculture

It’s hard to overstate the importance of the agriculture industry. As well as feeding the world, it employs a third of it.

Within this sector, fertiliser plays an essential role in maintaining the global food supply. However, the fertiliser production industry represents approximately 2% of global CO2 emissions.

CCUS technology can reduce the CO2 contributions made by the manufacturing of fertiliser, while maintaining crop reliability. In 2019, Oil and Gas Climate Initiative’s (OGCI) Climate Investments announced funding for what is expected to be the biggest CCUS project in the US.

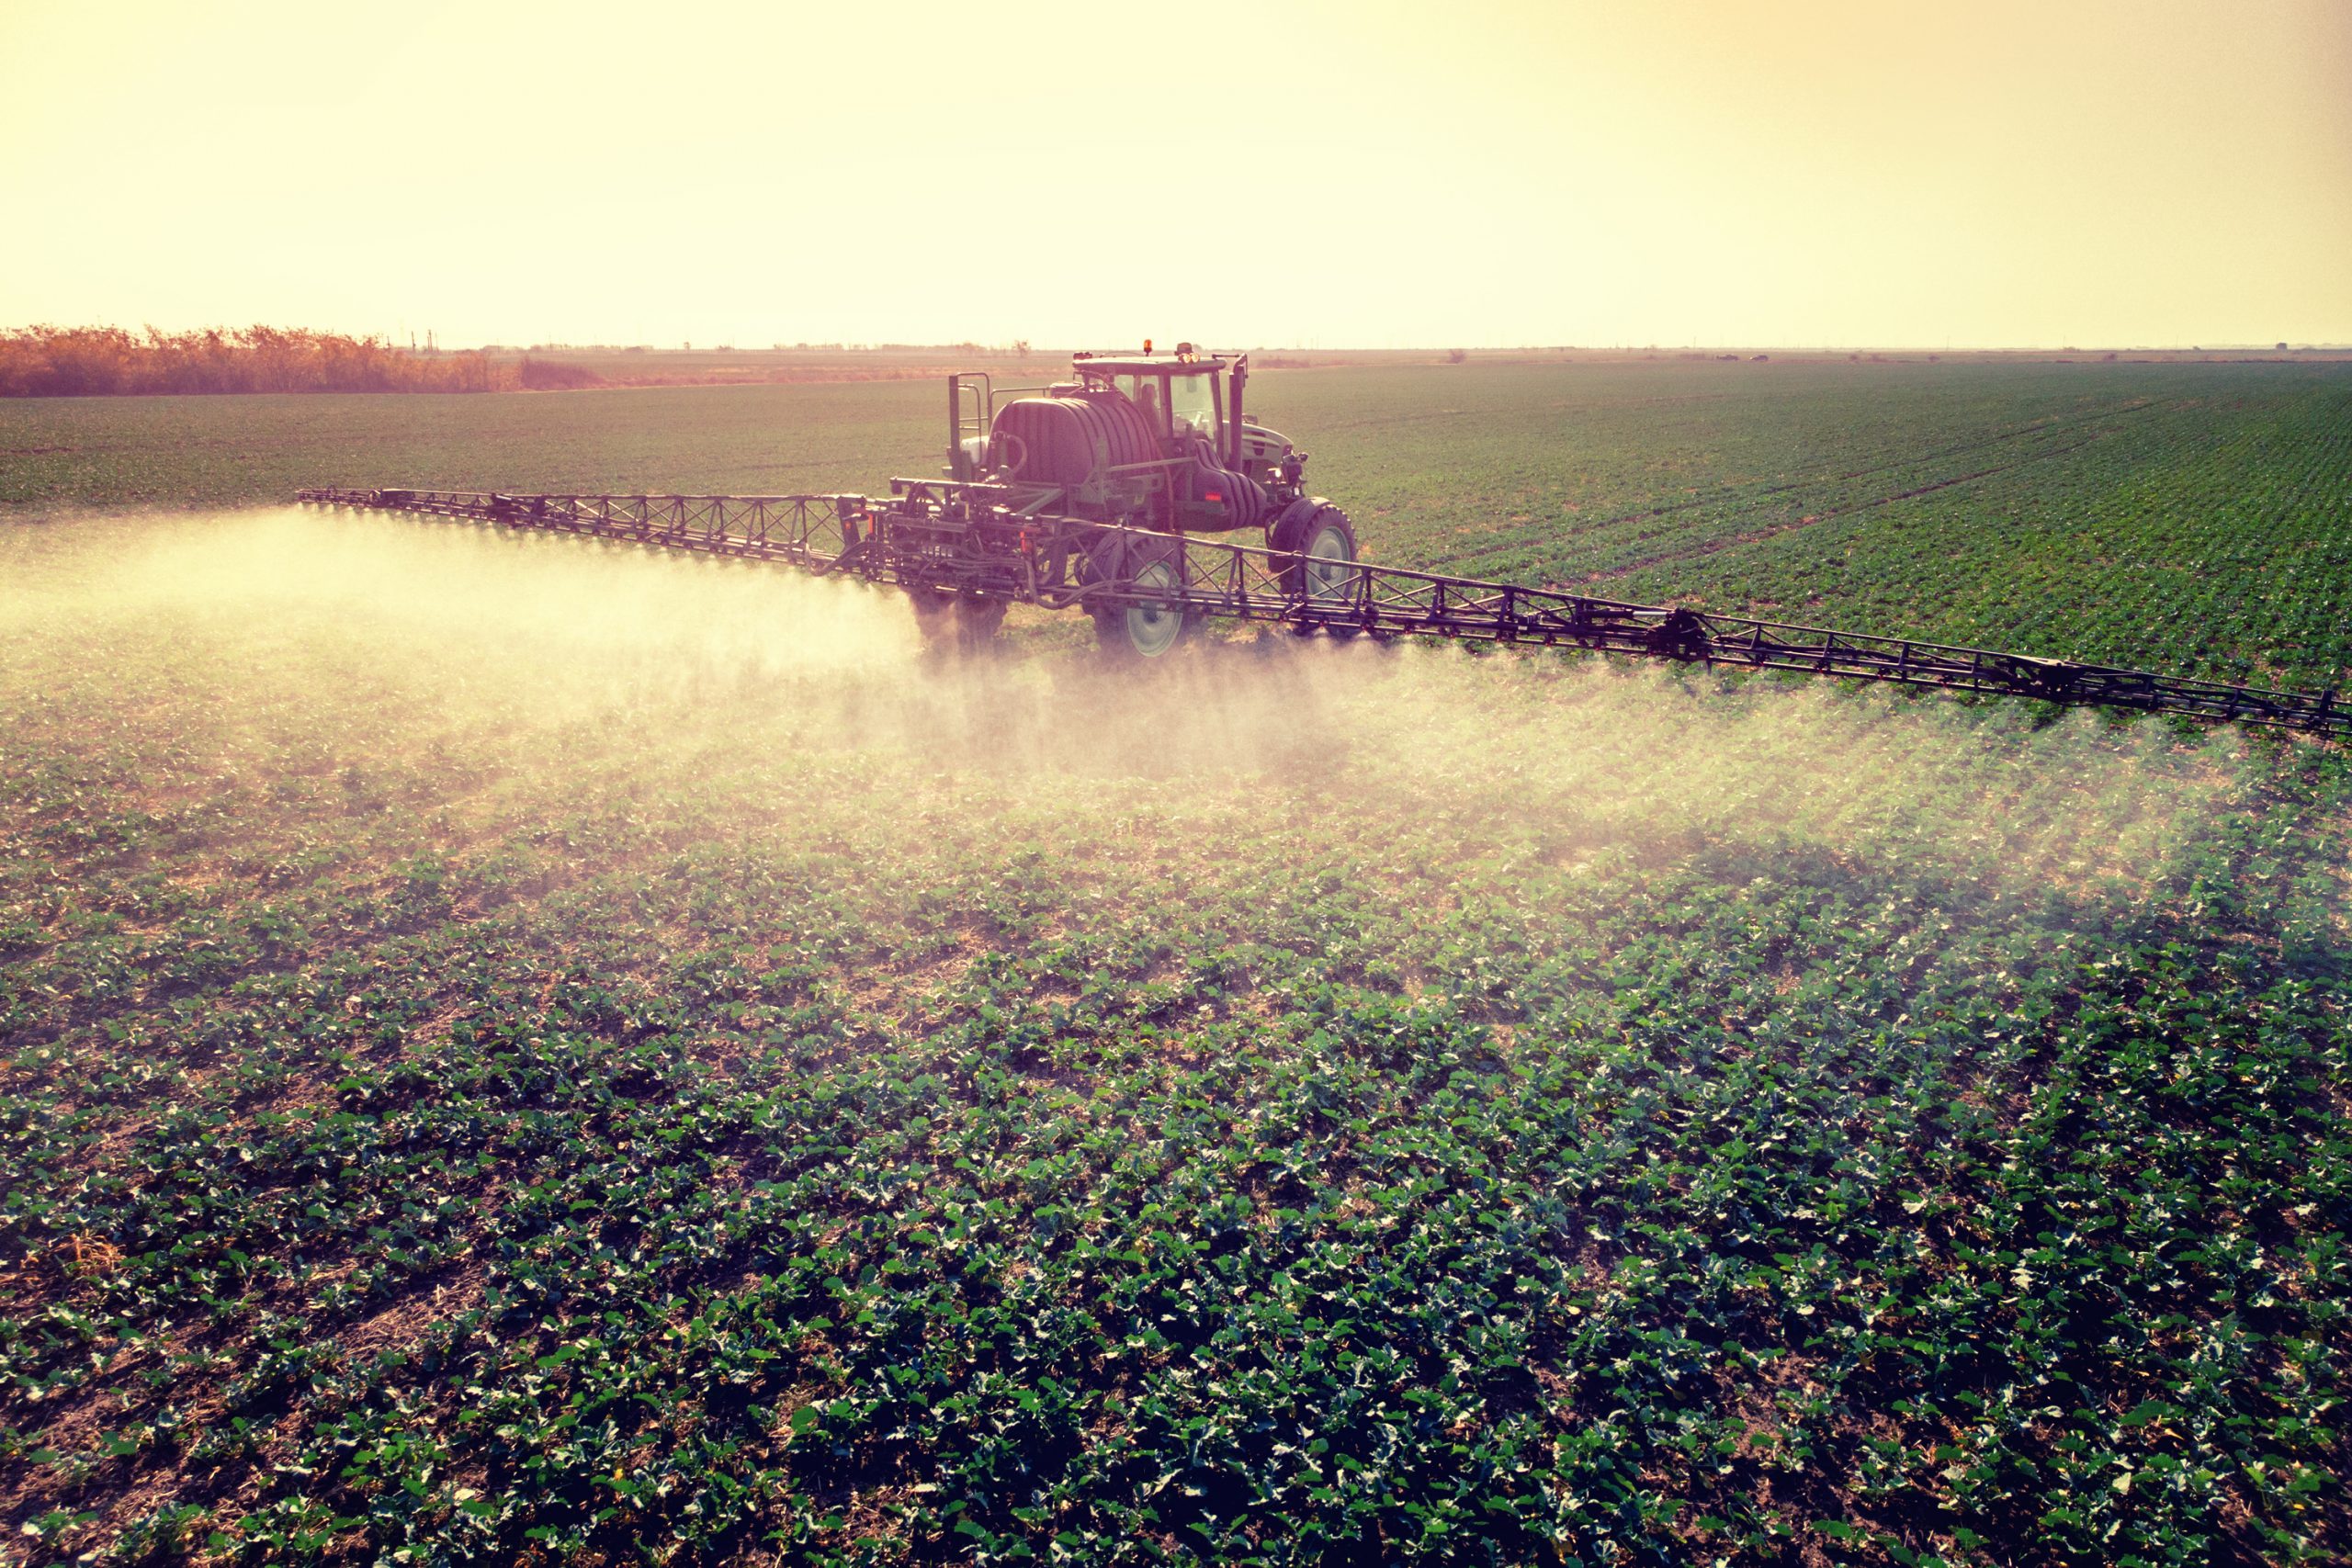
Tractor with pesticide fungicide insecticide sprayer on farm land top view Spraying with pesticides and herbicides crops

Based at the Wabash Valley Resources fertiliser plant in Indiana, the project will capture between 1.3 and 1.6 million tonnes of CO2 from the ammonia producer per year. The captured carbon will then be stored 2,000 metres below ground in a saline aquifer.

Similarly, since the turn of the millennium Mitsubishi Heavy Industries Engineering has deployed CCUS technology at fertiliser plants around Asia. CO2 is captured from natural gas pre-combustion, and used to create the urea fertiliser.

However, the agriculture industry can also capture carbon in more nature-based and cheaper ways.

Soil acts as a carbon sink, capturing and locking in the carbon from plants and grasses that die and decay into it. However, intensive ploughing can damage the soil’s ability to retain CO2.

It only takes slight adjustments in farming techniques, like minimising soil disturbance, or crop and grazing rotations, to enable soil and grasslands to sequester greater levels of CO2 and even make farms carbon negative.

Transport

The transport sector is the fastest growing contributor to climate emissions, according to the World Health Organisation. Electric vehicles and hydrogen fuels are expected to serve as the driving force for much of the sector’s decarbonisation, however, at present these technologies are only really making an impact on roads. There are other essential modes of transport where CCUS has a role to play. 

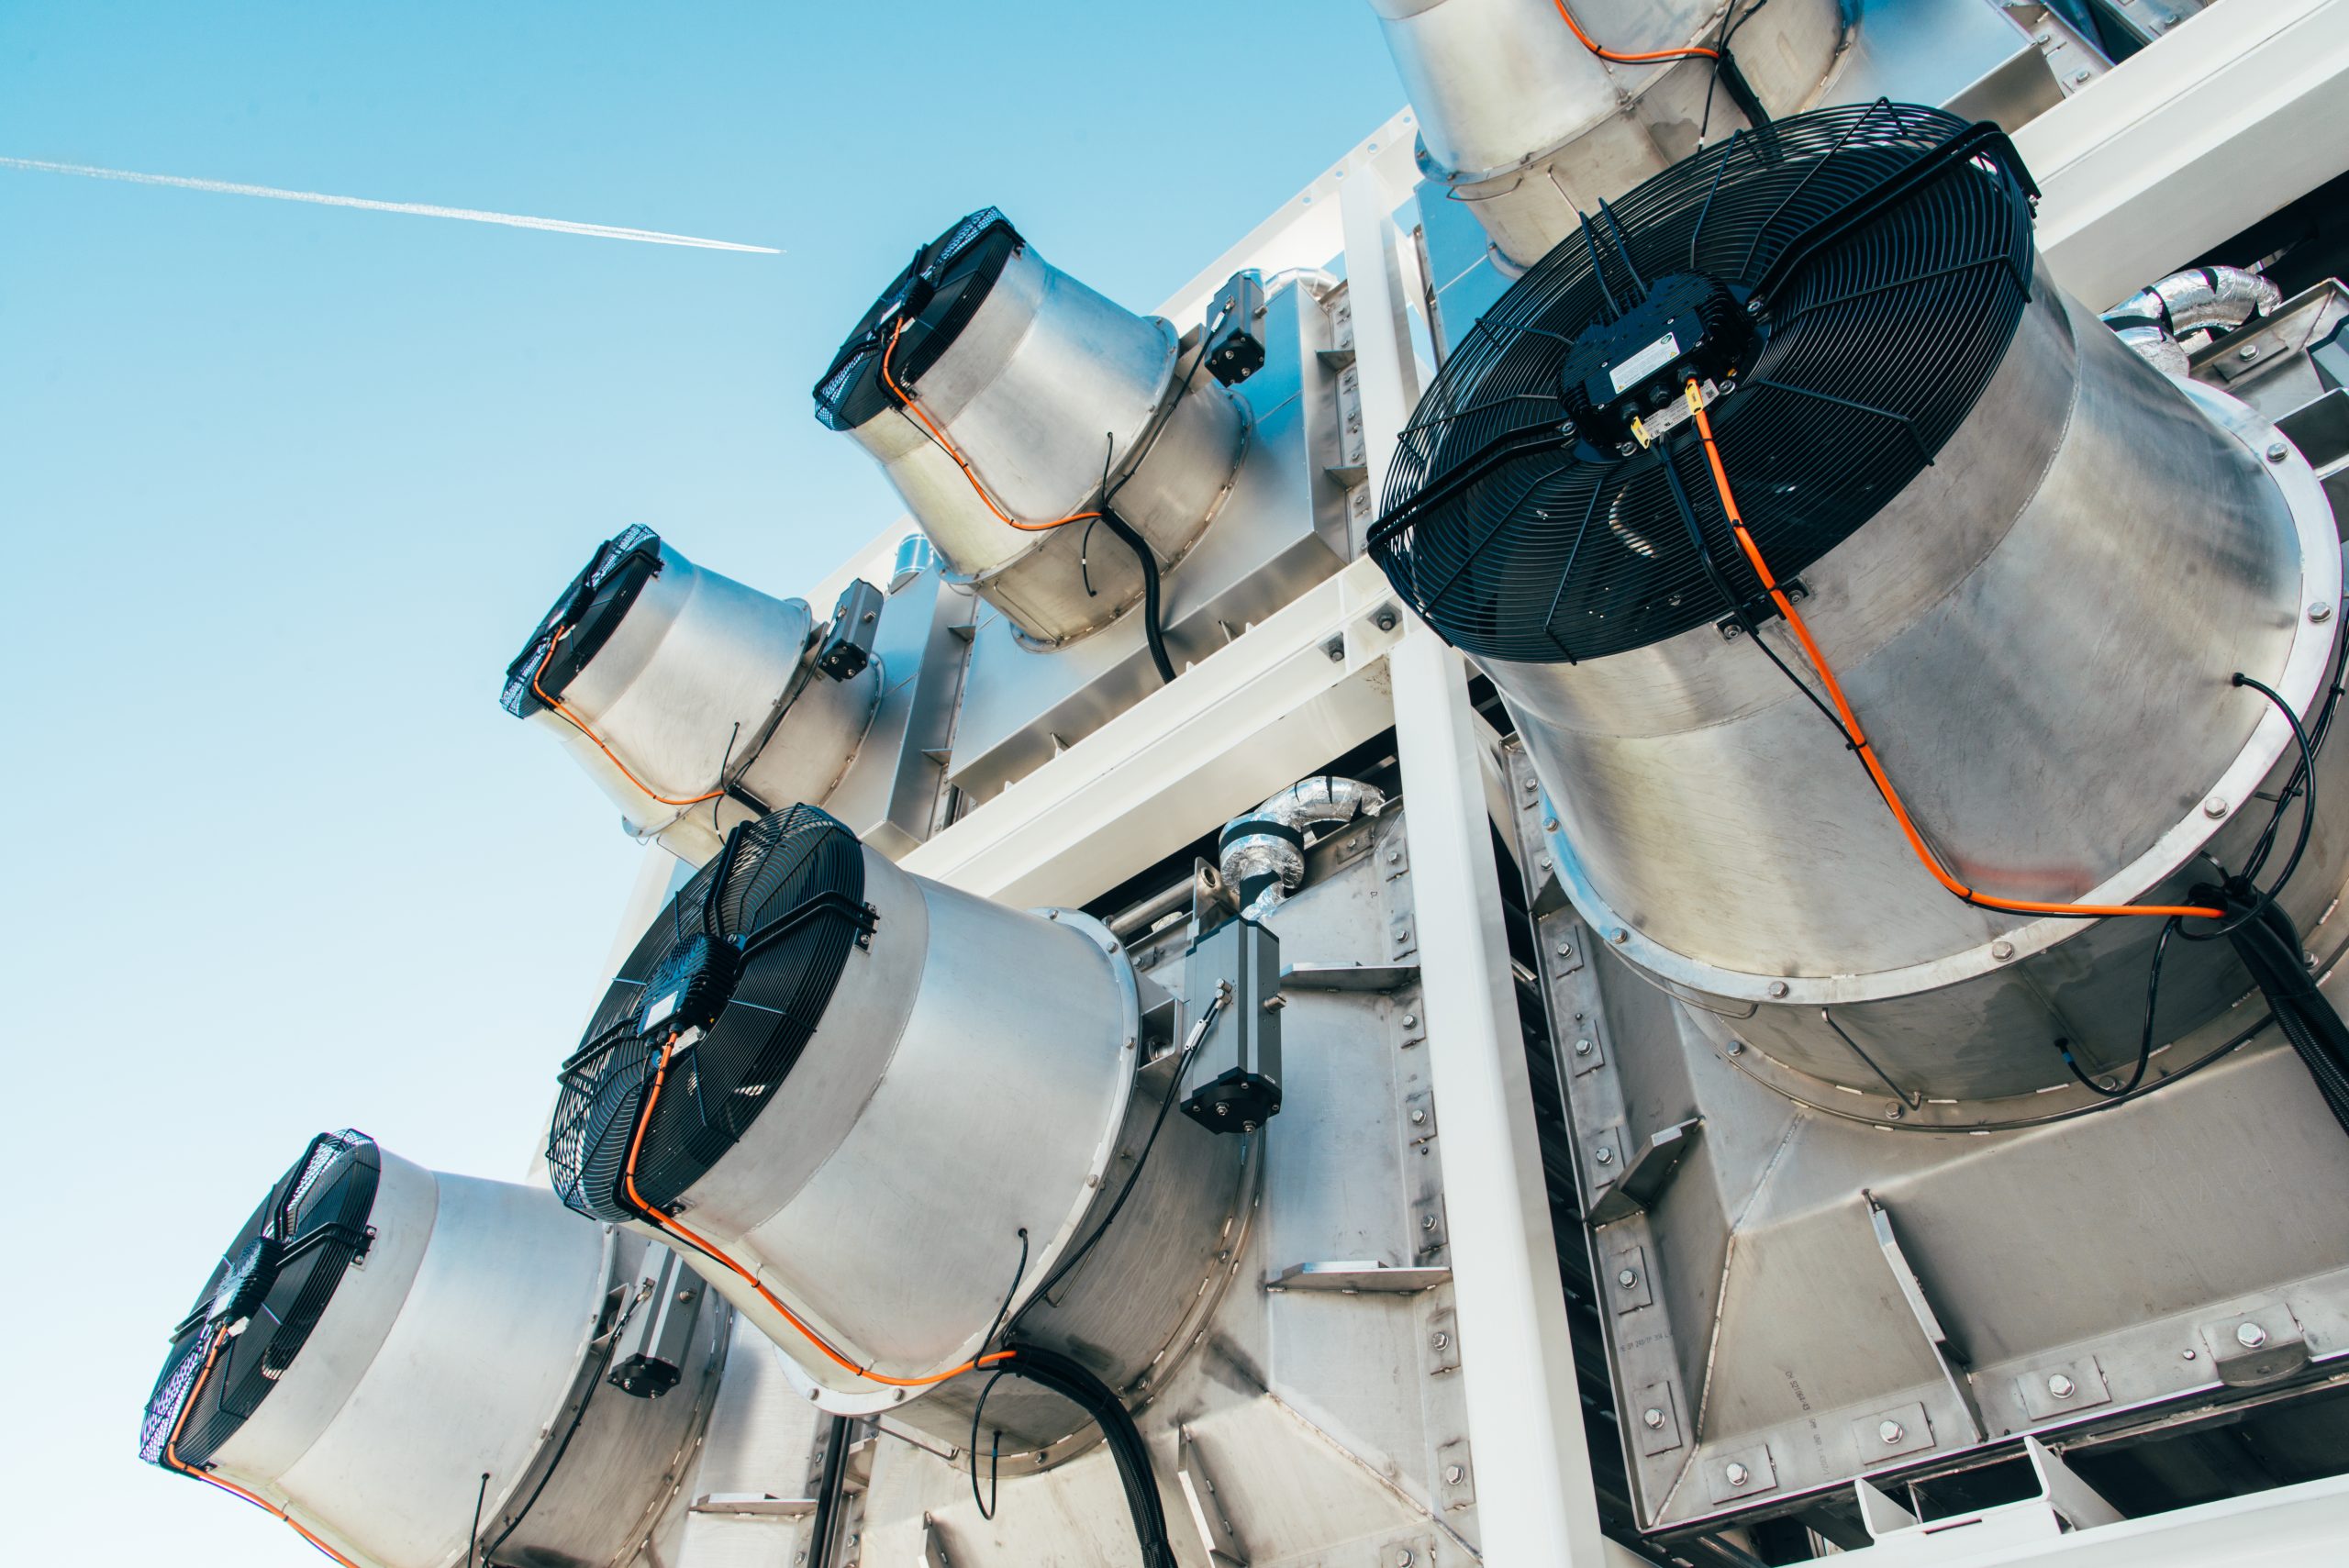
Climeworks, a Swiss company developing units that capture CO2 directly from the air, has begun working with Rotterdam The Hague Airport to develop a direct air capture (DAC) unit on the airport’s grounds.

Climeworks Plant technology [Source: Climeworks Photo by Julia Dunlop]

hydrogen filling station in the Hamburg harbor city

Hydrogen filling station in Hamburg, Germany.

However, beyond just capturing CO2 from planes taking off, Climeworks aims to use the CO2 to produce a synthetic jet fuel – creating a cycle of carbon reusage that ensures none is emitted into the atmosphere. A pilot project aims to create 1,000 litres of the fuel per day in 2021.

Another approach to zero-carbon transport fuel is the utilisation of hydrogen, which is already powering cars, trains, buses and even spacecraft.

Hydrogen can be produced in a number of ways, but it’s predominantly created from natural gas, through a process in which CO2 is a by-product. CCUS can play an important role here in capturing the CO2 and storing it, preventing it entering the atmosphere.

The hydrogen-powered vehicles then only emit water vapour and heat.

From every industry to every business to everyone

As CCUS technology continues to be deployed at scale and made increasingly affordable, it has the potential to go beyond just large industrial sites, to entire economic regions.

Global Thermostat is developing DAC technology which can be fitted to any factory or plant that produces heat in its processes. The system uses the waste heat to power a DAC unit, either from a particular source or from the surrounding atmosphere. Such technologies along with those already in action like bioenergy with carbon capture and storage (BECCS), can quickly make negative emissions a reality at scale.

However, to capture, transport and permanently store CO2 at the scale needed to reach net zero, collaboration partnerships and shared infrastructure between businesses in industrial regions is essential.

The UK’s Humber region is an example of an industrial cluster where a large number of high-carbon industrial sites sit in close proximity to one another. By installing BECCS and CCUS infrastructure that can be utilised by multiple industries, the UK can have a far greater impact on emissions levels than through individual, small-scale CCUS projects.

Decarbonising the UK and the world will not be achieved by individual sites and industries but by collective action that transcends sectors, regions and supply chains. Implementing CCUS at as large a scale as possible takes a greater stride towards bringing the wider economy and society to net zero.

Learn more about carbon capture, usage and storage in our series:

Morehouse catchment area analysis

Working forest in southern Arkansas within the Morehouse catchment area

The forest area around the Drax Morehouse BioEnergy plant has a long history of active management for timber production. 96% of the forest owners are private and around half of these are corporate investors seeking a financial return from forest management. The pulp and paper (p&p) sector dominates the market for low grade roundwood with over 75% of the total demand. The wood pellet markets use only 6% of the roundwood, of which 4% is used by Morehouse.

Given the small scale of demand in the pellet sector, the extent of influence is limited. However, the new pellet markets have had a positive impact, replacing some of the declining demand in the p&p sector and providing a market for thinnings for some forest owners and a new off-take for sawmill residues.

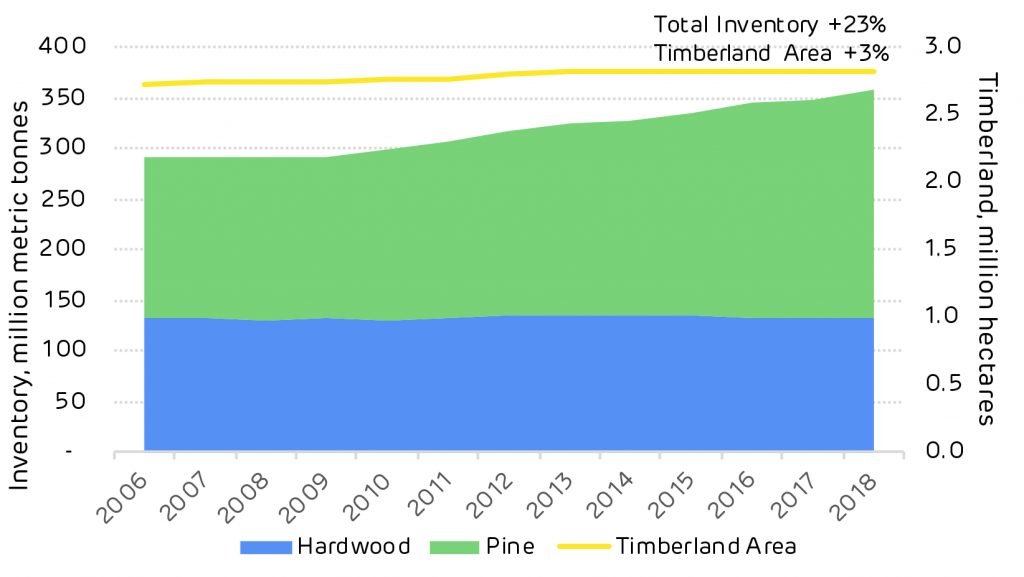
Pine forest is dominant in this area with an increasing inventory (growing stock) despite a stable forest area. Active management of pine forests has increased the amount of timber stored in the standing trees by 68 million tonnes from 2006 to 2018.  Over the same period the hardwood inventory remained static.

Chart showing historic inventory and timberland area in Morehouse catchment

Historic inventory and timberland area in Morehouse catchment; click to view/download.

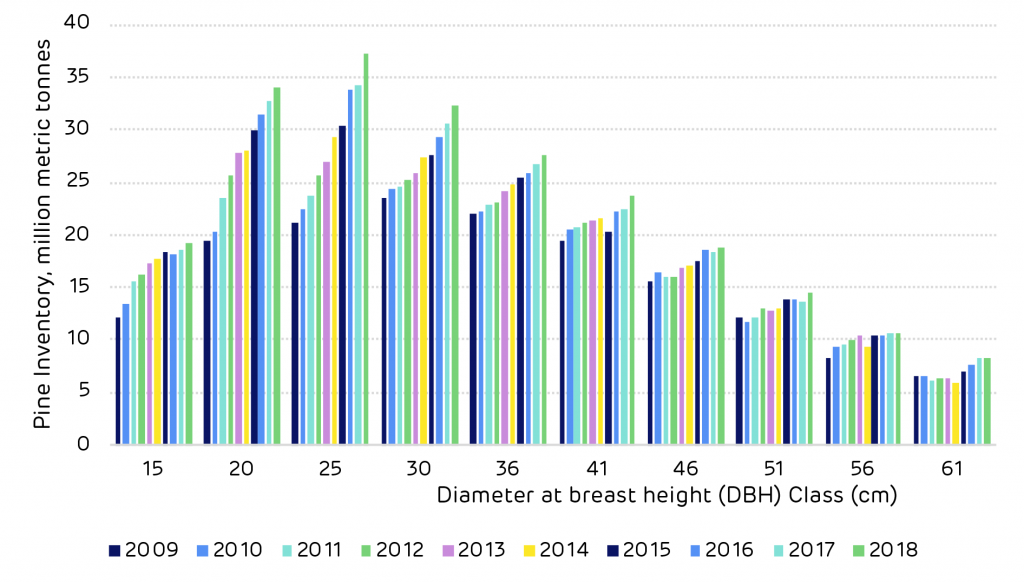
US Forest Service FIA data shows that the pine resource in this catchment area has been maturing, the volume of timber has been increasing in each size class year on year. This means that the volume available for harvesting is increasing and that more markets will be required to utilise this surplus volume and ensure that the long-term future of the forest area can be maintained.

Chart showing historic pine inventory by DBH Class

Historic pine inventory by DBH Class in Morehouse catchment; click to view/download.

This is reflected in the growth drain ratio – the comparison of annual growth versus harvesting. A ratio of one shows a forest area in balance, less than one shows that harvesting is greater than growth. This can be the case when the forest area is predominantly mature and at the age when clear cutting is necessary.

A growth drain ratio of more than one shows that growth exceeds harvesting, this is typically the case in younger forests that are not yet ready for harvesting and are in the peak growing phase, but it can also occur when insufficient market demand exists and owners are forced to retain stands for longer in the absence of a viable market.

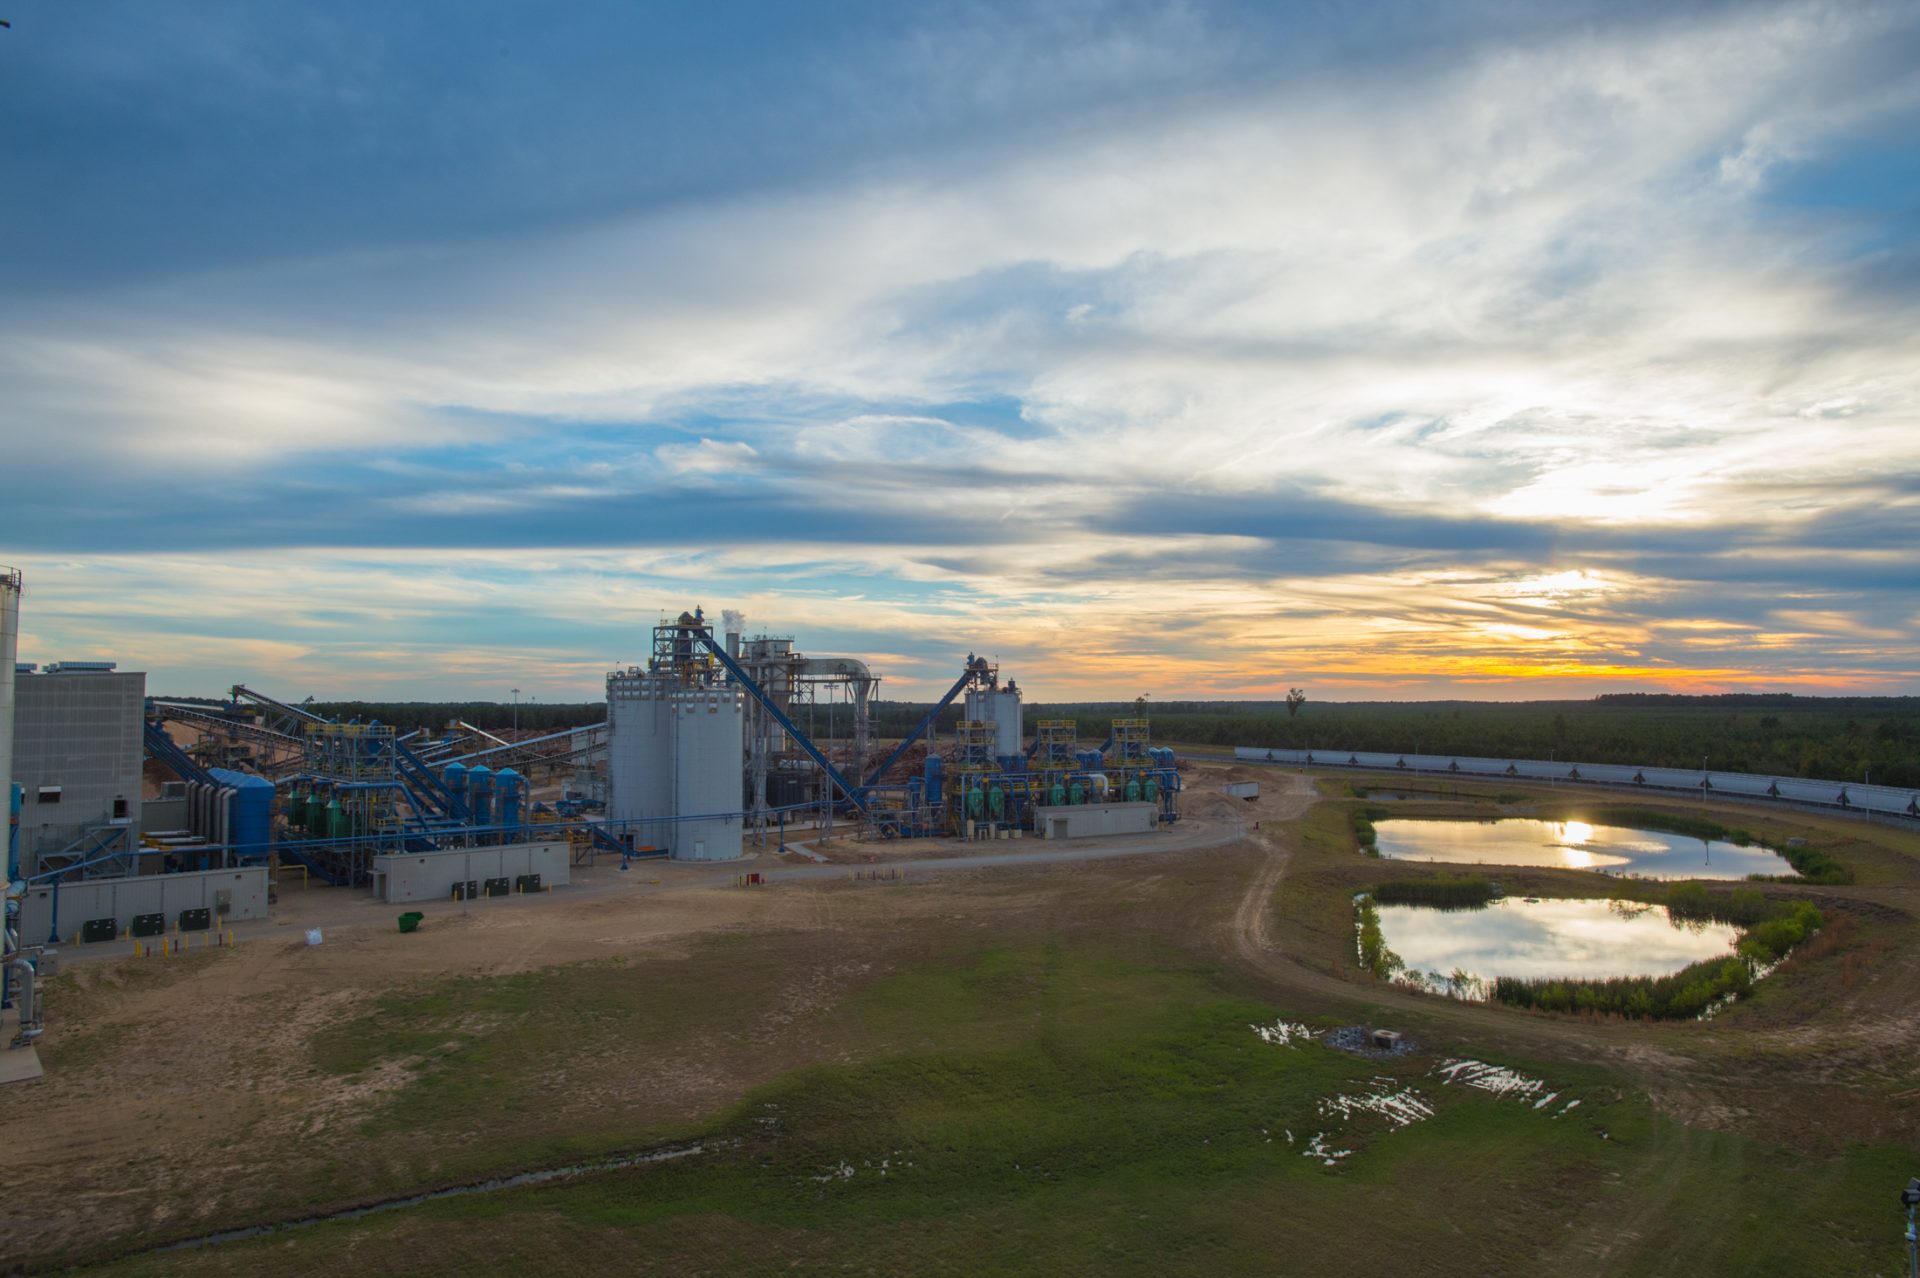
Drax Morehouse plant

Drax’s Morehouse BioEnergy compressed wood pellet plant in northern Louisiana

This can have a negative impact on the future growth of the forest; limiting the financial return to forest owners and reducing the cumulative sequestration of carbon by enforcing sub-optimal rotation lengths.

The current growth drain ratio of pine around Morehouse is 1.67 with an average annual surplus of around 7 million metric tonnes. This surplus of growth is partly due to a decline in saw-timber demand due to the global financial crisis but also due to the maturing age class of the forest resource and the increasing quantity of timber available for harvesting.

Historic growth and removals of pine in Morehouse catchment (million metric tonnes)

YearGrowthRemovalsNet GrowthGrowth-to-Drain
200914.112960762411.1860124622.92694830041.26166145535
201014.580331100610.91819493463.662136166021.33541589869
201115.129903273610.72162297824.408280295451.41115792865
201215.357258404710.30755904395.049699360811.48990254039
201315.63898206189.701617808065.93736425371.61199733603
201415.91041518229.376564771556.533850410651.69682773701
201515.94235364499.669133266476.273220378431.64878828387
201616.43527840789.579357241816.855921165961.71569740985
201716.838075354610.1594737396.678601615681.65737672908
201817.770968348910.65938820047.111580148561.66716588371

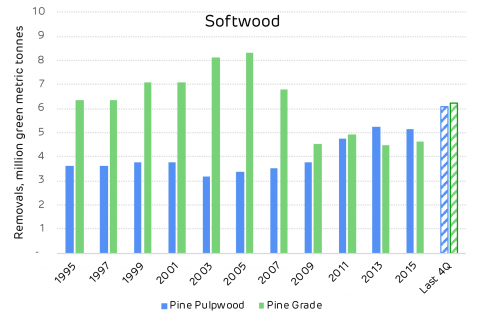
The chart below shows the decline in pine saw-timber demand in the catchment area following the financial crisis in 2008. It also shows the recent increase in pulpwood demand driven by the new pellet mill markets that have supplemented the declining p&p mills.

Sawmills are a vital component of the forest industry around Morehouse, with most private owners seeking to maximise revenue through saw-timber production from pine forests.

As detailed in the table below, there are 70 markets for higher value timber products around this catchment area. These mills also need an off-taker for their residues and the pellet mills can provide a valuable market for this material, increasing the viability of the saw-timber market.

Operating grade-using facilities near Morehouse timber market

TypeNumber of MillsCapacityCapacity UnitsHardwood Roundwood At Mill From MarketSoftwood Roundwood At Mill From Market
Consumption, million green metric tonnes
Lumber6810538.8235294M m³1.737194320550.88604623042613.06745552335.69986977638
Plywood/Veneer2904M m³000.9617438725360.506109617373
Total701.737194320550.88604623042614.02919939586.20597939376

Pulp and paper mills dominate the low grade roundwood market for both hardwood and softwood. The pellet mill market is small with just 3 mills and therefore does not influence forest management decisions or macro trends in the catchment area. However, demand for wood pellet feedstock exceeds 1.5 million tonnes p.a. and this can provide a valuable market for thinnings and sawmill residues. A healthy forest landscape requires a combination of diverse markets co-existing to utilise the full range of forest products.

Operating pulpwood-using facilities near Morehouse timber market

TypeNumber of MillsCapacityCapacity UnitsHardwood Roundwood At Mill From MarketSoftwood Roundwood At Mill From Market
Consumption, million green metric tons
Pulp/Paper117634.86896M metric tons3.489826926741.192570970097.557287050371.66598821268
OSB/Panel62412.55M m³002.567325398621.19890681942
Chips178395.08999M metric tons2.938909722111.46484421365.287607151192.18745126814
Pellets31573.965975M metric tons002.078219858451.01128896402
Total346.428736648862.6574151836917.49043945866.06363526426

In its analysis, Forisk Consulting considered the impact that the new pellet mills including Morehouse BioEnergy have had on the significant trends in the local forest industry. The tables below summarise the Forisk view on the key issues. In its opinion, the Morehouse plant has had no negative impact.

Bioenergy impacts on markets and forest supplies in the Morehouse market

ActivityIs there evidence that bioenergy demand has caused the following?Explanation
DeforestationNo
Change in forest management practiceNo
Diversion from other marketsPossiblyBioenergy plants compete with pulp/paper and OSB mills for pulpwood and residual feedstocks. There is no evidence that these facilities reduced production as a result of bioenergy markets, however.
Increase in wood priceNoThere is no evidence that bioenergy demand increased stumpage prices in the market.
Reduction in growing stocking timberNo
Reduction in sequestration of carbon / growth rateNo
Increasing harvesting above the sustainable yieldNo

Bioenergy impacts on forests markets in the Morehouse market

Forest metric Bioenergy impact
Growing Stock Neutral
Growth Rates Neutral
Forest Area Neutral
Wood Prices Neutral
Markets for Solid Wood Neutral to Positive*
*Access to viable residual markets benefits users of solid wood (i.e. lumber producers).

Read the full report: Morehouse, Louisiana Catchment Area Analysis. An interview with the co-author, Amanda Hamsley Lang, COO and partner at Forisk Consulting, can be read here. Explore every delivery of wood to Morehouse BioEnergy using our ForestScope data transparency tool.

This is part of a series of catchment area analyses around the forest biomass pellet plants supplying Drax Power Station with renewable fuel. Others in the series include: ,

Others in the series include: Georgia MillEstonia, Latvia, Chesapeake and Drax’s own, other three mills LaSalle BionergyMorehouse Bioenergy and Amite Bioenergy.

Letter from Will Gardiner to the Independent Advisory Board on Sustainable Biomass

Dear John, 

Thank you for your letter of the 9 January, detailing the findings and recommendations from the first meeting of the Independent Advisory Board on Sustainable Biomass.

I want to begin by reiterating how important the work of the IAB is to Drax’s purpose and ambition. As you know, we recently announced our intention to become the world’s first carbon negative company by 2030 by scaling up our pioneering biomass with CCS (BECCS) pilot project. This ambition will only be realised if the biomass we use makes a positive contribution to our climate, the environment and the communities in which we operate. To that end, both you and the IAB will play a vital role by guiding us on our sourcing choices and challenging us to be as sustainable and transparent as we can be.

I enjoyed meeting with the IAB and hearing your conclusions from the first meeting. I am also pleased to hear from my team that the longer discussions were useful and constructive. Please pass on my thanks to all the members of the IAB for their time and consideration.

In particular, I am grateful for their consideration of our new sustainable biomass sourcing policy and the insight and recommendations that were given. I am pleased to hear that you agree our policy is an accurate representation of the criteria laid down in the Forest Research report.

I agree that a key topic for us to explore is how science can be further developed with regards the use of small, early thinnings and small roundwood. I also agree that understanding the counter factuals in the usage of wood that has come to us is important. This is an area we have, and continue to, explore, and I would refer the IAB to a report we have published subsequent to the meeting, “Catchment Area Analysis of Forest Management and Market Trends (2019)”– which contains an independent analysis of the impact of our sourcing at our Amite pellet mill in Mississippi. The team look forward to discussing this with you at a future meeting and receiving your input to shape the next phases of this work.

I also agree the need to continuously improve our sustainability policy and seek to update it as new findings come to light, as well as ensure that the current policy is embedded into our operations. For that reason, our policy will be kept under regular review to accommodate changes in science and new evidence as it emerges. We have also committed to advancing scientific research in the areas applicable to our operations through partnerships with academic institutions and direct support for academic research.

With regards your suggestion of a restatement of the academic evidence on biomass sustainability, we shall give this interesting approach due consideration. I do believe that better alignment through a shared understanding of the evidence among the academic community, environmental groups, policy makers and industry would be a welcome development and would be grateful to the IAB for its further consideration of how this might be achieved.

I will also raise your considerations regarding the Sustainable Biomass Program (SPB) in my position a member of the SPB Board. You are correct that our new policy goes beyond SBP, and so an important work programme for us is how we demonstrate we are meeting the new policy.

Lastly, I welcome the addition of two interim telephone calls which will help to keep momentum between the half yearly meetings and will support us as we develop our policy, research and implementation projects further. Thank you for this commitment.

As the work of the IAB progresses, I look forward to hearing how you believe Drax can best build the evidence required to demonstrate that we are sourcing according to the best available science. As the world’s largest biomass consumer it is important that we lead by example. This means not only having a world leading biomass sustainability policy in place, but also the data and evidence available to give all our stakeholders the confidence that we are fulfilling our purpose of enabling a zero carbon, lower cost energy future.

Thank you once again for your participation and expertise.

Yours,


Will Gardiner

Group CEO

View/download the PDF version here

How a Mississippi wood pellet mill supports healthy forests and rural economies

Pine saplings in Weyerhaeuser tree nursery, Hazlehurst, Mississippi

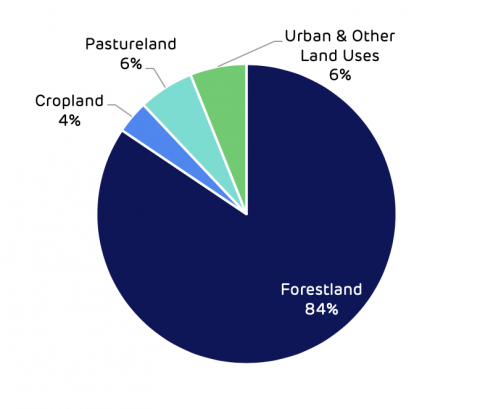
The landscape of the Amite catchment area in Mississippi is dense with forests. They cover 84% of the area and play a crucial role in the local economy and the lives of the local population.

Amite BioEnergy catchment area – land area distribution by land classification & use (2017)

Amite BioEnergy catchment area – land area distribution by land classification & use (2017)

On the state’s western border with Louisiana, near the town of Gloster, Drax’s Amite BioEnergy pellet mill is an important part of this local economy, providing employment and creating a market for low-grade wood.

Amite produces half-a-million metric tonnes of wood pellets annually that not only benefit the surrounding area, but also make a positive impact in the UK, providing a renewable, flexible low carbon source of power that could soon enable carbon negative electricity generation.

However, this is only possible if the pellets are sourced from healthy and responsibly managed forests. That’s why it’s essential for Drax to regularly examine the environmental impact of the pellet mills and their catchment areas to, ultimately, ensure the wood is sustainably sourced and never contributes to deforestation or other negative climate and environment impacts.

In the first of a series of reports evaluating the areas Drax sources wood from, Hood Consulting has looked at the impact of Amite on its surrounding region. The scope of the analysis had to be objective and impartial, using only credible data sources and references. The specific aim was to evaluate the trends occurring in the forestry sector and to determine what impact the pellet mill may have had in influencing those trends, positively or negatively. This included the impact of harvesting levels, carbon stock and sequestration rate, wood prices and the production of all wood products.

The report highlights the positive role that the Amite plant has had in the region, supporting the health of western Mississippi’s forests and its economy.

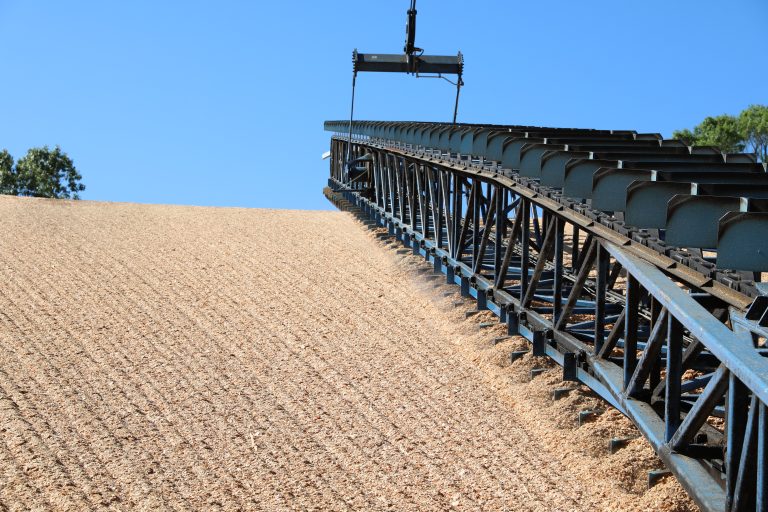
Woodchip pile at Amite BioEnergy (2017)

Woodchip pile at Amite BioEnergy (2017)

The landscape of the Amite BioEnergy wood pellet plant 

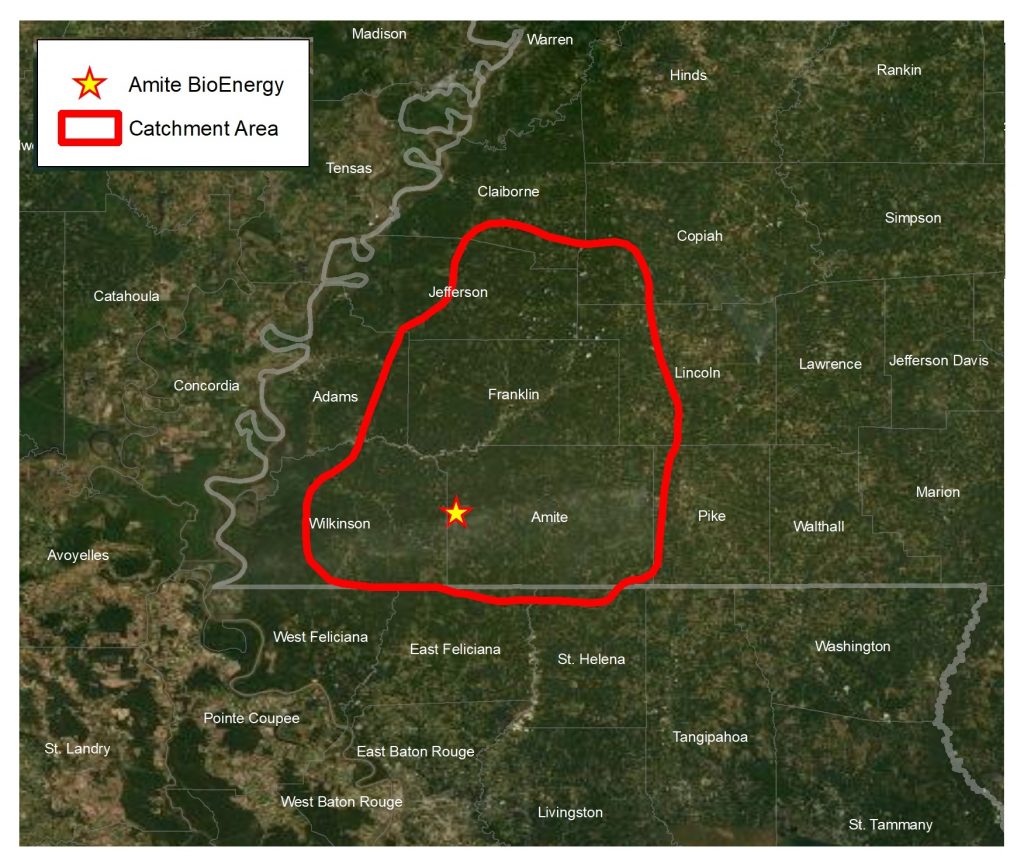
Amite BioEnergy’s catchment area – the working forest land from which it has sourced wood fibre since it began operating – stretches roughly 6,600 square kilometres (km2) across 11 counties – nine in Mississippi and two in Louisiana.

Map showing Amite BioEnergy catchment area boundary

Amite BioEnergy catchment area boundary

US Forest Service data shows that since 2014, when Amite began production, total timberland in this catchment area has in fact increased by more than 5,200 hectares (52 million m2).

An increase in market demand for wood products, particularly for sawtimber, can be one of the key drivers for encouraging forest owners to plant more trees, retain their existing forest or more actively manage their forests to increase production.

Markets for low grade wood, like the Amite facility, are essential for enabling forest owners to thin their crops and generate increased revenue as a by-product of producing more saw-timber.

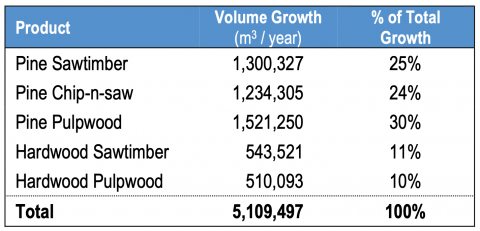
Around 30% of the annual timber growth in the region is pine pulpwood, a lower-value wood which is the primary source of raw material used at Amite. More than 60% of the growth is what is known as sawtimber – high-value wood used as construction lumber or furniture, or chip n saw (also used for construction and furniture).

Amite BioEnergy catchment area – net growth of growing stock timber by major timber product. Source: USDA – US Forest Service.

Amite BioEnergy catchment area – net growth of growing stock timber by major timber product. Source: USDA – US Forest Service.

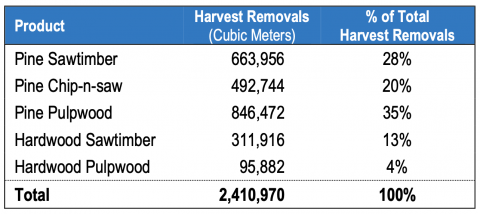
The analysis shows that harvesting levels in each product category are substantially lower than the annual growth (as shown in the table below). This means that every year a surplus of growth remains in the forest as stored carbon.

Amite BioEnergy catchment area – harvest removals by major timber product (2017). Source: USDA – US Forest Service.

Amite BioEnergy catchment area – harvest removals by major timber product (2017). Source: USDA – US Forest Service.

In 2017, total timber growth was 5.11 million m3 while removals totalled 2.41 million m3 – less than half of annual growth. Of that figure, the pine pulpwood used to make biomass pellets grew by 1.52 million m3 while just 850 thousand m3  was removed.

The table below shows the ratio of removals to growth in the pine forests around Amite. A ratio of 1 is commonly considered to be the threshold for sustainable harvesting levels, in this catchment area the ratio is more than double that amount, meaning that there is still a substantial surplus of annual growth that has not been harvested.

Amite BioEnergy catchment area – annual growth, removals & growth-to-removal ratios by major timber product (2017). Source: USDA – US Forest Service.

Amite BioEnergy catchment area – annual growth, removals & growth-to-removal ratios by major timber product (2017). Source: USDA – US Forest Service.

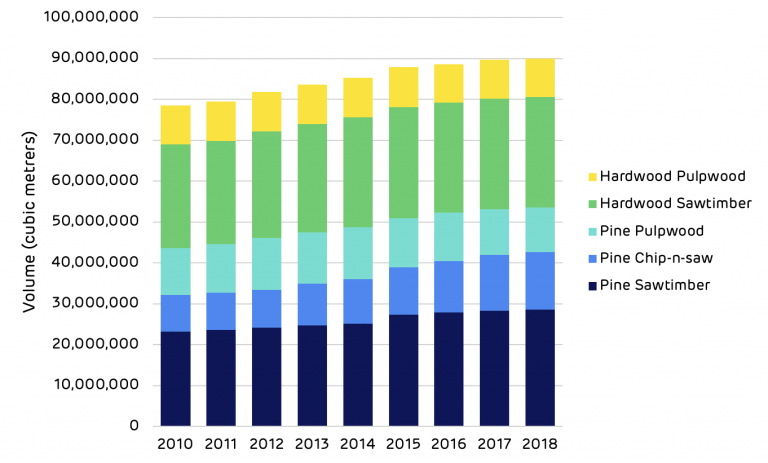
Between 2010 and 2017 the total stock of wood fibre (or carbon) growing in the forests around Amite increased by more than 11 million m3. This is despite a substantial increase in harvesting demand for pulpwood.

Timber inventory by major timber product (2010-2017); projected values (2018)

Timber inventory by major timber product (2010-2017); projected values (2018)

The economic argument for sustainability

The timberland of the Amite BioEnergy catchment area is 85% privately owned. Among the tens of thousands of smaller private landowners are larger landowners like forestry business Weyerhaeuser; companies that manage forest land on behalf of investors like pension funds; and private families. For these private owners, as long as there are healthy markets for forest products forests have an economic value. Without these markets some owners may choose to convert their forest to other land uses (e.g. for urban development or agriculture).

More than a billion tree saplings have been grown at Weyerhaeuser’s Pearl River Nursery in Mississippi. The facility supplies these young trees to be planted in the Amite catchment area and across the US South.

Strong markets lead to increased investment in better management (e.g. improved seedlings, more weeding or fertilisation, thinning and selecting the best trees for future saw-timber production).

“Thinning pulpwood is part of the forest management process,” explains Dr Harrison Hood, Forest Economist and Principal at Hood Consulting. “Typically, with pine you plant 500 to 700 trees per acre. That density helps the trees grow straight up rather than outwards.”

But once the trees begin to grow beyond a certain point, they can crowd one another, and some trees will be starved of water, nutrients and sunlight. It is therefore essential to fell some trees to allow the others to grow to full maturity – a process known as thinning.

“At final harvest, you’ve got about 100 trees per acre,” continues Dr Hood. “You remove the pulpwood or the poor-quality trees to allow the higher-quality trees to continue to grow.”

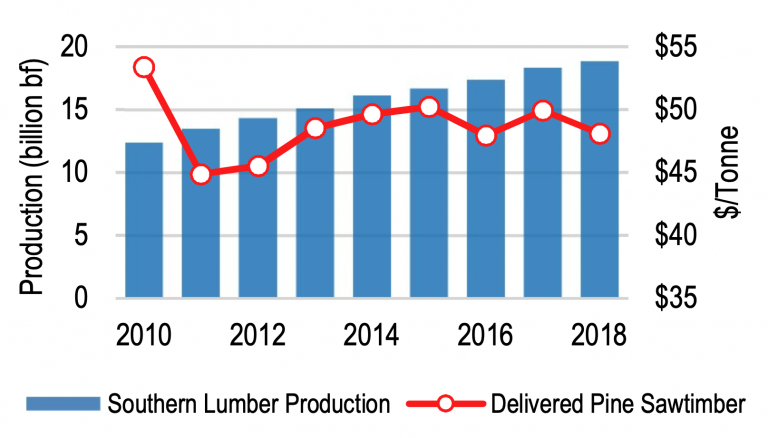
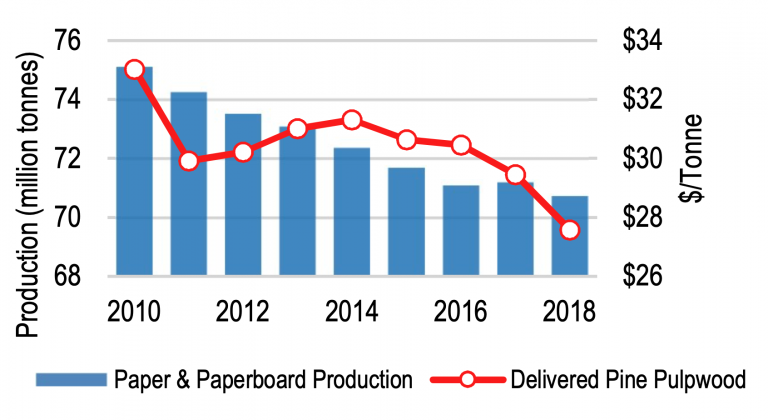
These thinnings have typically been used as pulpwood to make things like paper, but with the slight decline of this industry over the last few decades there’s been a need to find new markets for it. Paper production in the Amite catchment area has declined since 2010 (as shown on the chart on the right), whilst demand for saw-timber (lumber) has been increasing following the economic recovery after the recession of 2008.

Producing saw-timber, without a market for thinnings and low-grade wood is a challenge. The arrival of a biomass market in the area has created a renewed demand – something that is even more important at the current time, when there is an abundance of forest, but wood prices are flat or declining slightly.

“Saw-timber prices haven’t moved much over the last six to eight years,” explains Dr Hood. “They’ve been flat because there’s so much wood out there that there’s not enough demand to eat away at the supply.”

Pulpwood consumers such as Amite BioEnergy create demand for pulpwood from thinning, allowing landowners to continue managing their forests while waiting for the higher value markets to recover. Revenue from pulpwood helps to support forest owners, particularly when saw-timber prices are weak.

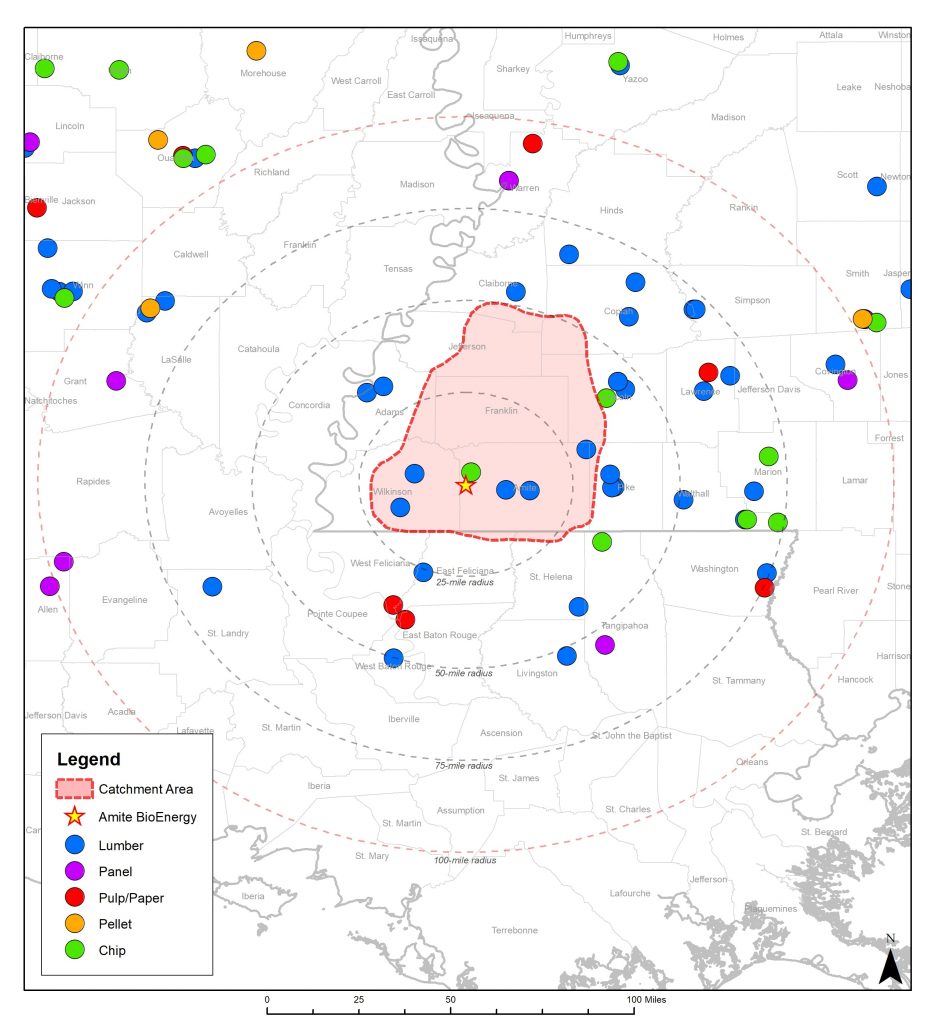
Amite BioEnergy catchment area mill map (2019)

Amite BioEnergy catchment area mill map (2019)

“There’s so much pulpwood out there,” says Dr Hood. “You need a buyer for pulpwood to allow forests to grow and mature into a higher product class and to keep growing healthy forests.”

The picture of the overall forest in the catchment area is of healthy growth and, crucially, a sustainable environment from which Drax can responsibly source biomass pellets for the foreseeable future.

Read the full report: Catchment Area Analysis of Forest Management and Market Trends: Amite BioEnergy (UK metric version). A short summary of its analysis and conclusions, written by our forestry team, can be read hereThis is part of a series of catchment area analyses around the forest biomass pellet plants supplying Drax Power Station with renewable fuel. Others in the series include: Morehouse BioEnergy.

Amite Bioenergy catchment area analysis

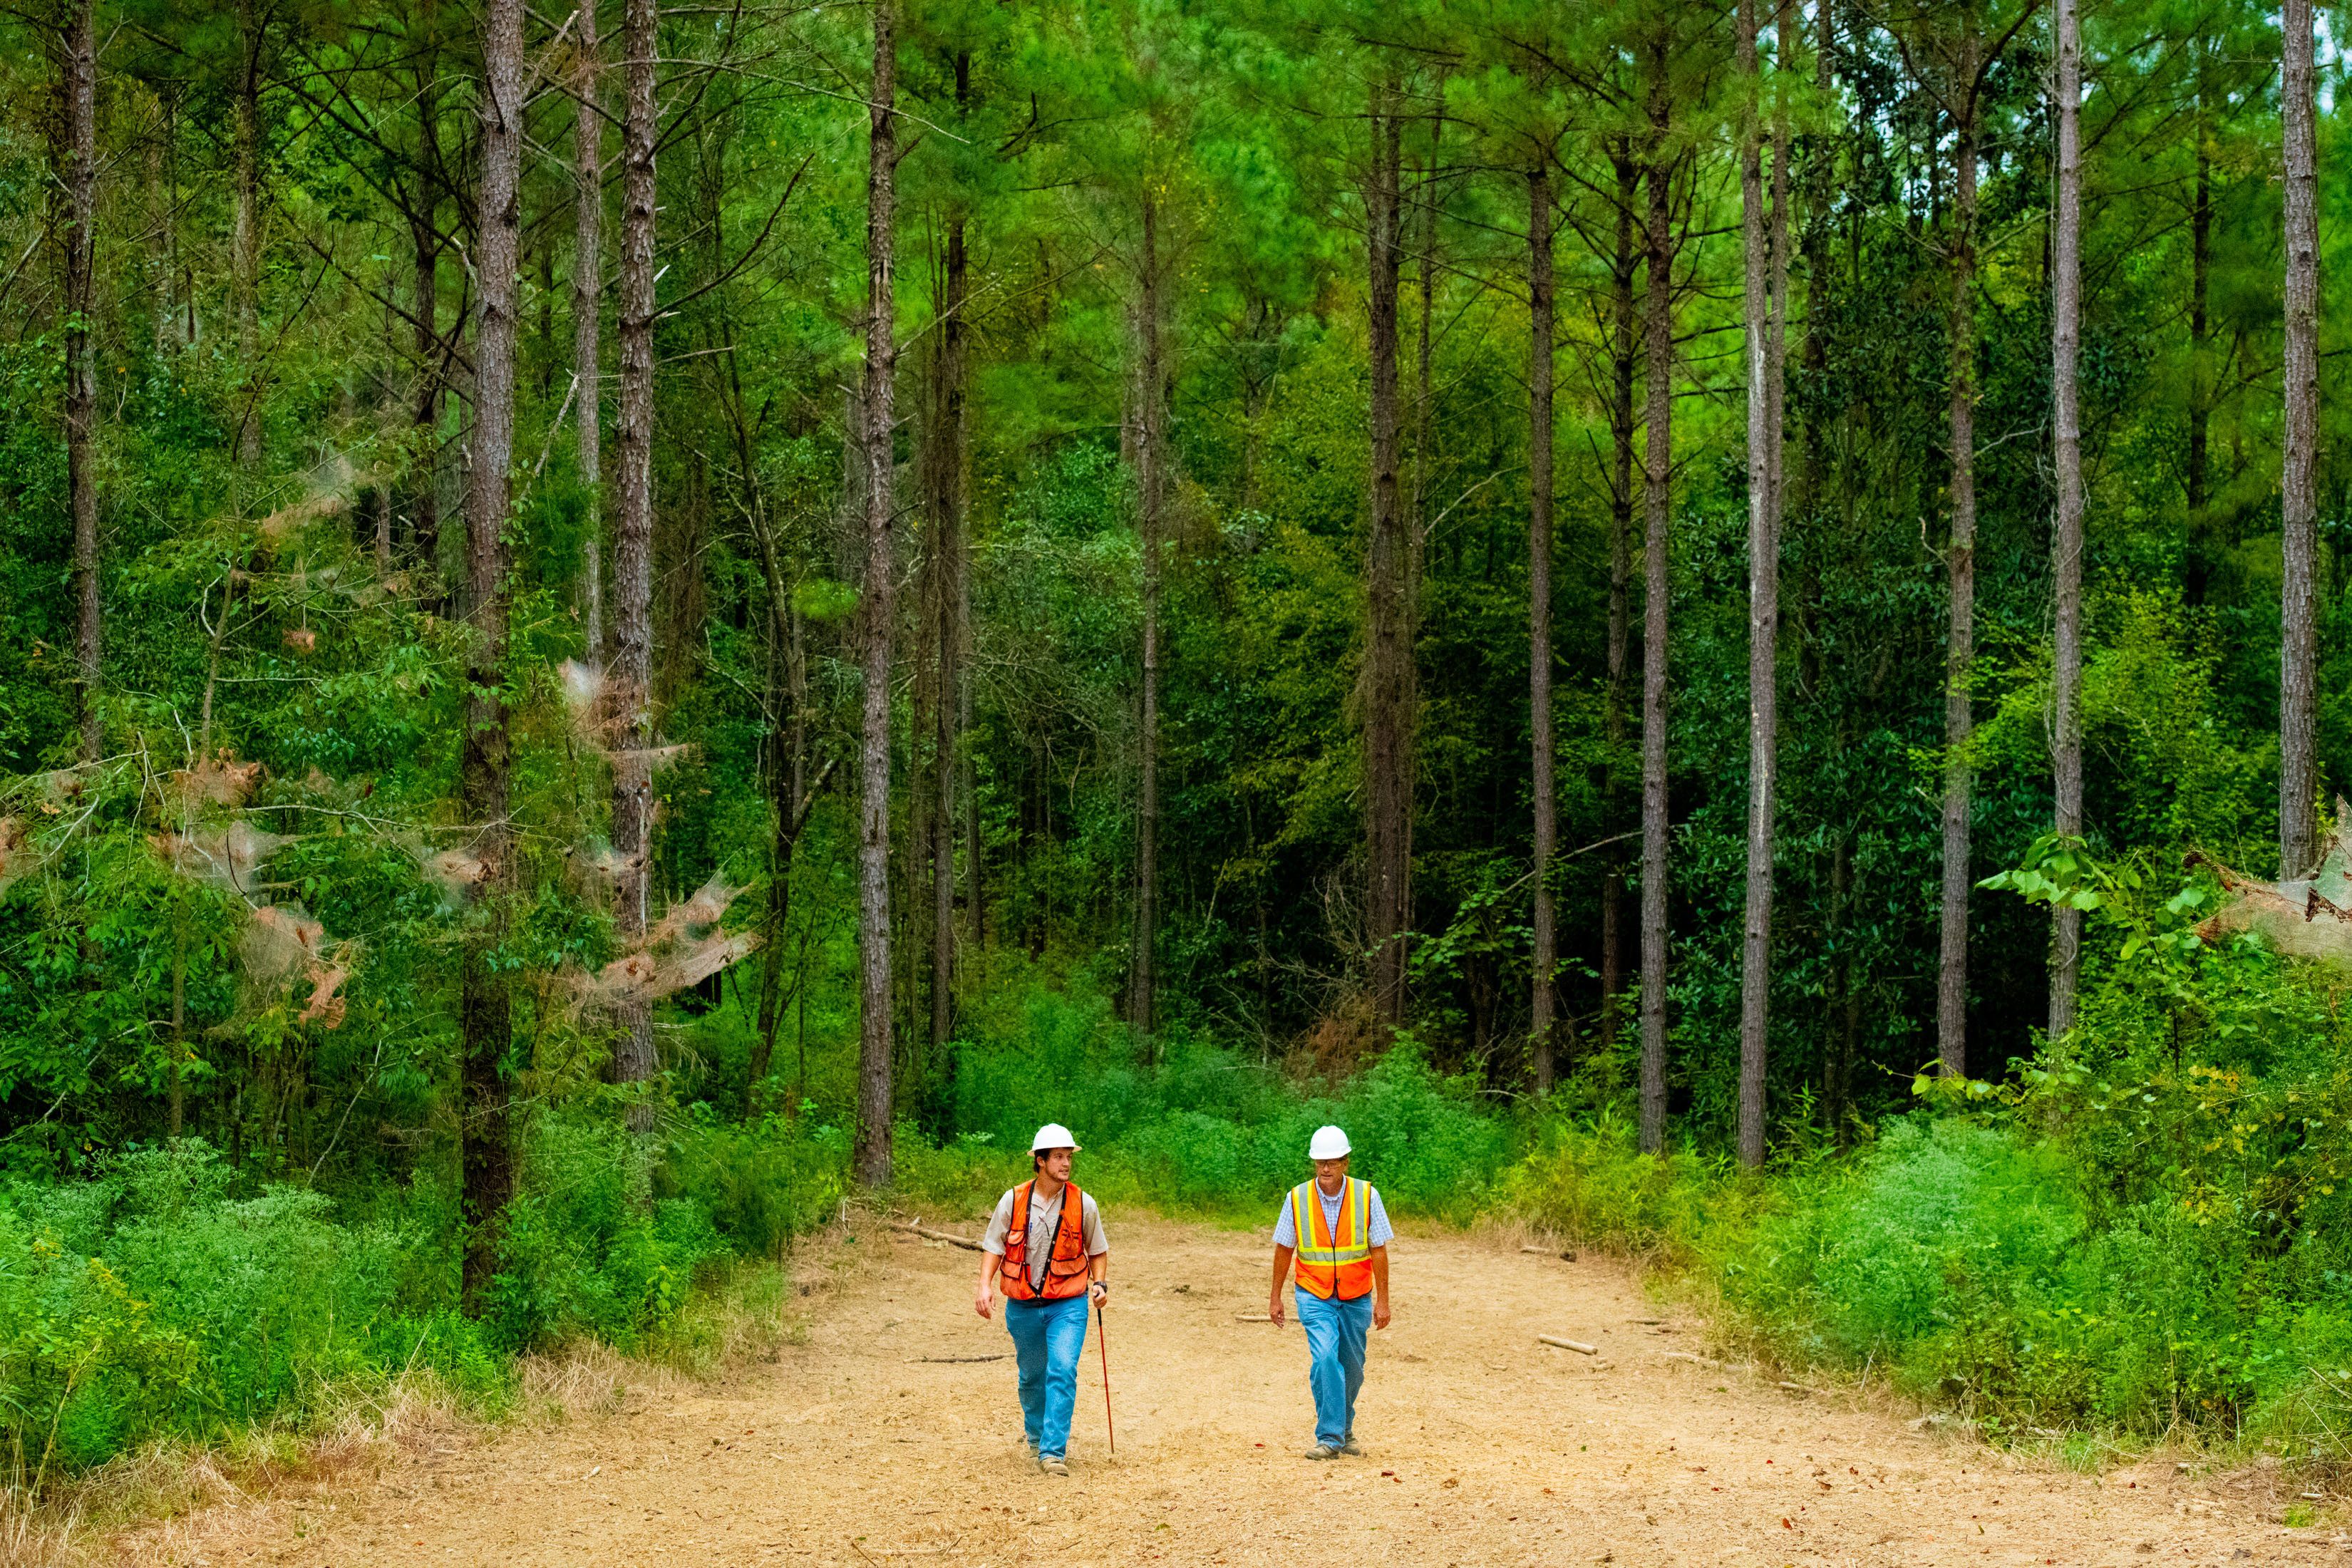
Foresters in working forest, Mississippi

The first of our planned Catchment Area Analysis reports is complete, looking at Amite BioEnergy, our compressed wood pellet manufacturing plant in Mississippi.

The aim of this analysis is to evaluate the trends occurring in the forestry sector around the plant and to determine what impact the pellet mill may have had in influencing those trends, positively or negatively. This includes the impact of increased harvesting levels, changes in carbon stock and sequestration rate, wood prices and the production of all wood products.

Analysis shows a maturing forest resource with a substantial surplus of annual growth; increasing in age and growing stock; increasing production of sawtimber and higher value wood products; stable wood prices and no market displacement.

Key report data

Since 2010 the total growing stock (the amount of wood stored in the forest) around Amite BioEnergy has increased by 11.1 million cubic metres (m3). This is partly due to an increase in the area of Timberland (which increased by more than 5,200 hectares (ha)), but predominantly due to the forest ageing and increasing the average size class (the average tree gets bigger, moving from a small diameter pulpwood tree to a larger sawtimber grade tree).

The chart below shows that the increase in volume is entirely within the private sector, where forests are more actively managed. The public sector has declined in growing stock by 1.5 million m3 whilst the private sector has increased by 12.6 million m3. The continual cycle of thinning, harvesting and replanting in the private forests, helps to keep the growing stock increasing.
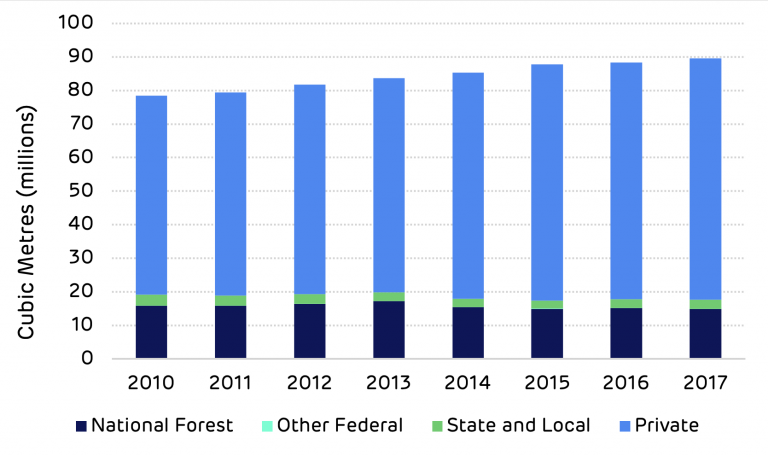
Total growing stock volume on timberland, in cubic meters, by ownership group. Source: US Forest Service – FIA

Total growing stock volume on timberland, in cubic meters, by ownership group. Source: US Forest Service – FIA

Harvesting in the catchment area has increased, due to the increased demand from the pellet mill, but this is still substantially lower than average annual growth. The average annual surplus of growth compared to harvesting between 2010 and 2017 has been 3.5 million m3 p.a. with a surplus of 2.7 million m3 in 2017.
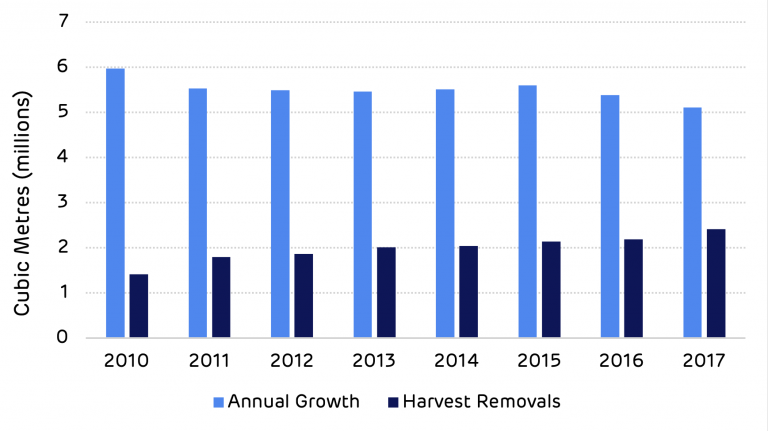
Average annual growth and harvest removals of total growing stock timber, in cubic meters, on timberland – Amite Catchment Area. Source: US Forest Service – FIA
Average annual growth and harvest removals of total growing stock timber, in cubic meters, on timberland – Amite Catchment Area. Source: US Forest Service – FIA

Average annual growth and harvest removals of total growing stock timber, in cubic meters, on timberland – Amite Catchment Area. Source: US Forest Service – FIA

Amite BioEnergy, Mississippi (2017)

The Catchment Area Analysis also looks at stumpage prices, the revenue paid to forest owners at the time of harvesting, to see if the demand from the pellet mill is having a negative impact (increasing competition and prices for other markets).

The chart below shows that prices are now lower than when the pellet mill began operating. While this may be good for all markets in the area, it is not good for the forest owner.

When considering if trends are good or bad, we must also consider from which perspective we are making the assessment. Increasing prices can be a positive, encouraging owners to plant more trees or to invest more in the management of their forest. Providing that increasing prices do not result in a loss of production in existing markets.
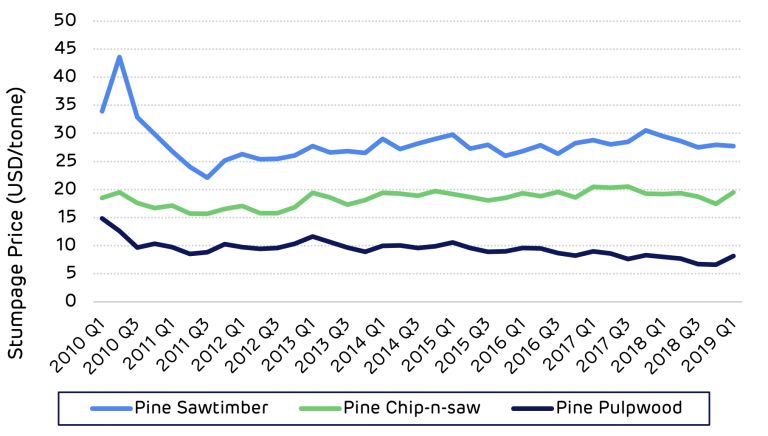
Amite Bioenergy Catchment Area - average stumpage prices ($/metric tonne). Source: Timber Mart-South

Amite Bioenergy Catchment Area – average stumpage prices ($/metric tonne). Source: Timber Mart-South

An important part of this analysis is to look for evidence to evaluate Drax’s performance against its new forest commitments, some of which relate directly to these trends and data sets.

Hood Consulting – the authors of Catchment Area Analysis of Forest Management and Market Trends: Amite BioEnergy – has looked at the impact of Amite BioEnergy on its supply basin.

The scope of the analysis had to be objective and impartial, using only credible data sources and references. However, in order to address some of the key issues and draw some conclusions, the consultants used their extensive experience and local knowledge in addition to the data trends.

A summary of their findings is detailed below.

Summary of key questions addressed in the analysis:

Is there any evidence that bioenergy demand has caused …?

Deforestation?

No. US Forest Service data shows that the total timberland area has increased by more than 5,200 ha.

A change in management practices (rotation lengths, thinnings, conversion from hardwood to pine)?

No / inconclusive. Changes in management practices have occurred in the catchment area over the last five to 10 years, but there is little evidence to suggest bioenergy demand has caused these changes. Market research shows thinnings have declined in this catchment area since 2014 (when Amite BioEnergy commenced production). However, local loggers identify poor market conditions for the decrease in thinnings, not increased bioenergy demand.

The primary focus of timber management in this area is the production of sawtimber. Rotation lengths of managed forests have remained unchanged (between 25-35 years of age) despite increases in bioenergy demand. Increased bioenergy demand, however, has benefited landowners in this catchment area, providing additional outlets for pulpwood removed from thinnings – a management activity necessary for sawtimber production.

Diversion from other markets?

No. Since 2014, softwood pulpwood demand not attributed to bioEnergy has increased 8% while demand for softwood sawtimber and hardwood pulpwood has increased 53% and 5%, respectively.
An abnormal increase in wood prices?

No. Prices for delivered pine pulpwood (the primary raw material consumed by Amite BioEnergy) have decreased 12% since the pellet mill commenced production in 2014.

A reduction in growing stock timber?

No / inconclusive. Total growing stock inventory in the catchment area increased 5% from 2014 through 2017 (the latest available data). Specifically, pine sawtimber inventory increased 13%, pine chip-n-saw inventory increased 24%, and pine pulpwood inventory decreased 12% over this period. This is indicative of an aging forest.

A reduction in the sequestration rate of carbon?

No. US Forest Service data shows the average annual growth rate of growing stock timber has decreased slightly since 2014, and a slower timber growth rate essentially represents a reduction in the sequestration rate of carbon. However, the reduced growth rate and subsequent reduction in the sequestration rate of carbon is due to the aging of the forest (changes in timber age class distribution), not to increases in bioenergy demand. As trees get older the growth rate slows down.

An increase in harvesting above the sustainable yield capacity of the forest area?

No. Growth-to-removals ratios, which compare annual timber growth to annual harvests, provides a measure of market demand relative to supply as well as a gauge of market sustainability. In 2017, the latest available, the growth-to-removals ratio for pine pulpwood equalled 1.80 (a value greater than 1.0 indicates sustainable harvest levels). Even with the increased harvesting required to satisfy bioenergy demand, harvest levels remain well below the sustainable yield capacity of the catchment forest area.

Evaluate the impact of bioenergy demand (positive, neutral, negative) on …

Timber growing stock inventory

Neutral. Total wood demand (from biomass and other solid wood products) is up more than 35% compared to 2014 levels. Intuitively, increased demand means more timber is harvested, which reduces total growing stock inventory. However, in this catchment area, inventories are so substantial

that increases in demand from bioenergy, as well as from other sources, have not been great enough to offset annual timber growth, and, as such, total growing stock inventory has continued to increase – an average of 2% per year since 2014 (when Amite BioEnergy commenced production).

Timber growth rates

Neutral. Timber growth rates have declined since 2014; however, evidence suggests the reduction in growth rates is more a product of an aging forest and not due to changes in bioenergy demand.

Additionally, young planted pine stands are actually growing at a faster rate than ever before – due to the continued improvement of seedling genetics. And, as timber is harvested and these stands are replanted in pine (as has historically occurred in the catchment area), over the long term, the average timber growth rate is likely to increase.
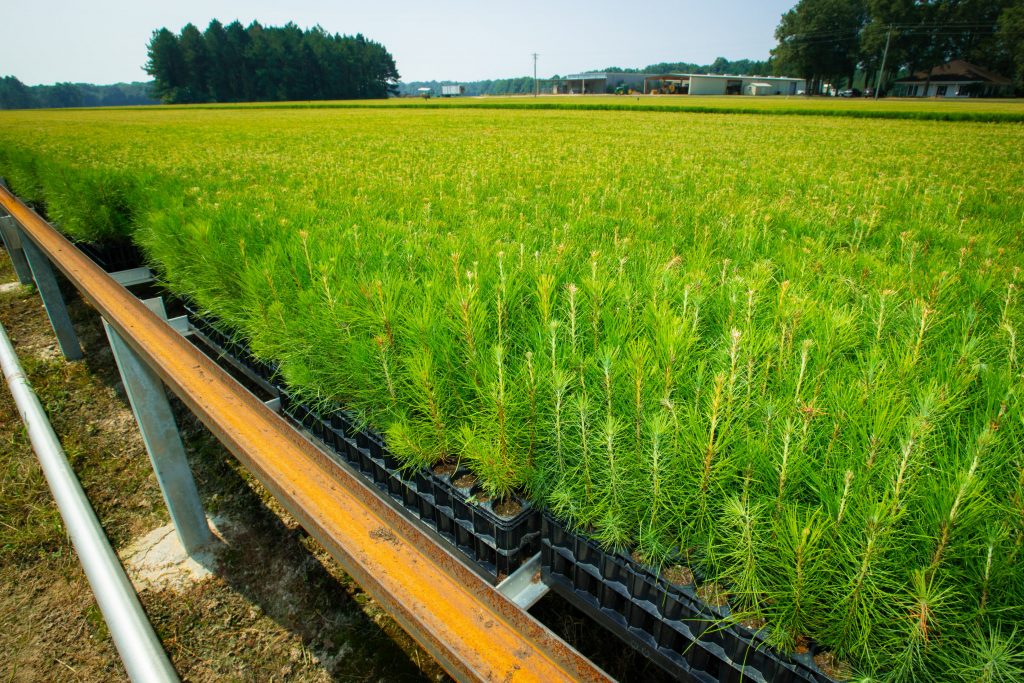
Weyerhaeuser Nursery Hazlehurst Mississippi

Forest area

Positive / neutral. Total forest (timberland) area in the catchment area increased more than 5,200 ha from 2014 through 2017, the latest available. And while our analysis of biomass demand and forest area found a moderately strong relationship between the two, findings are inconclusive as to whether the increase in timberland acreage can be attributed to increases in biomass demand.

Wood Prices

Neutral. Despite the additional wood demand placed on this market by Amite BioEnergy, since 2014, prices for delivered pine pulpwood (the primary raw material consumed by Amite BioEnergy) have decreased 12% in the catchment area. Prices for pine sawmill residuals and in-woods chips (the other two raw materials consumed by Amite BioEnergy) have also declined over the last several years – down 3% since 2016 for pine sawmill residuals and down 3% since 2015 for in-woods chips.

Markets for solid wood products

Positive / neutral. In the Amite BioEnergy catchment area, demand for softwood sawtimber to produce lumber has increased more than 50% since 2014. A biproduct of the sawmilling process is sawmill residuals – a material utilized by Amite BioEnergy to produce wood pellets. Not only has Amite BioEnergy benefited from the greater availability of this biproduct, but lumber producers have also benefited, as Amite BioEnergy has provided an additional outlet for these biproducts.

Read the full report: Catchment Area Analysis of Forest Management and Market Trends: Amite BioEnergy (UK metric version). An interview with the author, Dr Harrison Hood, Forest Economist and Principal at Hood Consulting, can be read here. Explore every delivery of wood to Amite BioEnergy using our ForestScope data transparency tool. This is part of a series of catchment area analyses around the forest biomass pellet plants supplying Drax Power Station with renewable fuel. Others in the series include: Georgia MillEstonia, Latvia, LaSalle BioenergyMorehouse Bioenergy and Chesapeake.

Climate change is the biggest challenge of our time

Drax Group CEO Will Gardiner

Climate change is the biggest challenge of our time and Drax has a crucial role in tackling it.

All countries around the world need to reduce carbon emissions while at the same time growing their economies. Creating enough clean, secure energy for industry, transport and people’s daily lives has never been more important.

Drax is at the heart of the UK energy system. Recently the UK government committed to delivering a net-zero carbon emissions by 2050 and Drax is equally committed to helping make that possible.

We’ve recently had some questions about what we’re doing and I’d like to set the record straight.

How is Drax helping the UK reach its climate goals?

At Drax we’re committed to a zero-carbon, lower-cost energy future.

And we’ve accelerated our efforts to help the UK get off coal by converting our power station to using sustainable biomass. And now we’re the largest decarbonisation project in Europe.

We’re exploring how Drax Power Station can become the anchor to enable revolutionary technologies to capture carbon in the North of England.

And we’re creating more energy stability, so that more wind and solar power can come onto the grid.

And finally, we’re helping our customers take control of their energy – so they can use it more efficiently and spend less.

Is Drax the largest carbon polluter in the UK?

No. Since 2012 we’ve reduced our CO2 emissions by 84%. In that time, we moved from being western Europe’s largest polluter to being the home of the largest decarbonisation project in Europe.

And we want to do more.

We’ve expanded our operations to include hydro power, storage and natural gas and we’ve continued to bring coal off the system.

By the mid 2020s, our ambition is to create a power station that both generates electricity and removes carbon from the atmosphere at the same time.

Does building gas power stations mean the UK will be tied into fossil fuels for decades to come?

Our energy system is changing rapidly as we move to use more wind and solar power.

At the same time, we need new technologies that can operate when the wind is not blowing and the sun is not shining.

A new, more efficient gas plant can fill that gap and help make it possible for the UK to come off coal before the government’s deadline of 2025.

Importantly, if we put new gas in place we need to make sure that there’s a route through for making that zero-carbon over time by being able to capture the CO2 or by converting those power plants into hydrogen.

Are forests destroyed when Drax uses biomass and is biomass power a major source of carbon emissions?

No.

Sustainable biomass from healthy managed forests is helping decarbonise the UK’s energy system as well as helping to promote healthy forest growth.

Biomass has been a critical element in the UK’s decarbonisation journey. Helping us get off coal much faster than anyone thought possible.

The biomass that we use comes from sustainably managed forests that supply industries like construction. We use residues, like sawdust and waste wood, that other parts of industry don’t use.

We support healthy forests and biodiversity. The biomass that we use is renewable because the forests are growing and continue to capture more carbon than we emit from the power station.
What’s exciting is that this technology enables us to do more. We are piloting carbon capture with bioenergy at the power station. Which could enable us to become the first carbon-negative power station in the world and also the anchor for new zero-carbon cluster across the Humber and the North.

How do you justify working at Drax?

I took this job because Drax has already done a tremendous amount to help fight climate change in the UK. But I also believe passionately that there is more that we can do.

I want to use all of our capabilities to continue fighting climate change.

I also want to make sure that we listen to what everyone else has to say to ensure that we continue to do the right thing.