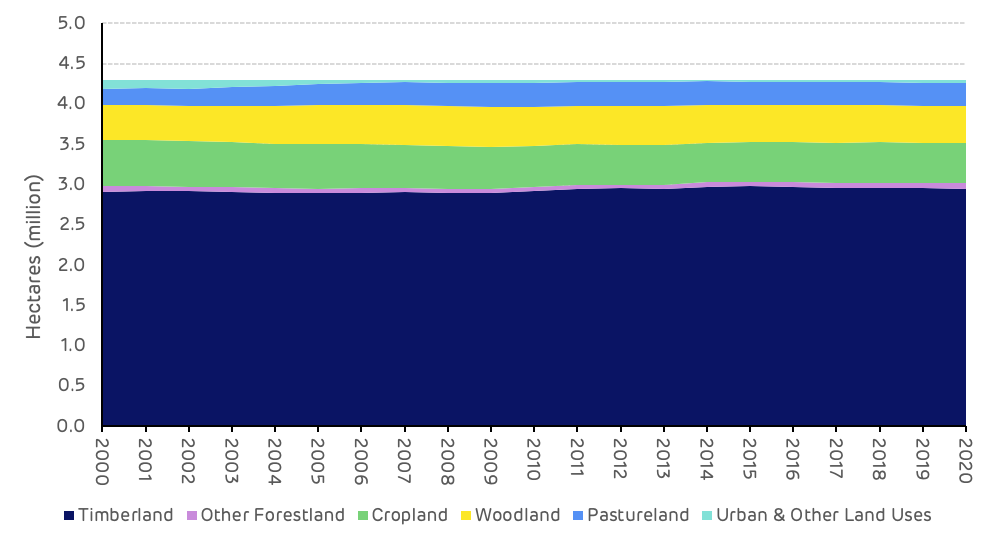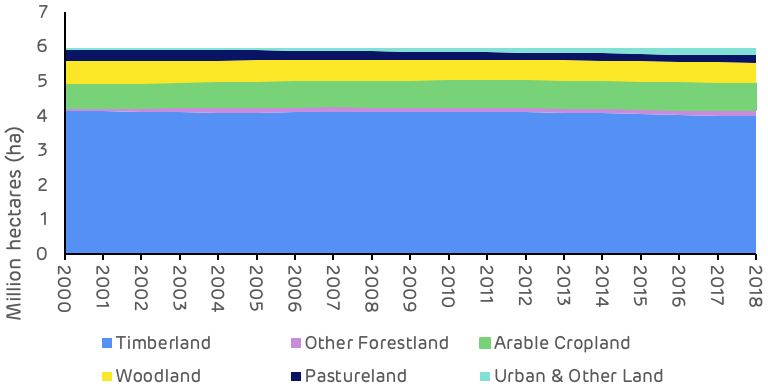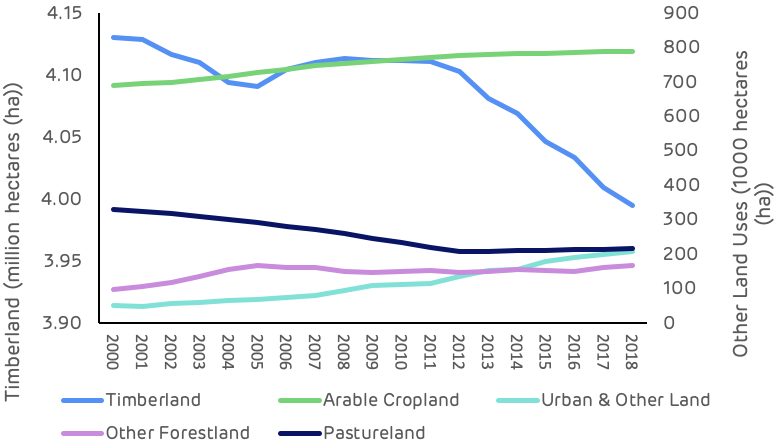


The area of timberland in the Alabama cluster catchment area has remained stable over the last 20 years, increasing slightly from 4.08 million ha to 4.16 million ha, an increase of 79 thousand hectares. This area represents 79.6% of the total land area in 2020, up from 78.1% in 2020. The total area of forestland and woodland was 86% of the catchment area in 2020, with farmland making up 13% and urban areas 1%. This land base can be considered to be heavily forested and dominated by timberland.
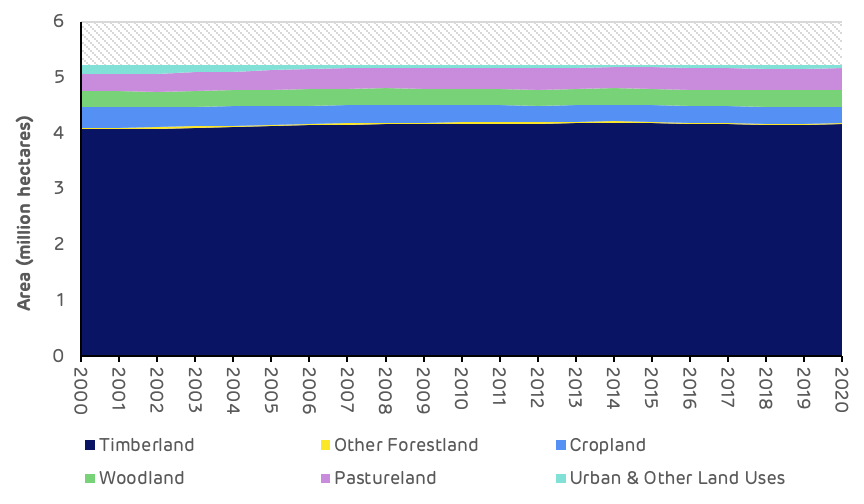
Figure 1: Land Use Type – Alabama cluster
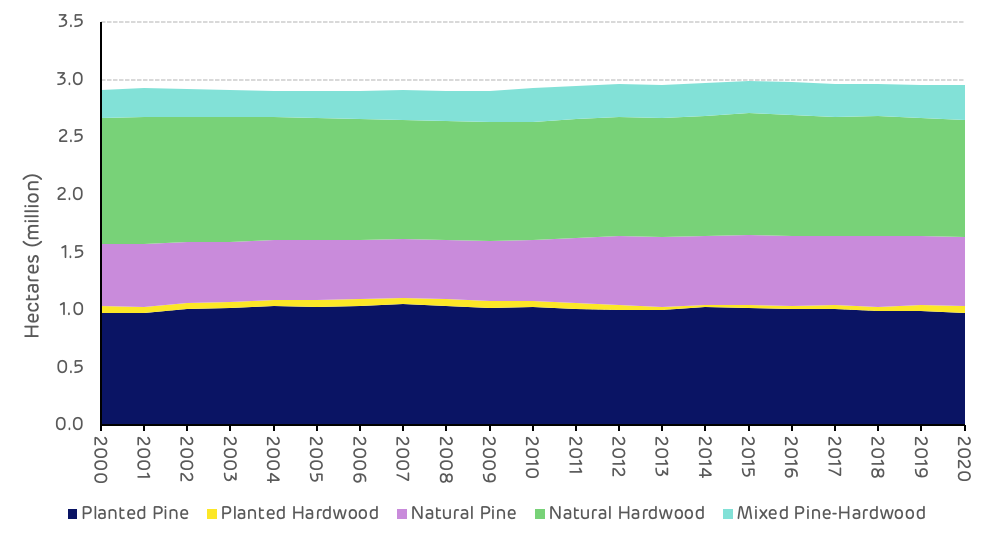
The timberland area is classified by growth rate potential, capable of achieving a minimum of 0.57 m3/ha/year. More than 95% of the timberland area is in private ownership. This proportion has remained stable since 2000 as shown in Figure 2.
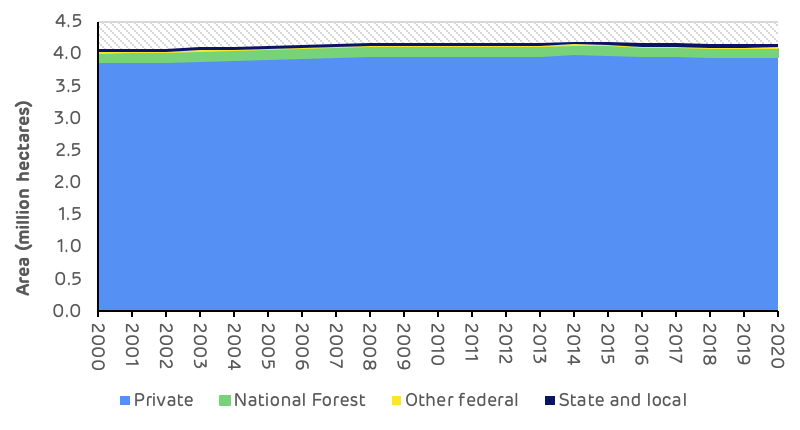
Figure 2: Timberland Ownership Profile – Alabama cluster
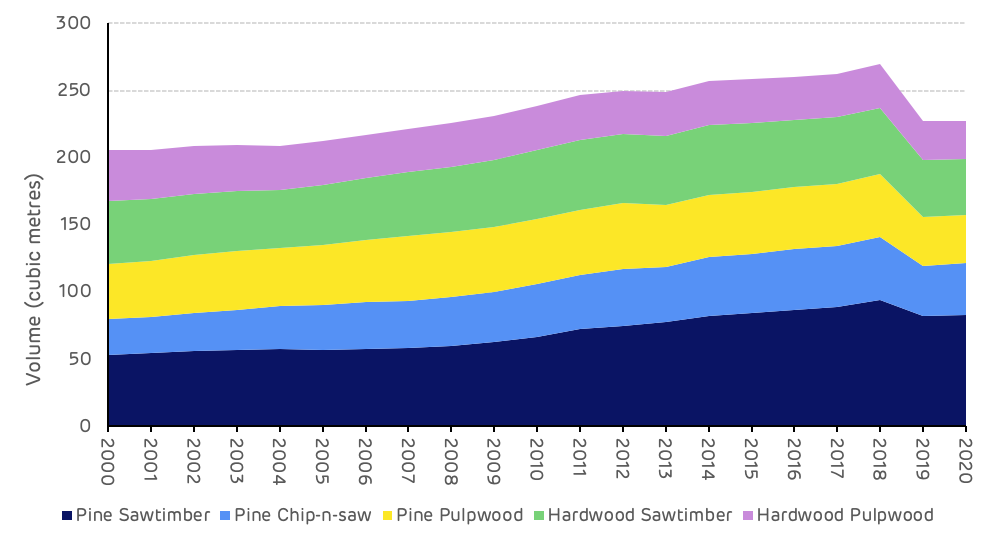
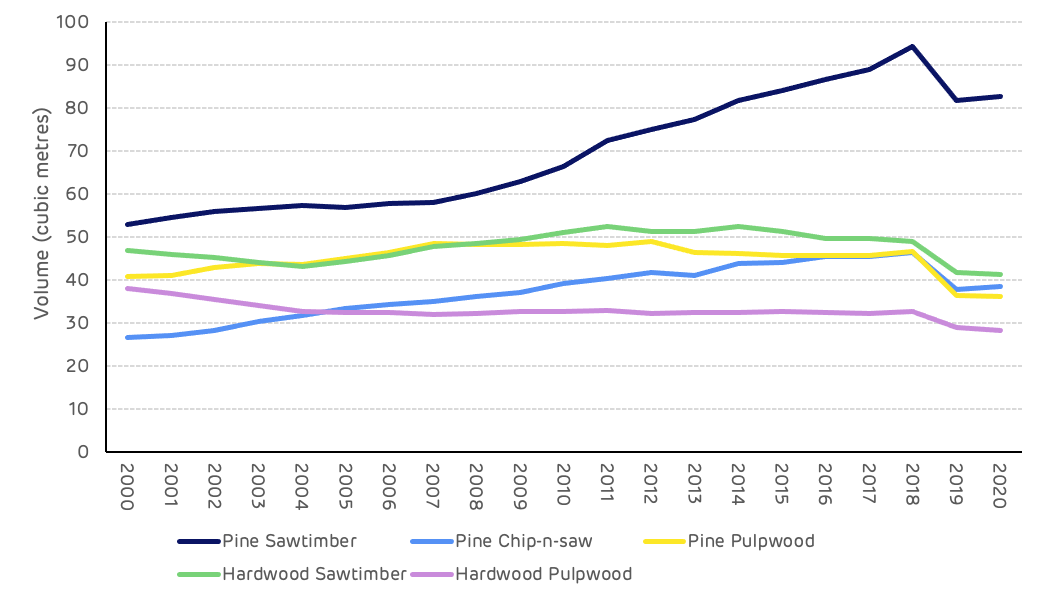
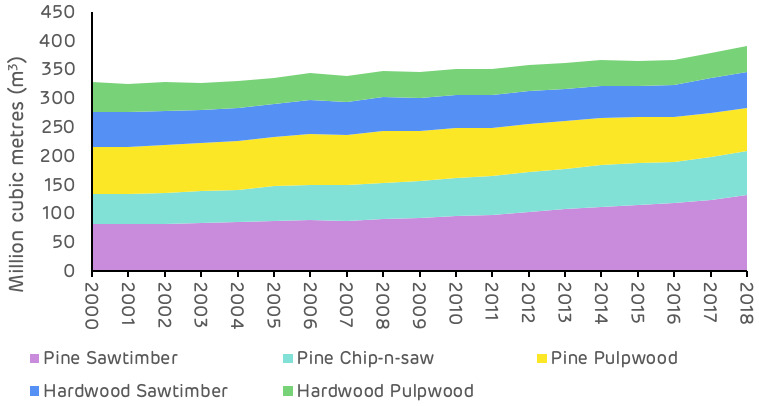
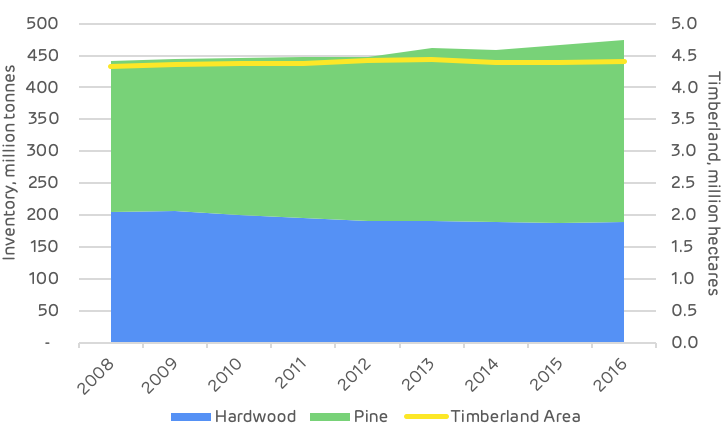
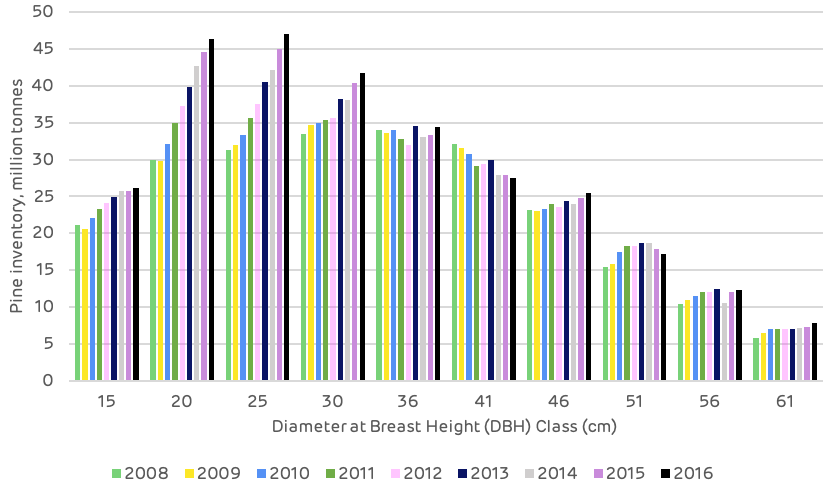
The total standing volume, the amount of carbon stored in the forest area, has increased by 115 million m3 since 2000 an increase of 30%. Most of this increase has occurred since 2010, with 90 million m3 added to the inventory since this time, reflecting the maturing age class of the forest resource as it passes through the peak growth phase. Almost all of this increase has been in the softwood pine forest area, with a combined increase of 86 million m3 since 2010. Pine saw-timber and chip-n-saw both increased by 46% since 2010 and pine pulpwood by 25% over the same period. Suggesting that the average tree size is getting larger as the forest matures.
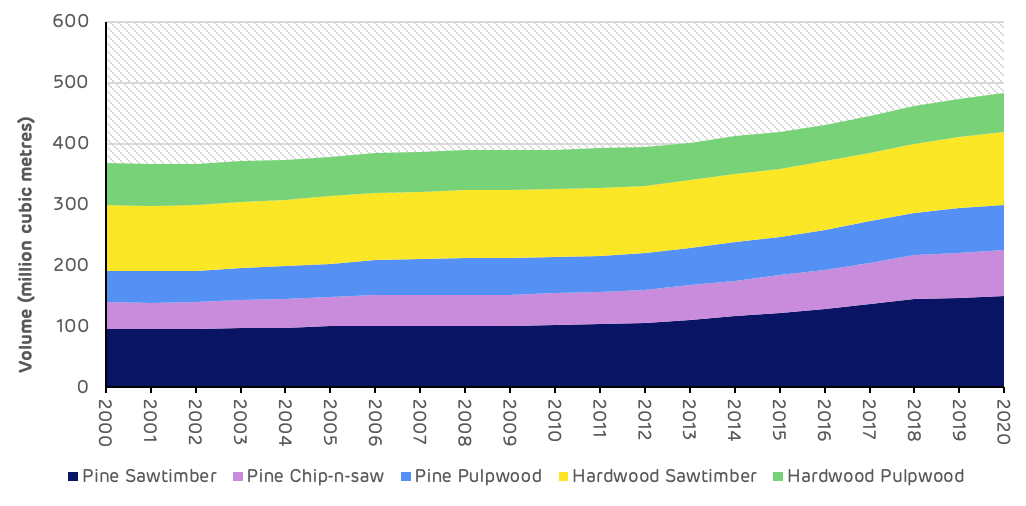
Figure 3: Standing Volume by Product Class – Alabama cluster
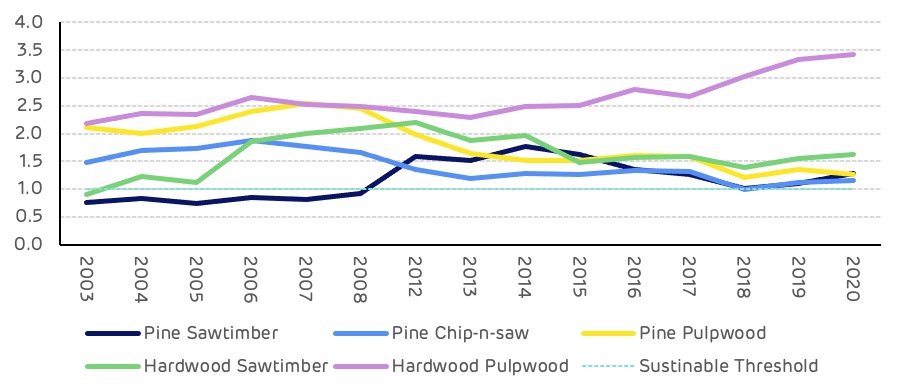
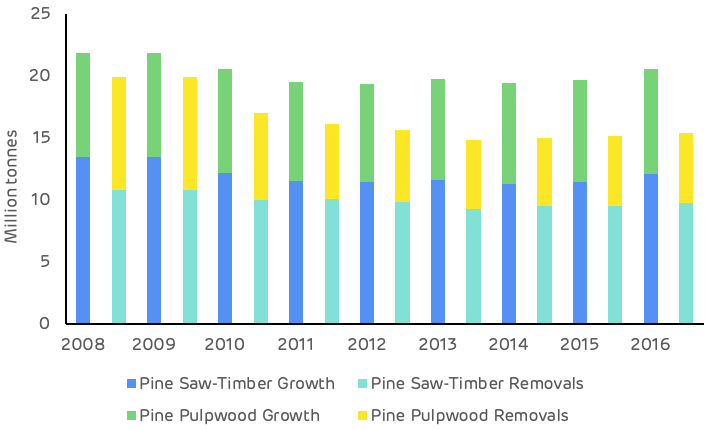
One measure of the sustainability of harvesting levels is to compare average annual growth against removals. This comparison gives a growth drain ratio (GDR). Where removals are equal to or lower than growth (a GDR of 1 or more) this is a measure of sustainability, where the ratio falls below 1, this can indicate that harvesting levels are not sustainable in the long-term. Figure 4 shows that all pine product classes have a positive GDR since 2010. In particular the pine pulpwood GDR ratio is in excess of 2 suggesting that there is a substantial surplus of this product category. By contrast, the hardwood GDR for both saw-timber and pulpwood are both lower than 1 suggesting that harvesting levels for hardwood species should be reduced until growth can recover.
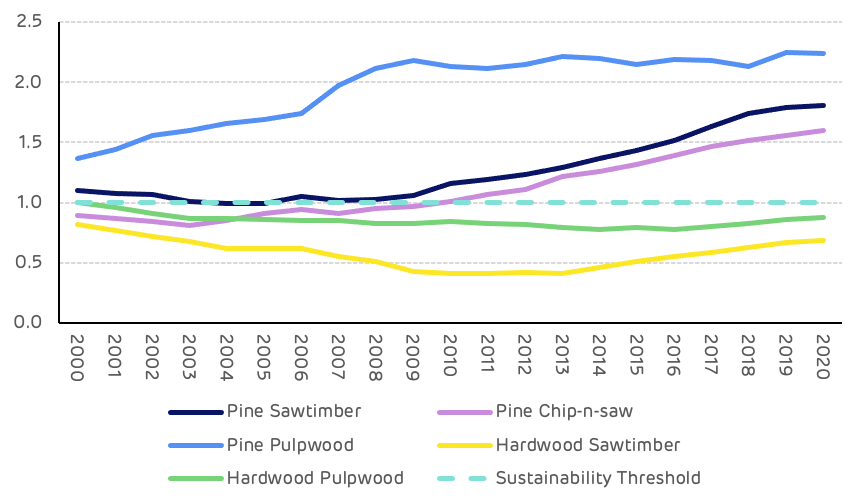
Figure 4: Growth Drain Ratio by Product Class – Alabama cluster
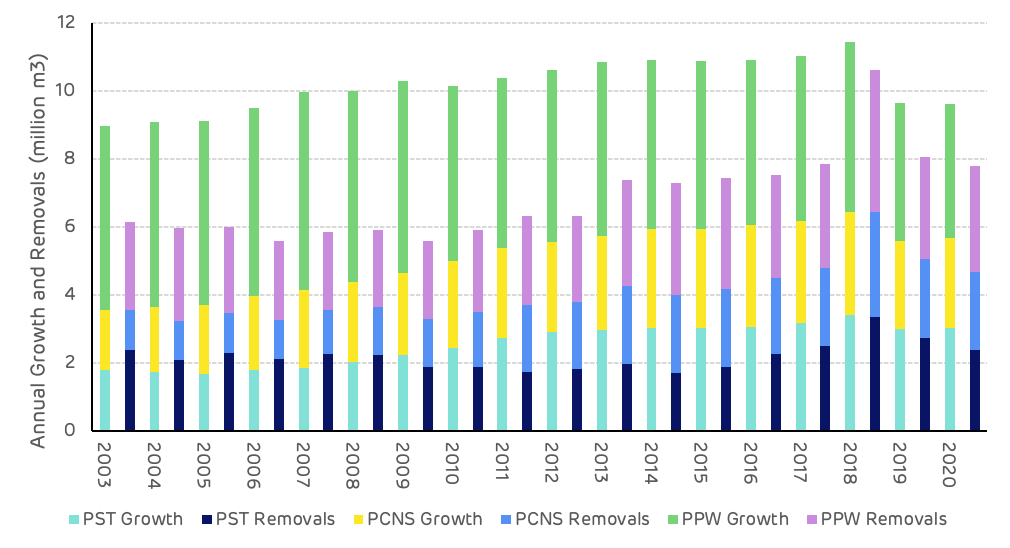
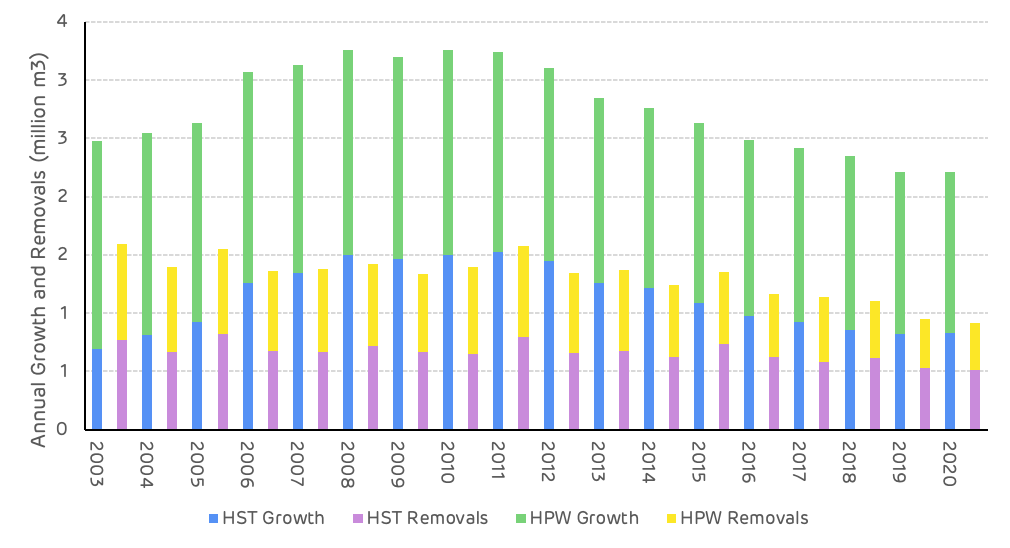
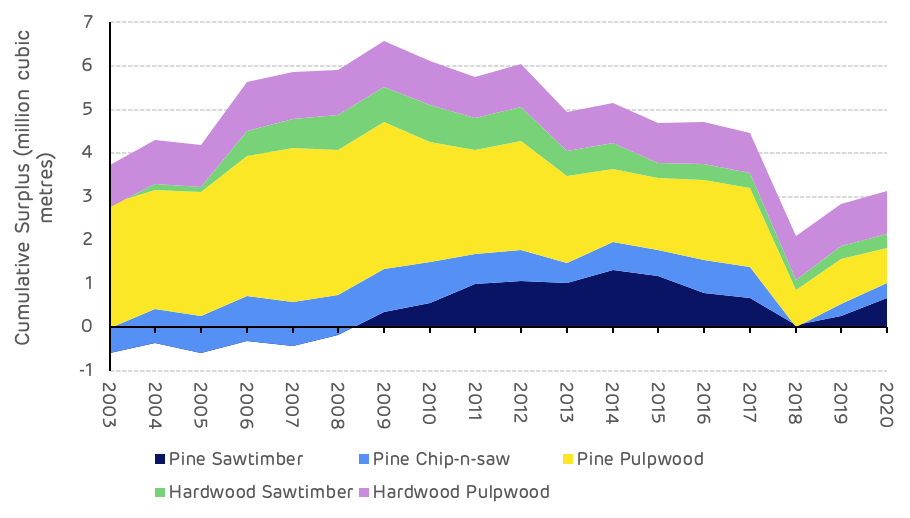
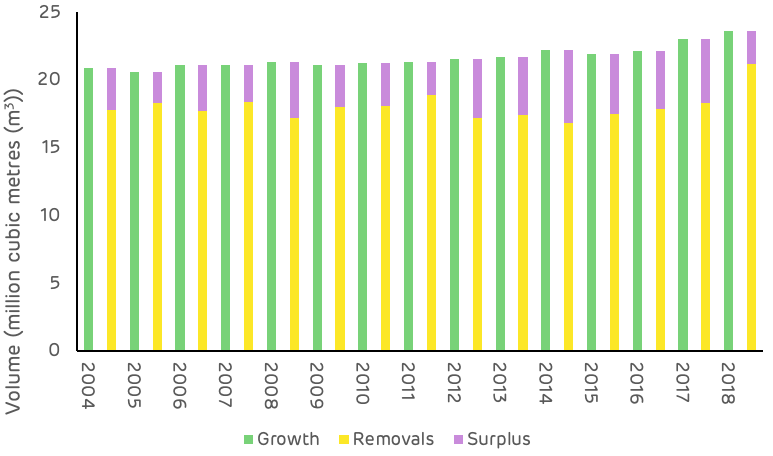
Figure 5 shows the maturing age class of the forest area, charting the change in annual surplus and deficit in each product class. The trend shows that harvesting of pine saw-timber from 2000 to 2008 represented a deficit of growth compared to harvesting removals. This indicates an immature forest resource with a low quantity of forest categorised as saw-timber, therefore harvesting volume in mature stands outweighed the growth in mid-rotation stands. As the forest aged, and more standing timber grew into the saw-timber category, the surplus of annual growth compared to removals increased. Saw-timber growth in 2020 was 3 million m3 higher than in 2000. The surplus of pine pulpwood has remained positive and has increased substantially from 3 million m3 in 2000 to 6.5 million m3 in 2020 despite harvesting levels increasing slightly over this period.
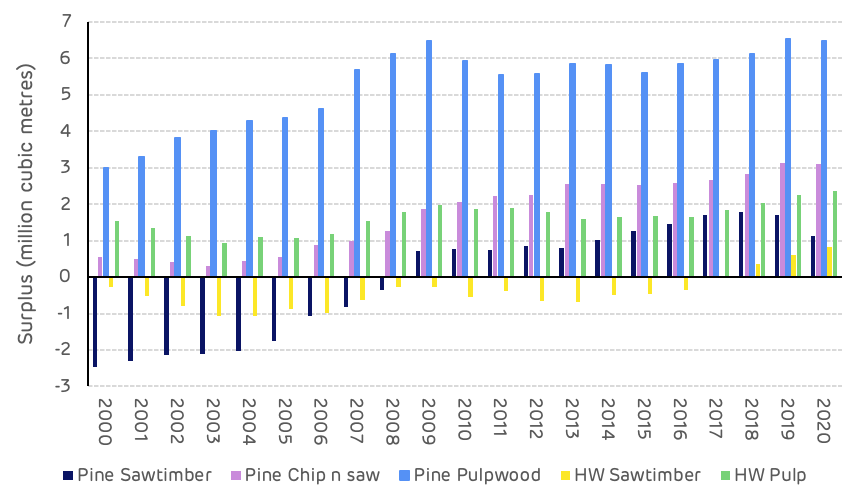
Figure 5: Annual Surplus/Deficit of Growth and Removal by Product Class – Alabama Cluster
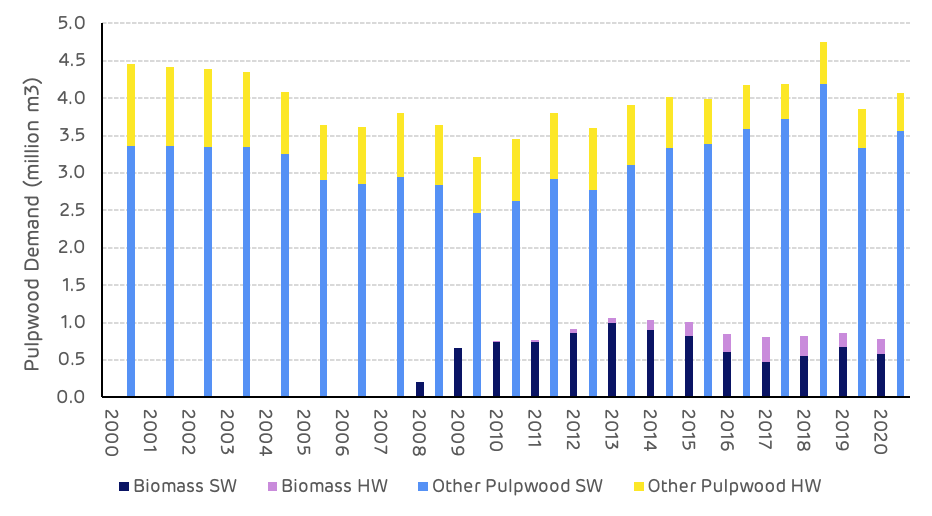
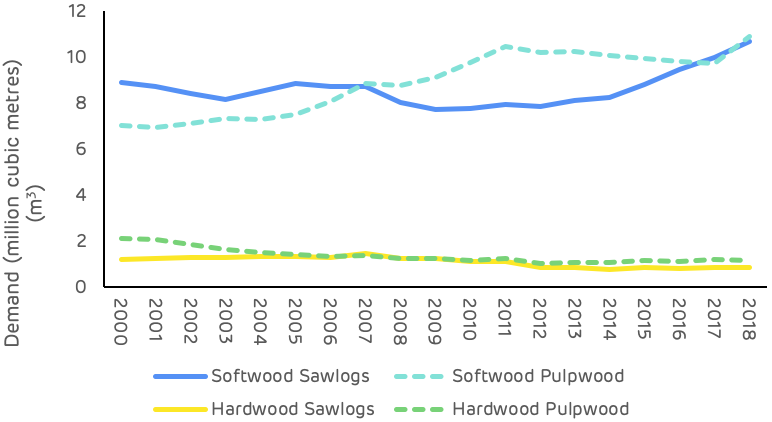
Biomass demand began in 2008 at a very small scale, representing just 0.5% of total pulpwood demand in the catchment area. From around 2013 it began to increase and reached peak in 2015 with a total demand of 724,000 tons of pulpwood in that year, representing 8.1% of total pulpwood demand in the catchment area. After that time, demand for pulpwood declined as pellet mills switched to mill residuals. The latest data on pulpwood demand shows that the biomass sectors made up just 2.8% of total pulpwood demand in 2020 with just over 216,000 tonnes of total demand. This demonstrates that the biomass and wood pellet sector is a very small component of the market in this region and unlikely to influence forest management decision making, as shown in Figure 6.
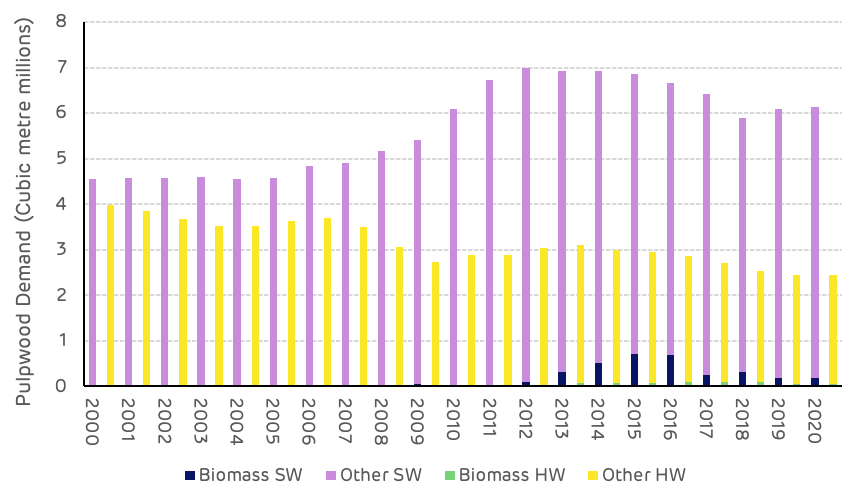
Figure 6: Pulpwood Demand by Market – Alabama Cluster
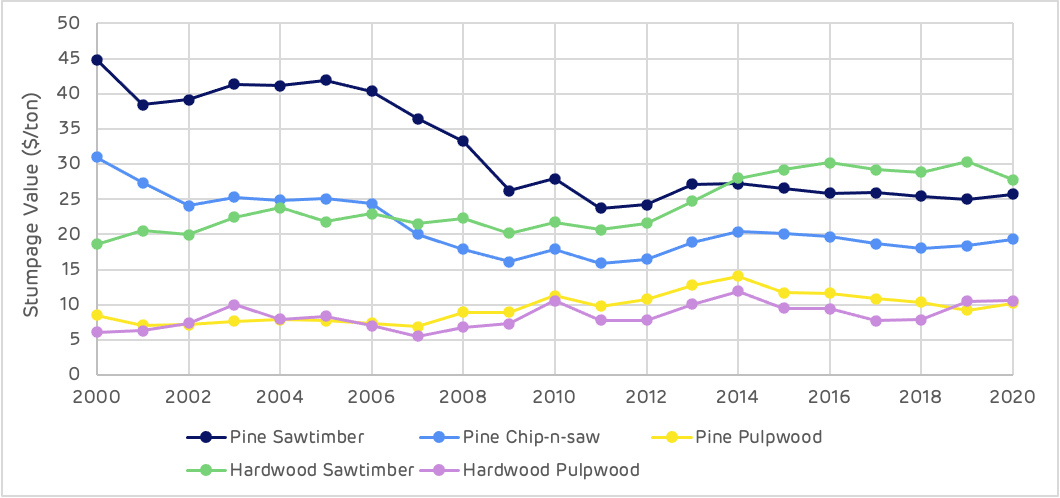
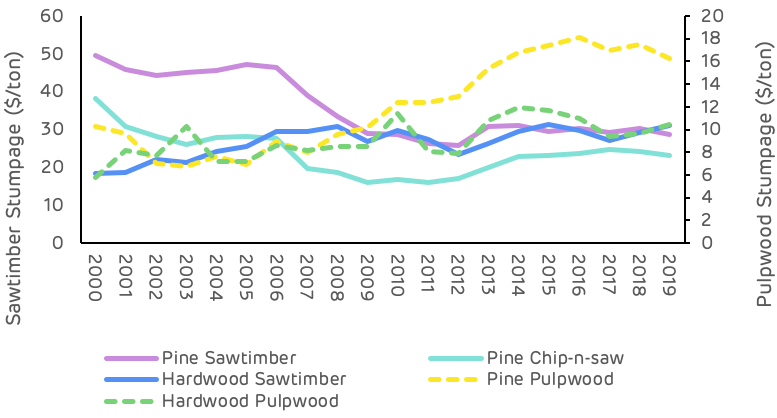
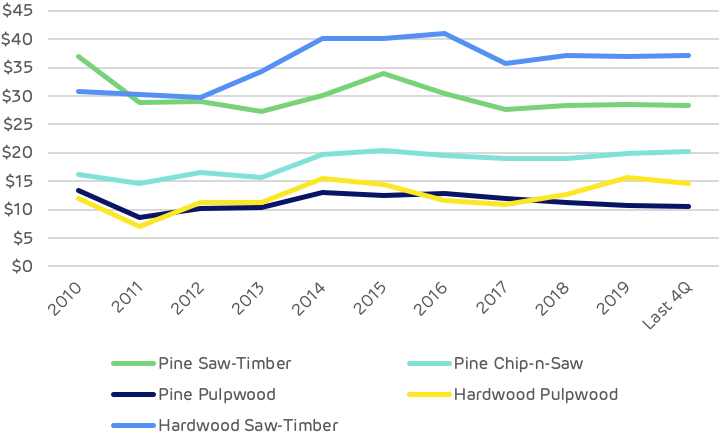
Pine pulpwood stumpage prices have declined significantly since a peak in 2013, falling from an annual high of $9.46 when demand was strongest to just $4.12 in 2020 as demand for pine pulpwood declined in 2020. Pine saw-timber prices have seen a similar decline from a high point in the early 2000’s to a plateau from 2011 onwards. Saw-timber stumpage more than halved in value over this period from $49 per ton to $22 per ton. This can have a significant impact on forest management objectives and decision making.
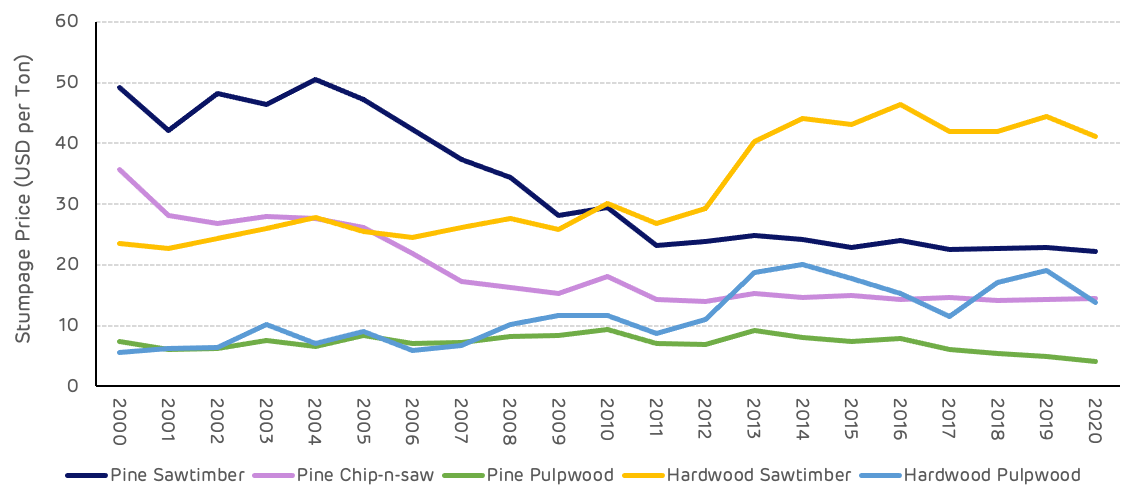
Figure 7: Stumpage Price Change by Product Category – Alabama Cluster
Detailed below are the summary findings from Hood Consulting on the impact of biomass demand on key issues in the Alabama cluster catchment area.
Is there any evidence that bioenergy demand has caused the following:
Deforestation?
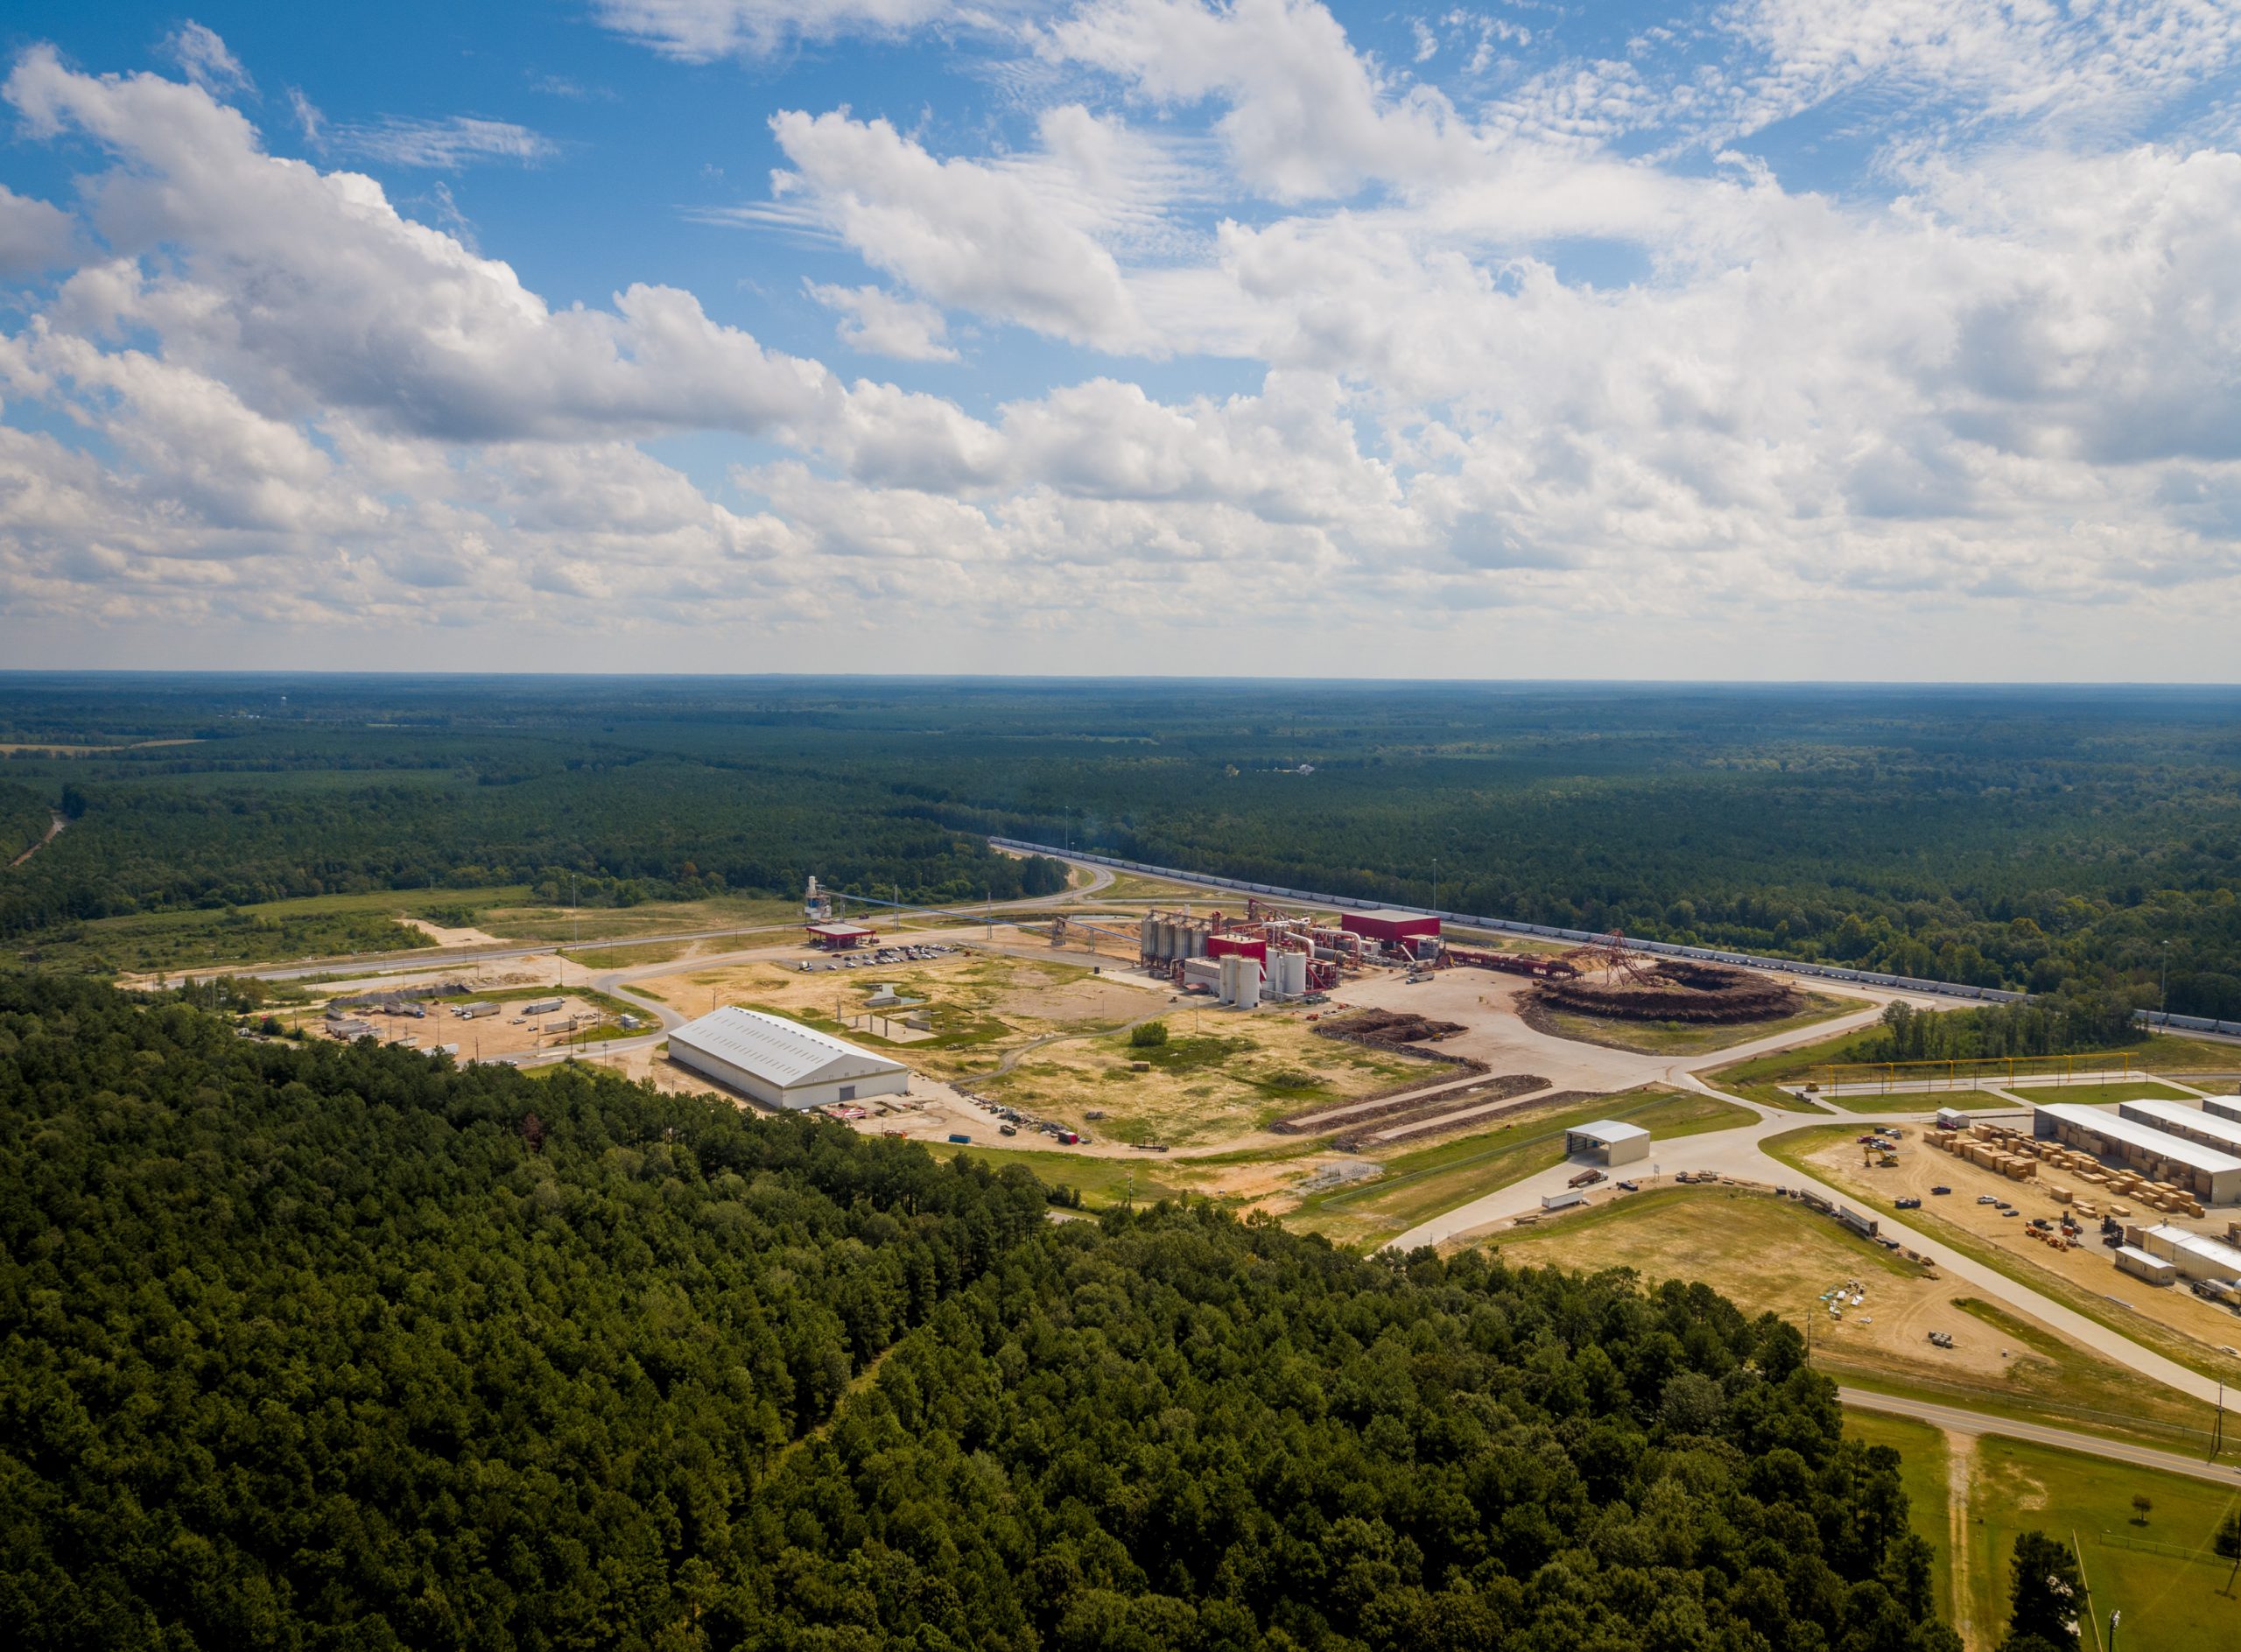
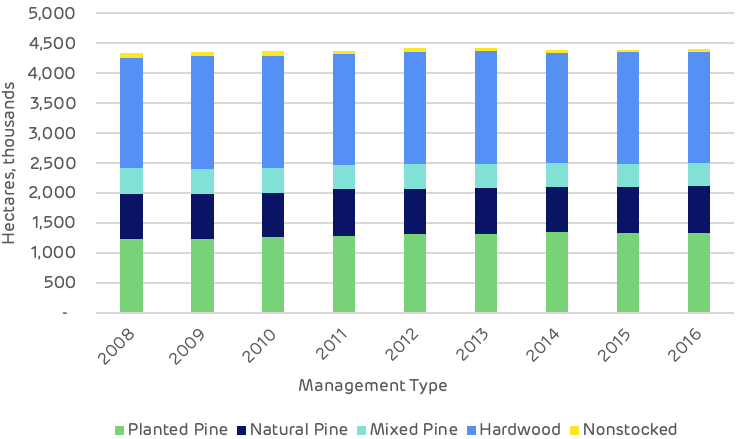
No. US Forest Service (USFS) data shows that total timberland area has held steady and averaged roughly 4,172,000 hectares in the Alabama Cluster catchment area since Alabama Pellets-Aliceville started up in late-2012. More importantly, planted pine timberland (the predominant source of roundwood utilized by the bioenergy industry for wood pellet production) has increased more than 75,000 hectares (+4.9%) in the catchment area since Alabama Pellets’ startup in 2012.
A change in management practices (rotation lengths, thinnings, conversion from hardwood to pine)?
Inconclusive. Changes in management practices have occurred in the catchment area over the last two decades. However, the evidence is inconclusive as to whether increased demand attributed to bioenergy has caused or is responsible for those changes.
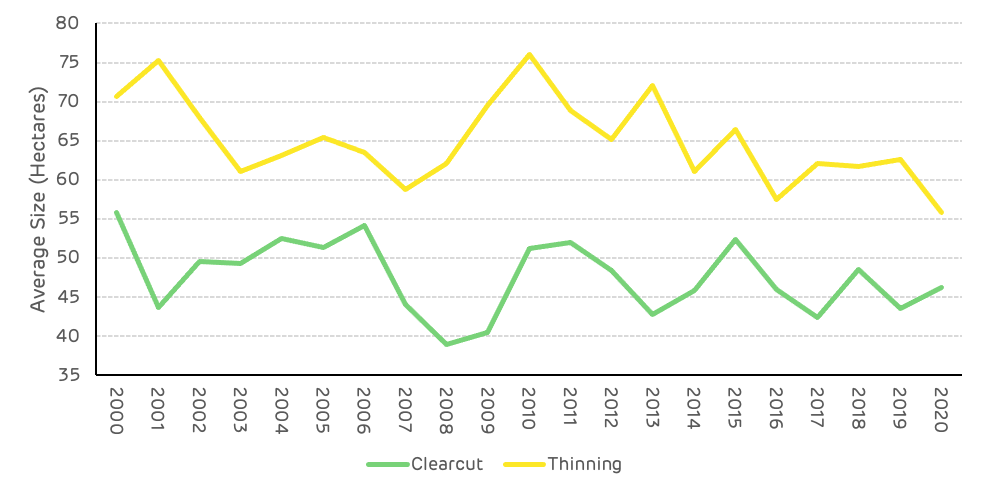
Clearcuts and thinnings are the two major types of harvests that occur in this region, both of which are long-standing, widely used methods of harvesting timber. TimberMart-South (TMS) data shows that the prevalence of thinnings temporarily increased in the Alabama Cluster market (from 2007-2013) due to the weakening of pine sawtimber markets. Specifically, challenging market conditions saw pine sawtimber stumpages prices decline from an average of $47 per ton from 2000-2006 to just over $23 per ton in 2011, or a roughly 50% decrease from 2000-2006 average levels. This led many landowners to refrain from clearcutting (a type of harvest which typically removes large quantities of pine sawtimber), as they waited for pine sawtimber prices to improve. However, pine sawtimber stumpage prices never recovered and have held between $22 and $25 per ton since 2011. Ultimately, landowners returned to more ‘normal’ management practices by 2014, with thinnings falling back in line with pre-2007 trends.
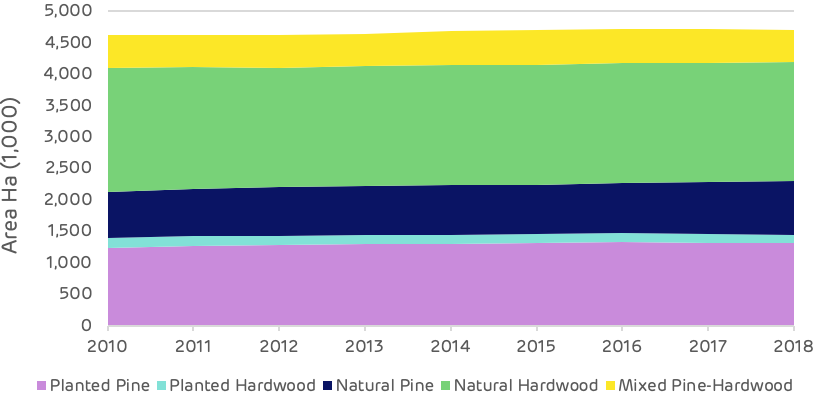
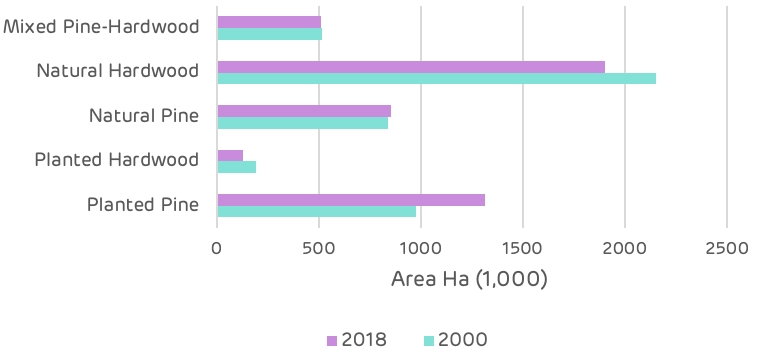
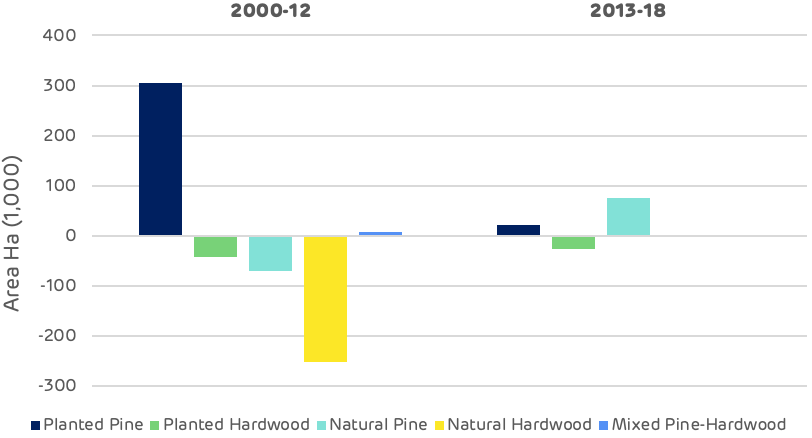
The catchment area has also experienced some conversion. Specifically, from 2000-2020, planted pine timberland increased more than 460,000 hectares while natural hardwood and mixed pine-hardwood timberland decreased a combined 390,000 hectares. Note that the increase in planted pine timberland and decrease in natural hardwood/mixed pine-hardwood timberland over this period were both gradual and occurred simultaneously. This suggests a management trend in which natural timber stands are converted to plantation pine following final harvest. It’s also important to note that there is little evidence that links these changes to increased demand from bioenergy, as this conversion trend begun years prior to the startup of Alabama Pellets and continued nearly unchanged following the pellet mill’s startup.
Diversion from other markets?
No. Demand for softwood (pine) sawlogs increased an estimated 12% in the catchment area from 2012-2020. Also, there is no evidence that increased demand from bioenergy has caused a diversion from other softwood pulpwood markets (i.e. pulp/paper). Also, even though softwood pulpwood demand not attributed to bioenergy is down 14% since Alabama Pellets-Aliceville’s startup in 2012, there is no evidence that increased demand from bioenergy has caused this decrease. Rather, the decrease in demand from non-bioenergy sources is due to a combination of reduced product demand (and therefore reduced production) and increased utilization of sawmill residuals.
An unexpected or abnormal increase in wood prices?
No. The startup of Alabama Pellets-Aliceville added roughly 450,000 metric tons of softwood pulpwood demand to the catchment area from 2012-2016, and this increase in demand coincided with essentially no change in delivered pine pulpwood (PPW) price over this same period. Ultimately, the additional demand placed on the catchment area following the startup of Alabama Pellets-Aliceville was offset by a decrease in demand from other sources from 2012-2016, and, as a result, delivered PPW prices remained nearly unchanged.
However, the Aliceville facility was shut down for a majority of 2017 due to the catastrophic failure of a key piece of environmental equipment, and this was followed by Alabama Pellets’ strategic decision to transition to residual-consumption only beginning in 2018, which eliminated more than 360,000 metric tons of annual softwood pulpwood demand from 2016-2018. Over this same period, softwood pulpwood demand from other sources also decreased nearly 360,000 metric tons. So, with the elimination of roughly 720,000 metric tons of annual softwood pulpwood demand from all sources from 2016-2018, delivered PPW prices in the catchment area proceeded to decrease more than 6% over this period. Since 2018, total softwood pulpwood demand has increased roughly 4% in the catchment area (due to increases in demand from non-bioenergy sources), and this increase that has coincided with a simultaneous 4% increase in delivered PPW price.
Statistical analysis did identify a positive relationship between softwood biomass demand and delivered PPW price. However, the relationship between delivered PPW price and non-biomass-related softwood pulpwood demand was found to be stronger, which is not unexpected given that pine pulpwood demand not attributed to bioenergy has accounted for 94% of total pine pulpwood demand in the catchment area since 2012. Ultimately, the findings provide evidence that PPW price is influenced by demand from all sources – not just from bioenergy or from pulp/paper, but from both.
Furthermore, note that Alabama Pellets’ shift to residual-consumption only beginning in 2018 resulted in no increase in pine sawmill chip prices, as the price of pine sawmill chips in the Alabama Cluster catchment area rather decreased from 2018-2020, despite a more than 100,000-metric ton increase in pine sawmill chip consumption by the Aliceville mill over this period.
A reduction in growing stock timber?
No. From 2012 (the year Alabama Pellets started up) to 2020, total growing stock inventory increased an average of 2.6% per year (+22% total) in the Alabama Cluster catchment area. Specifically, inventories of pine sawtimber and pine chip-n-saw increased 41% and 40%, respectively, while pine pulpwood (PPW) inventory increased 25% over this same period.
A reduction in the sequestration rate of carbon?
No. US Forest Service (USFS) data shows the average annual growth rate of total growing stock timber in the Alabama Cluster catchment area increased from 6.0% in 2012 to 6.2% in 2020, suggesting that the sequestration rate of carbon also increased slightly over this period.
Note that the increase in overall growth rate (and therefore increase in the sequestration rate of carbon) can be linked to gains in pine timberland and associated changes with the catchment area forest. Specifically, growth rates decline as timber ages, so the influx of new pine timberland (due to the conversion of both hardwood forests and cropland) has resulted in just the opposite, with the average age of softwood (pine) growing stock inventory decreasing from an estimated 35.4 years of age in 2000 to 33.2 years of age in 2010 and to 32.2 years of age in 2020 (total growing stock inventory decreased from 41.9 to 41.0 and to 40.4 years of age over these periods).
An increase in harvesting above the sustainable yield capacity of the forest area?
No. Growth-to-removals (G:R) ratios, which compare annual timber growth to annual timber removals, provides a measure of market demand relative to supply as well as a gauge of market sustainability. In 2020, the latest available, the G:R ratio for pine pulpwood (PPW), the predominant timber product utilized by the bioenergy sector, equaled 3.26 (recall that a value greater than 1.0 indicates sustainable harvest levels).
Moreover, note that the PPW G:R ratio has increased in the catchment area since the Aliceville mill’s startup in 2012, despite the associated increases in pine pulpwood demand. In this catchment area, pine pulpwood demand from non-bioenergy sources decreased more than 860,000 metric tons from 2012 to 2020, and this decrease more than offset any increase in demand from bioenergy.
Impact of bioenergy demand on:
Timber growing stock inventory
Neutral. According to USFS data, inventories of pine pulpwood (PPW) increased 25% in the catchment area from 2012-2020, and this increase in PPW inventory can be linked to both increases in pine timberland and harvest levels below the sustainable yield capacity of the forest area. Specifically, pine timberland (both planted and natural combined) increased more than 185,000 hectares in the catchment area from 2012-2020. Over this same period, annual harvests of PPW were 65% below maximum sustainable levels.
Timber growth rates
Neutral. The average annual growth rate of total growing stock timber increased from 6.0% in 2012 to 6.2% in 2020 in the Alabama Cluster catchment area, despite pine pulpwood (PPW) growth rate decreasing from 15.1% to 12.5% over this period. However, this decrease in PPW growth rate was not due to increased demand attributed to bioenergy but rather to the aging of PPW within its product group and its natural movement along the pine growth rate curve. Specifically, USFS data indicates the average age of PPW inventory in the catchment area increased from an estimated 13.4 years of age in 2012 to 13.6 years of age in 2020.
Forest area
Neutral. In the Alabama Cluster catchment area, total forest (timberland) area remained nearly unchanged (decreasing only marginally) from 2012-2020. However, pine timberland – the predominant source of roundwood utilized by the bioenergy industry for wood pellet production – increased more than 185,000 hectares over this period, and this increase can be linked to several factors, including conversion from both hardwood and mixed pine-hardwood forests as well as conversion from cropland.
Specifically, the more than 185,000-hectare increase in pine timberland from 2012-2020 coincided with a roughly 197,000-hectare decrease in hardwood/mixed pine-hardwood timberland and a more than 8,000-hectare decrease in cropland over this period. Furthermore, statistical analysis confirmed these inverse relationships, identifying strong negative correlations between pine timberland area and both hardwood/mixed pine-hardwood timberland area and cropland in the catchment area from 2012-2020.
Wood prices
Negative/Neutral. Softwood pulpwood demand attributed to bioenergy increased from roughly 80,000 metric tons in 2012 (the year Alabama Pellets-Aliceville started up) to more than 655,000 metric tons in 2015 (the year biomass demand reached peak levels). However, this roughly 575,000-metric ton increase in softwood biomass demand coincided with essentially no change in delivered pine pulpwood (PPW) price – which averaged $26.40 per ton in 2012 and $26.39 per ton in 2015. Ultimately, the additional demand placed on this catchment area following the startup of Alabama Pellets-Aliceville was offset by a more than 680,000-metric ton decrease in demand from other sources over this same period, and, as a result, delivered PPW prices remained nearly unchanged. Also note that Alabama Pellets’ strategic shift to consume residuals only (a transition that begun in 2018 and had been completed by 2019) resulted in a nearly 480,000-metric ton decrease in softwood biomass demand in the catchment area from 2015 to 2020. Over this same period, softwood pulpwood demand from other sources decreased more than 180,000 metric tons. In total, softwood pulpwood demand from all sources decreased more than 660,000 metric tons from 2015 to 2020, and this decrease in demand resulted in delivered PPW prices decreasing 5% over this period.
Statistical analysis did identify a positive relationship between softwood biomass demand and delivered PPW price. However, the relationship between delivered PPW price and non-biomass-related softwood pulpwood demand was found to be stronger, which is not unexpected given that pine pulpwood demand not attributed to bioenergy has accounted for 94% of total pine pulpwood demand in the catchment area since 2012. Ultimately, the findings provide evidence that PPW price is influenced by demand from all sources – not just from bioenergy or from pulp/paper, but from both.
Markets for solid wood products
Positive. In the Alabama Cluster catchment area, demand for softwood sawlogs used to produce lumber and other solid wood products has increased an estimated 12% since 2012, and this increase in softwood lumber production has consequentially resulted in the increased production of sawmill residuals (i.e. chips, sawdust, and shavings) – by-products of the sawmilling process and materials utilized by Alabama Pellets to produce wood pellets.
Moreover, the increased availability of sawmill residuals and lower relative cost compared to roundwood (after chipping and other processing costs are considered) led Alabama Pellets to make a strategic shift to utilize residuals only for wood pellet production beginning in 2019. So, not only has Alabama Pellets benefited from the greater availability of this lower-cost sawmill by-product, but lumber producers have also benefited, as Alabama Pellets has provided an additional outlet for these producers and their by-products.