Reduced demand, boosted renewables, and the near-total abandonment of coal pushed last quarter’s carbon emissions from electricity generation below 10 million tonnes.
Emissions are at their lowest in modern times, having fallen by three-quarters compared to the same period ten years ago. The average carbon emissions fell to a new low of 153 grams per kWh of electricity consumed over the quarter.
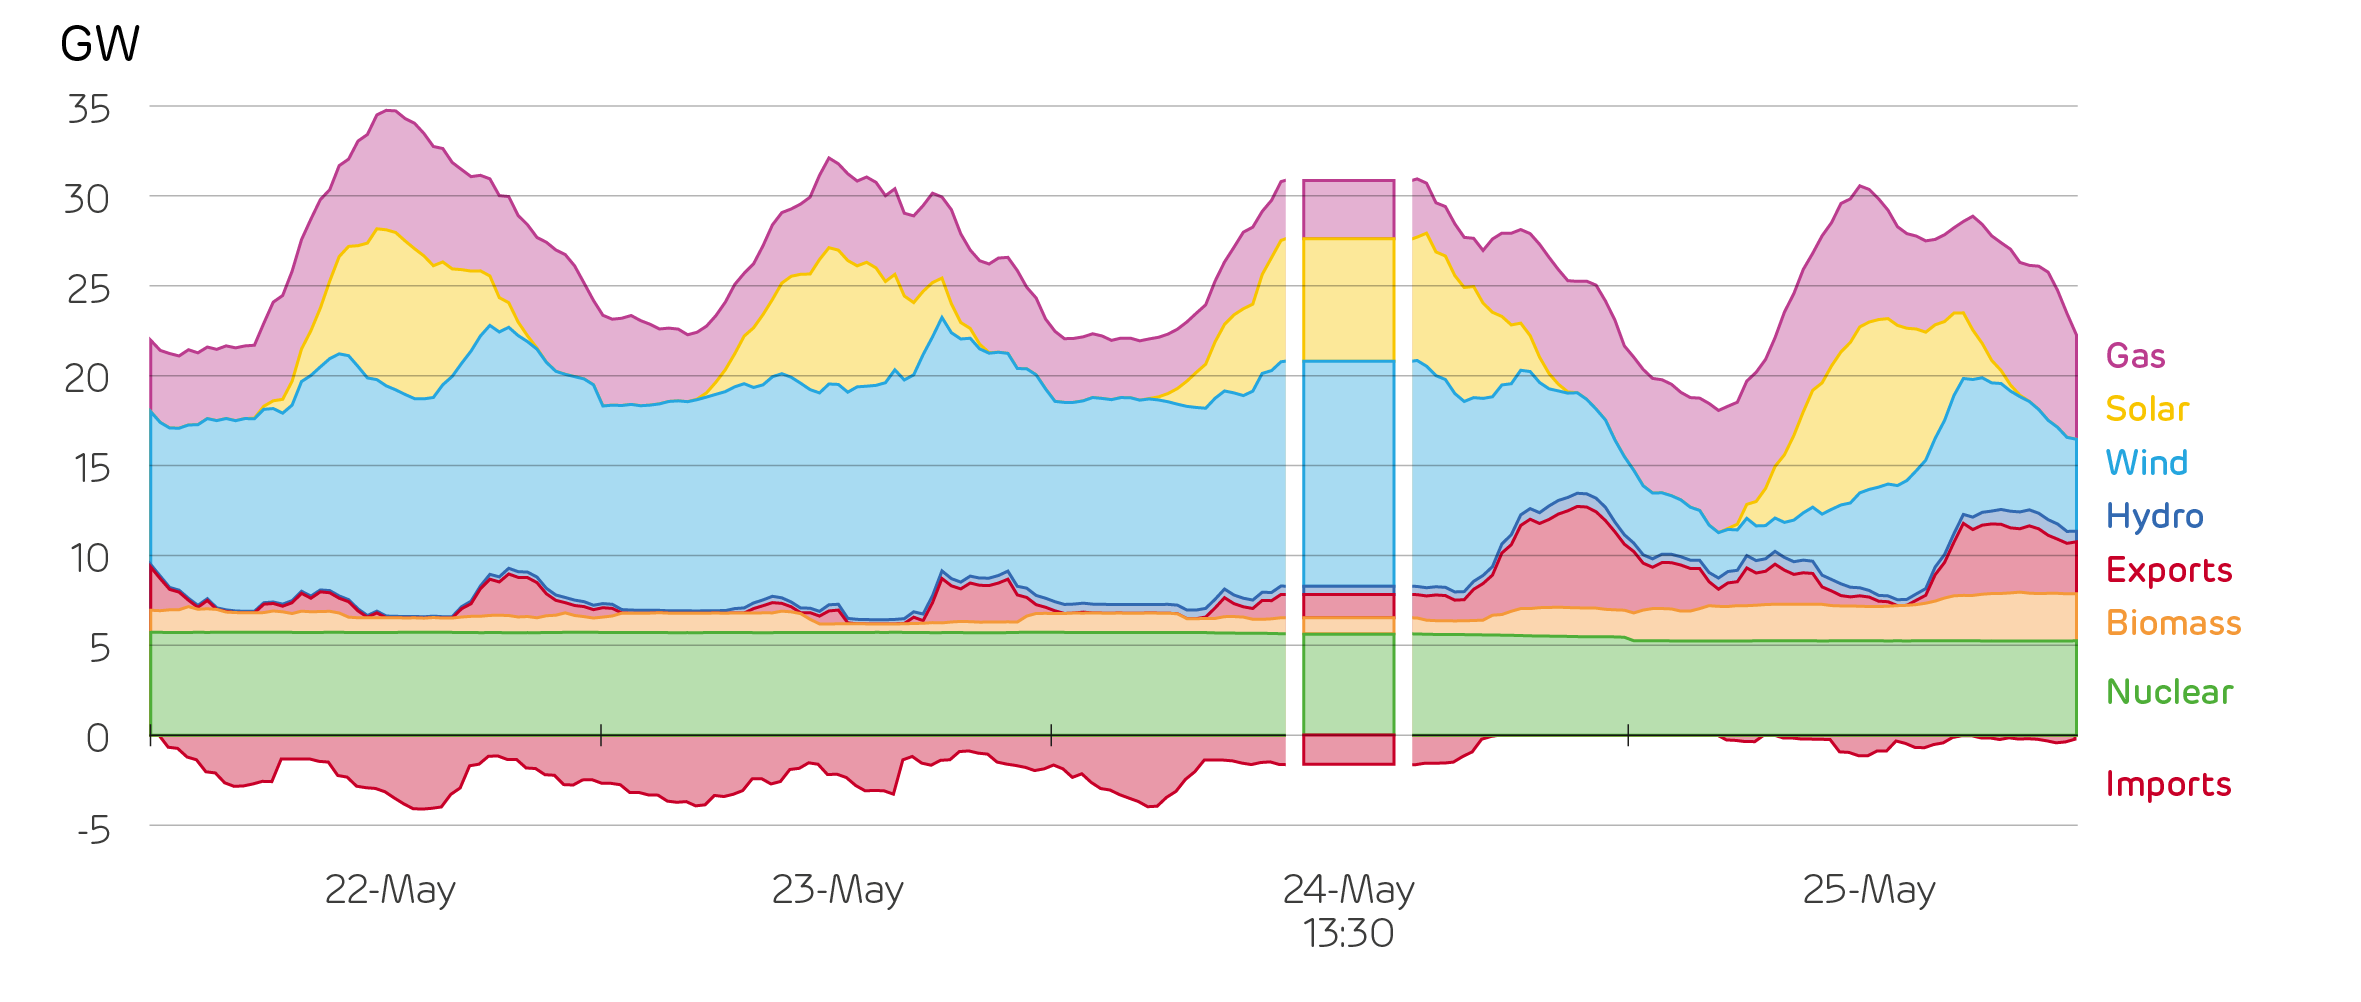
The carbon intensity also plummeted to a new low of just 18 g/kWh in the middle of the Spring Bank Holiday. Clear skies with a strong breeze meant wind and solar power dominated the generation mix.
Together, nuclear and renewables produced 90% of Britain’s electricity, leaving just 2.8 GW to come from fossil fuels.

The generation mix over the Spring Bank Holiday weekend, highlighting the mix on the Sunday afternoon with the lowest carbon intensity on record
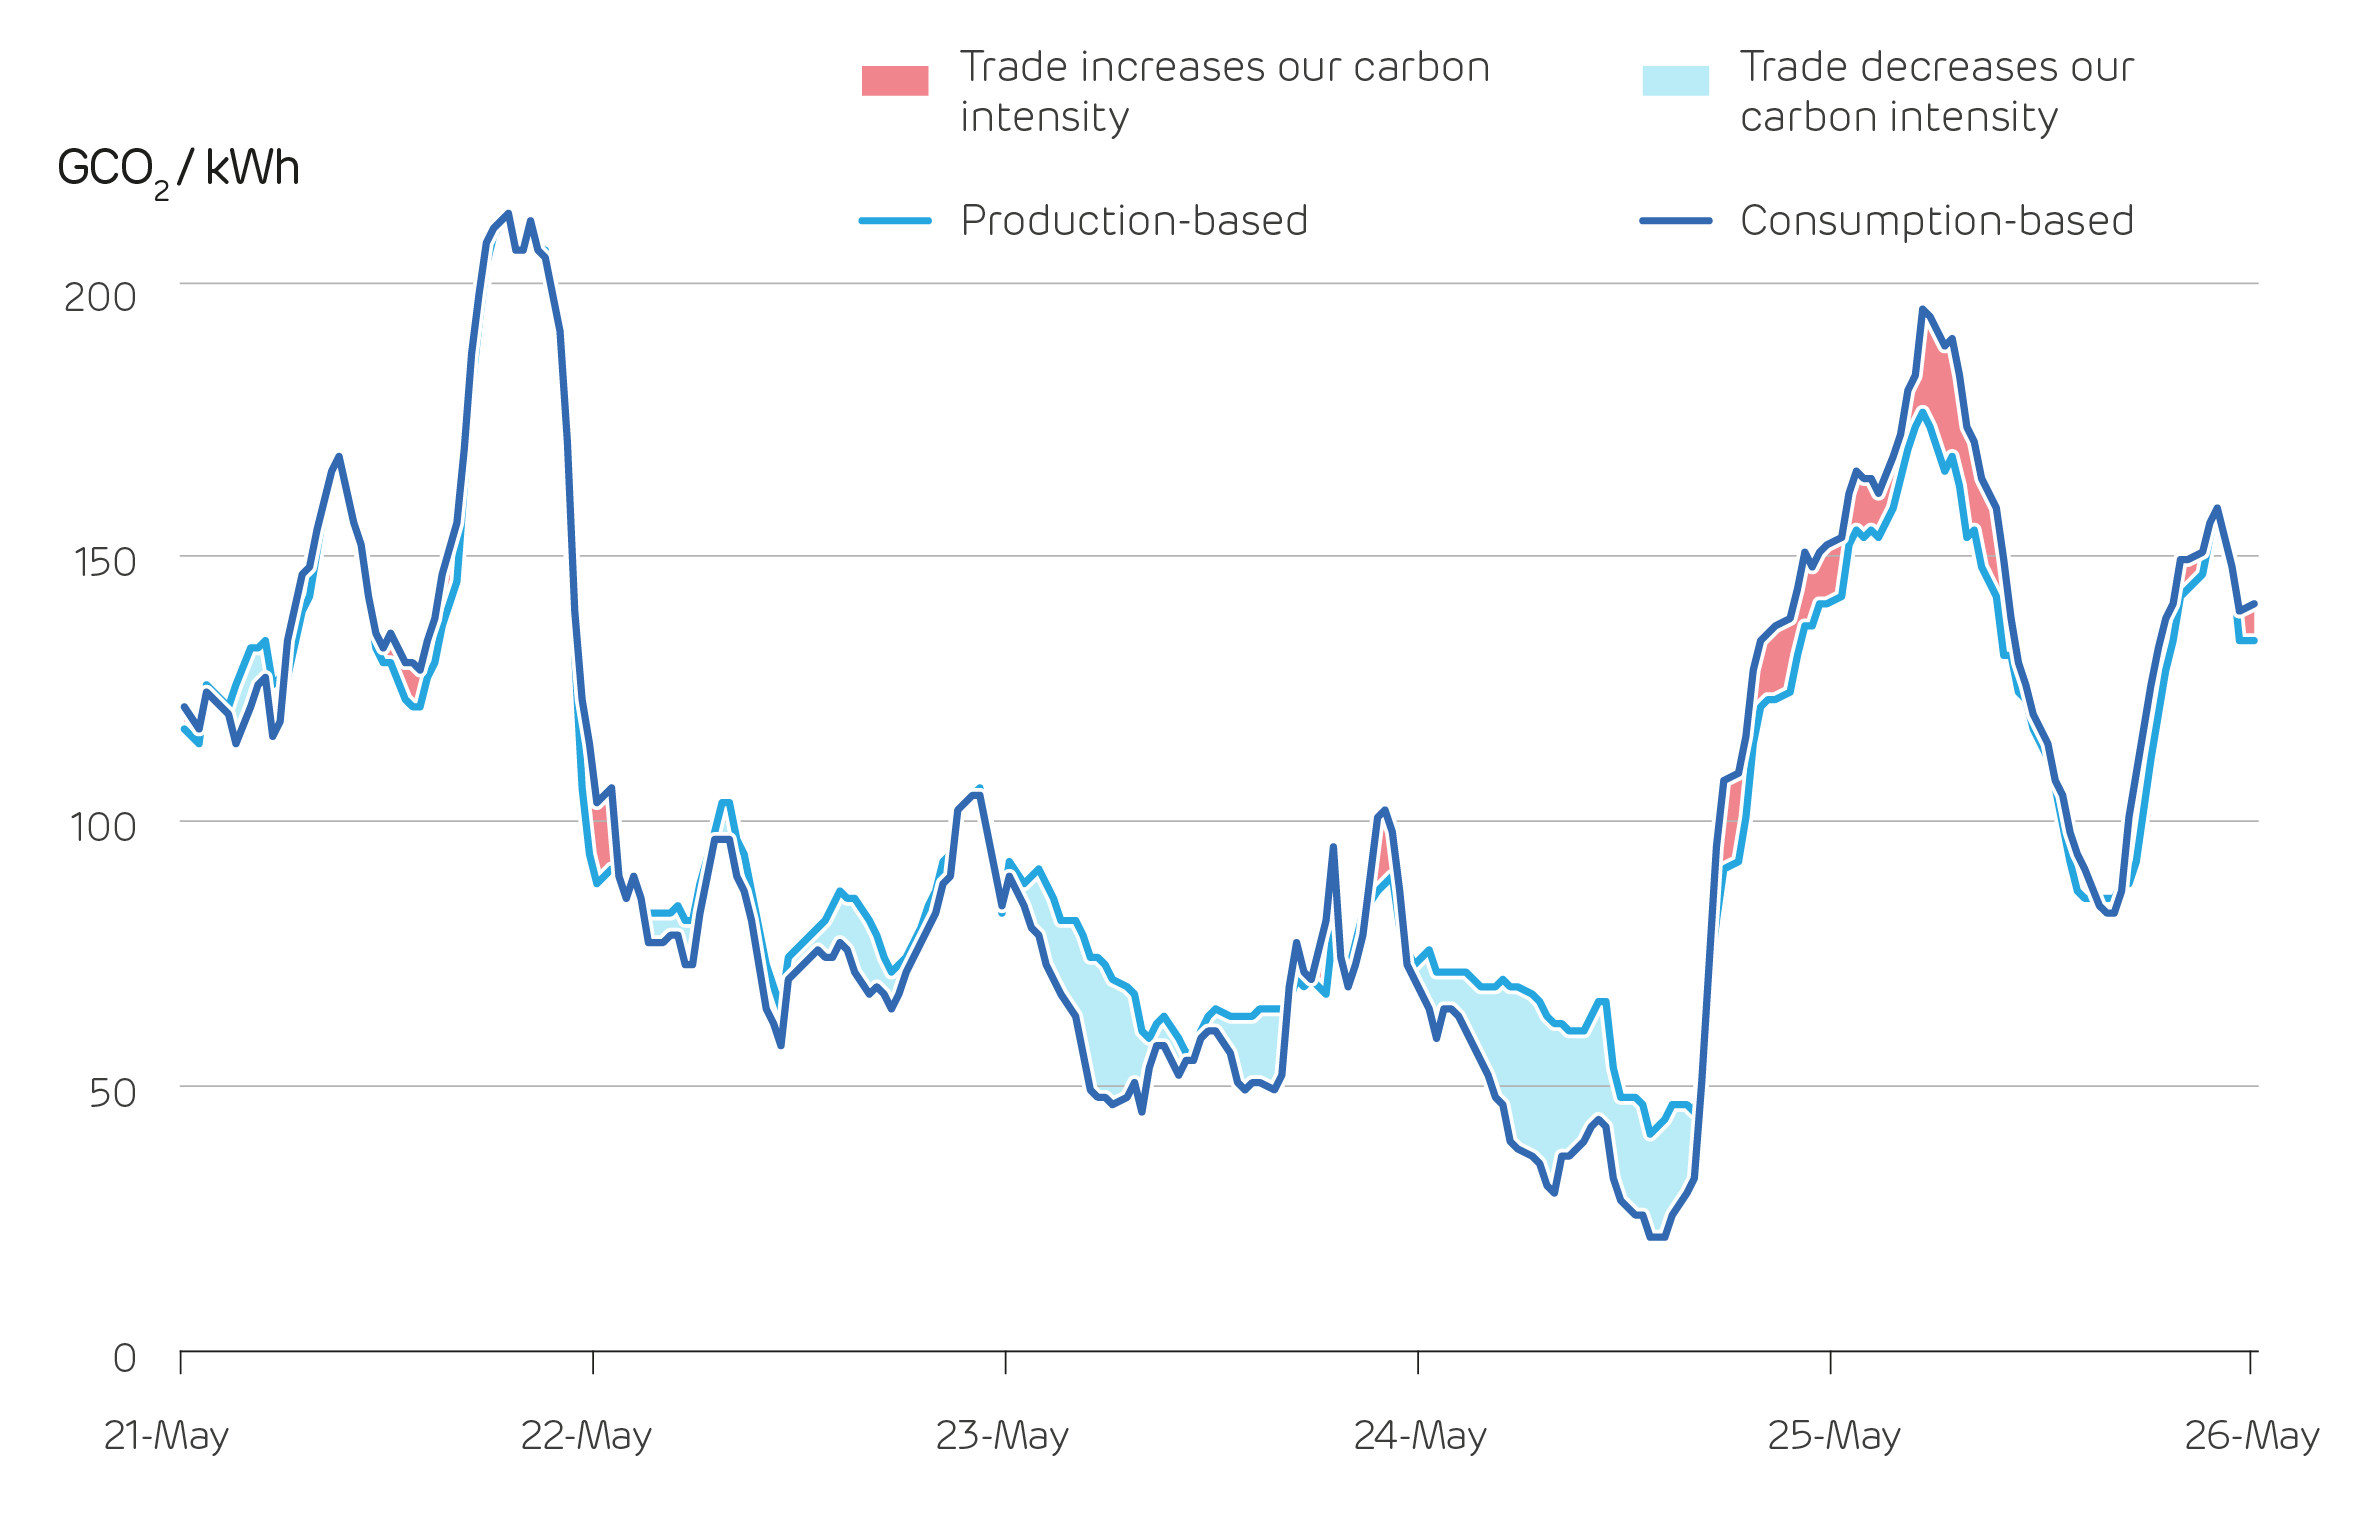
National Grid and other grid-monitoring websites reported the carbon intensity as being 46 g/kWh at that time. That was still a record low, but very different from the Electric Insights numbers. So why the discrepancy?
These sites report the carbon intensity of electricity generation, as opposed to consumption. Not all the electricity we consume is generated in Britain, and not all the electricity generated in Britain is consumed here.
Should the emissions from power stations in the Netherlands ‘count’ towards our carbon footprint, if they are generating power consumed in our homes? Earth’s atmosphere would say yes, as unlike air pollutants which affect our cities, CO2 has the same effect on global warming regardless of where it is produced.
On that Bank Holiday afternoon, Britain was importing 2 GW of electricity from France and Belgium, which are mostly powered by low-carbon nuclear. We were exporting three-quarters of this (1.5 GW) to the Netherlands and Ireland. While they do have sizeable shares of renewables, they also rely on coal power.
Britain’s exports prevented more fossil fuels from being burnt, whereas the imports did not as they came predominantly from clean sources. So, the average unit of electricity we were consuming at that point in time was cleaner than the proportion of it that was generated within our borders. We estimate that 1190 tonnes of CO2 were produced here, 165 were emitted in producing our imports, and 730 avoided through our exports.
In the long-term it does not particularly matter which of these measures gets used, as the mix of imports and exports gets averaged out. Over the whole quarter, carbon emissions would be 153g/kWh with our measure, or 151 g/kWh with production-based accounting. But, it does matter on the hourly timescale, consumption based accounting swings more widely.
Imports and exports helped make the electricity we consume lower carbon on the 24th, but the very next day they increased our carbon intensity from 176 to 196 g/kWh.
When renewable output is high in Britain we typically export the excess to our neighbours as they are willing to pay more for it, and this helps to clean their power systems. When renewables are low, Britain will import if power from Ireland and the continent is lower cost, but it may well be higher carbon.

Two measures for the carbon intensity of British electricity over the Bank Holiday weekend and surrounding days
This speaks to the wider question of decarbonising the whole economy.
Should we use production or consumption based accounting? With production (by far the most common measure), the UK is doing very well, and overall emissions are down 32% so far this century. With consumption-based accounting it’s a very different story, and they’re only down 13%*.
This is because we import more from abroad, everything from manufactured goods to food, to data when streaming music and films online.
Either option would allow us to claim we are zero carbon through accounting conventions. On the one hand (production-based accounting), Britain could be producing 100% clean power, but relying on dirty imports to meet its entire demand – that should not be classed as zero carbon as it’s pushing the problem elsewhere. On the other hand (consumption-based accounting), it would be possible to get to zero carbon emissions from electricity consumed even with unabated gas power stations running. If we got to 96% low carbon (1300 MW of gas running), we would be down at 25 g/kWh. Then if we imported fully from France and sent it to the Netherlands and Ireland, we’d get down to 0 g/kWh.
Regardless of how you measure carbon intensity, it is important to recognise that Britain’s electricity is cleaner than ever.
The hard task ahead is to make these times the norm rather than the exception, by continuing to expand renewable generation, preparing the grid for their integration, and introducing negative emissions technologies such as BECCS (bioenergy with carbon capture and storage).
Read full Report (PDF) | Read full Report | Read press release


