Late into the evening of Christmas Day, 2016, millions of people sat down to watch Rowan Atkinson solve a grisly murder. It was the TV drama Maigret’s Dead Man, and although it wasn’t the most watched TV show on Christmas Day (that honour went to the Strictly Come Dancing finale), it did cause the biggest television-related sudden surge in electricity demand of the day, says Sumit Gumber, Energy Forecasting Analyst at National Grid.
During a critical ad break in the show, demand jumped 400 MW – roughly equivalent to 160,000 kettles being switched on – as viewers raced to make cups of tea or go to the bathroom. This is known as a TV pickup.
While this may have provided the biggest sudden rise in electricity usage of the day, it was not the overall peak. As is typical on Christmas Day, this year’s spike in demand came just before one o’clock, when families were preparing their festive feasts.
At 37.1 GW, this peak was not only lower than previous years, the power used to supply it was generated by more renewables than any Christmas before it. More than 40% of the electricity generated on Christmas Day came from renewable sources.
What characterises Christmas day?
Christmas is a day when electricity usage is at one of its lowest points. To put this year’s 37.1 GW peak into context, an average weekday during December (weekday electricity use is higher than on weekends) has an electricity peak of nearly 50 GW, usually occurring between five and seven o’clock, when people arrive home and street lighting is switched on.
The cause for the lower demand during Christmas is simple – over the festive period schools, as well as a number of offices, shops and factories are closed.
Over the last few years average Christmas Day demand has been fairly typical, sitting in a bracket of between 29 GW and 39 GW. In 2010, however, extreme cold (hitting minus three degrees Celsius) drove lunchtime peak demand as high as 46 GW, showing just how important a driver of our electricity use temperature is.
But while demand on Christmas in 2016 may not have deviated largely from the average over the last few years, there were some major leaps forward in how it was generated.
A greener Christmas than ever before
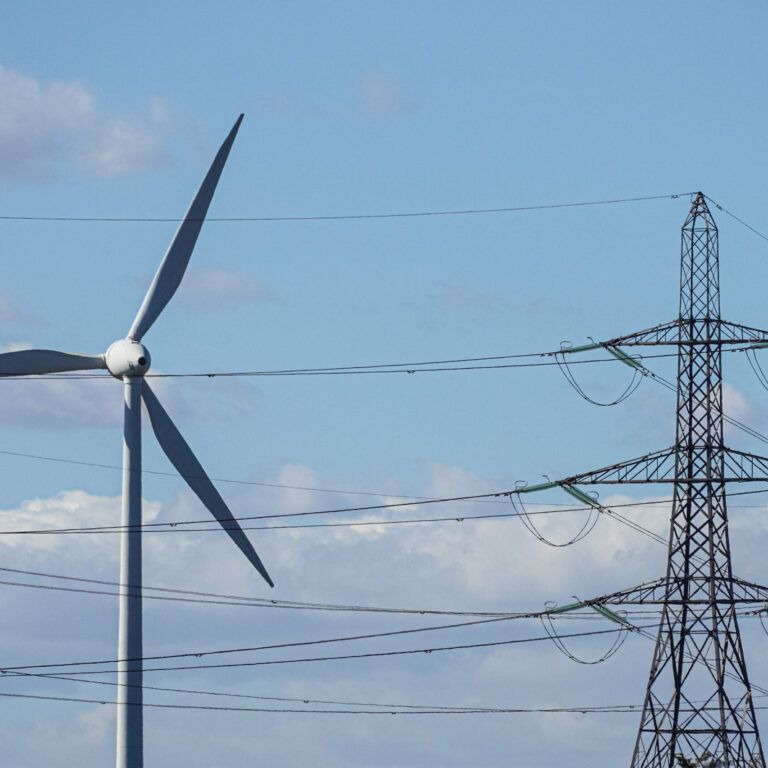
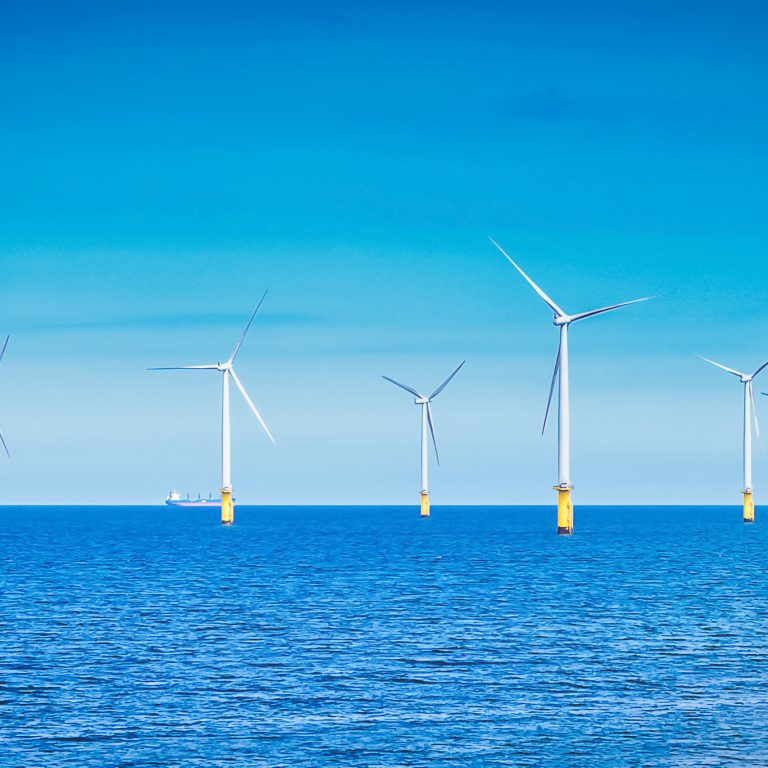
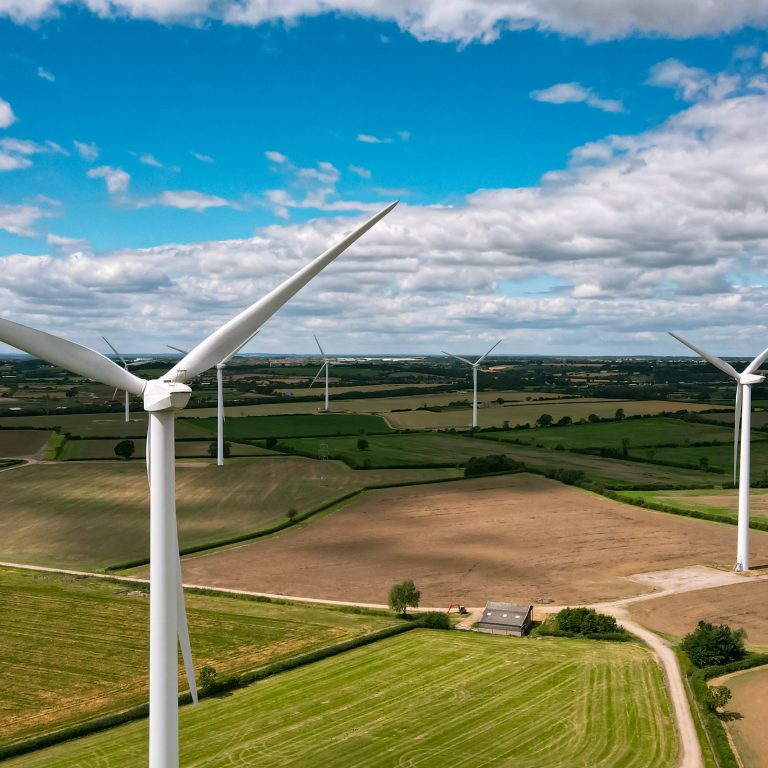
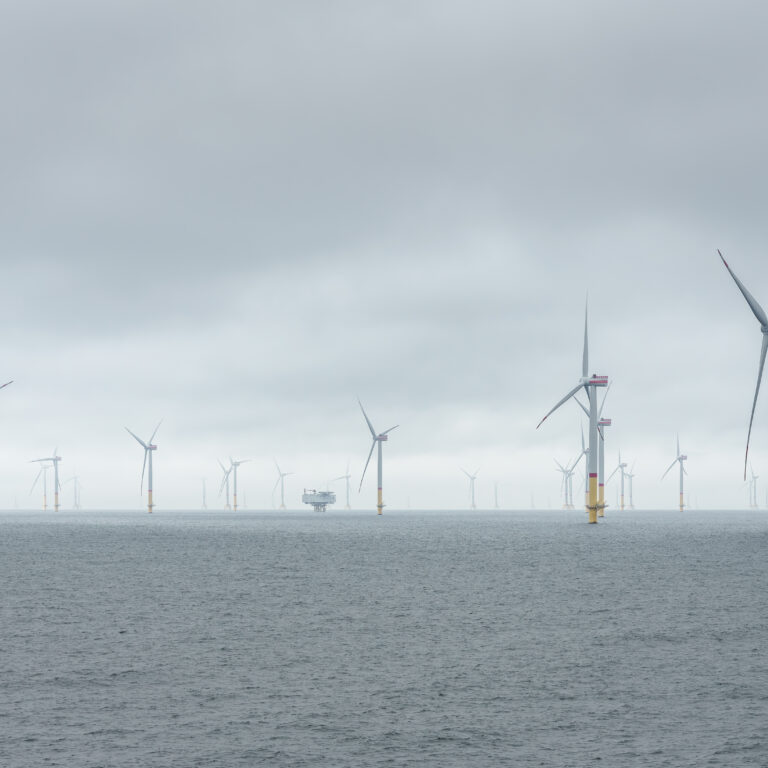
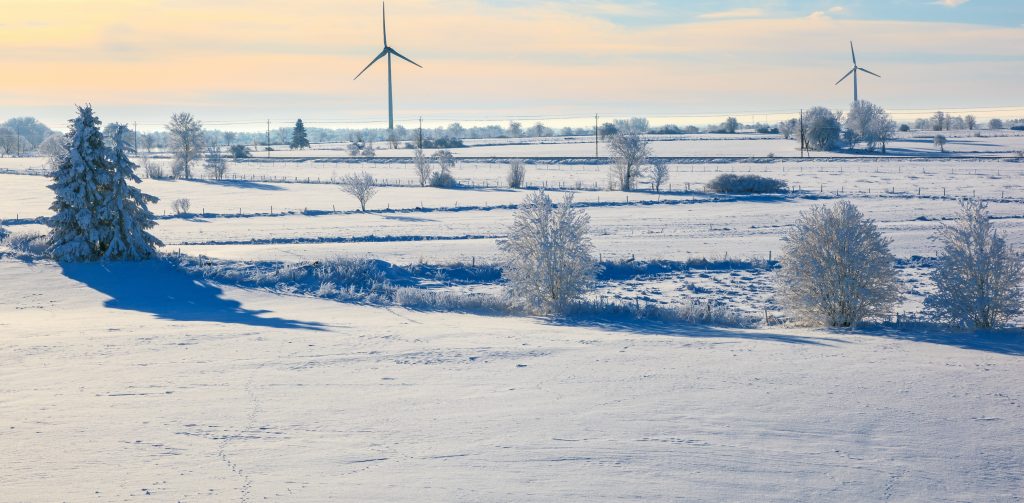
This year, Christmas was characterised by a huge jump in renewable electricity generation. On average, 12.4 GW came from renewable sources – more than ever before. Of that figure, wind contributed the most, generating on average 9.4 GW – equivalent to 31% of all power supplied on Christmas Day.
Compared to 2015 it’s a 63% increase and a staggering 195% uplift from five Christmases ago in 2012 when just 12% of all electricity generated came from renewable sources. Biomass generation has also increased, providing 2 GW in 2016 compared to the 0.5 GW it averaged on December 25th, 2012.
The increase in renewables also marks an important step towards decarbonisation: at its peak, emissions from electricity generation this 25th December were just 168 g/kWh, a significant drop compared to the 2012 peak of 506 g/kWh and the 303 g/kWh seen in 2015.
This year has been a year of impressive stats in clean energy: between July and September, for the first time in its 130-year-old history, more than half of Britain’s power came from low-carbon sources; on 5th May the UK did not burn any coal to generate electricity, the first time since 1881. Now, we’ve seen one of the cleanest Christmases on record. It’s a Christmas tradition that is likely to continue.
Biggest TV pick-ups, Christmas Day 2016
-
Maigret’s Dead Man and EastEnders (22:30) – 400 MW (equivalent to 160,000 2.5 kW kettles switched on)
-
Paul O’Grady: For the Love of Dogs at Christmas (19:45) – 275 MW (110,000 kettles)
-
The Great Christmas Bake Off (17:45) – 210 MW (84,000 kettles)
-
Emmerdale and Doctor Who (18:45) – 200 MW (80,000 kettles)
Thanks to National Grid for this data
Explore how Britain was powered over the festive period by visiting electricinsights.co.uk.


