Estonia is a heavily forested country with a mature forest resource that has been neglected over many years due to political and ownership changes. Management of state and corporate owned forests is now good, but some small privately-owned areas of forest are still poorly managed.
Despite this, both the forest area and the growing stock have been increasing, largely due to new planting and the maturing age class of existing forest.
Forest area has increased from 49% to 52% of the total land, increasing by more than 118 thousand hectares since 2010.
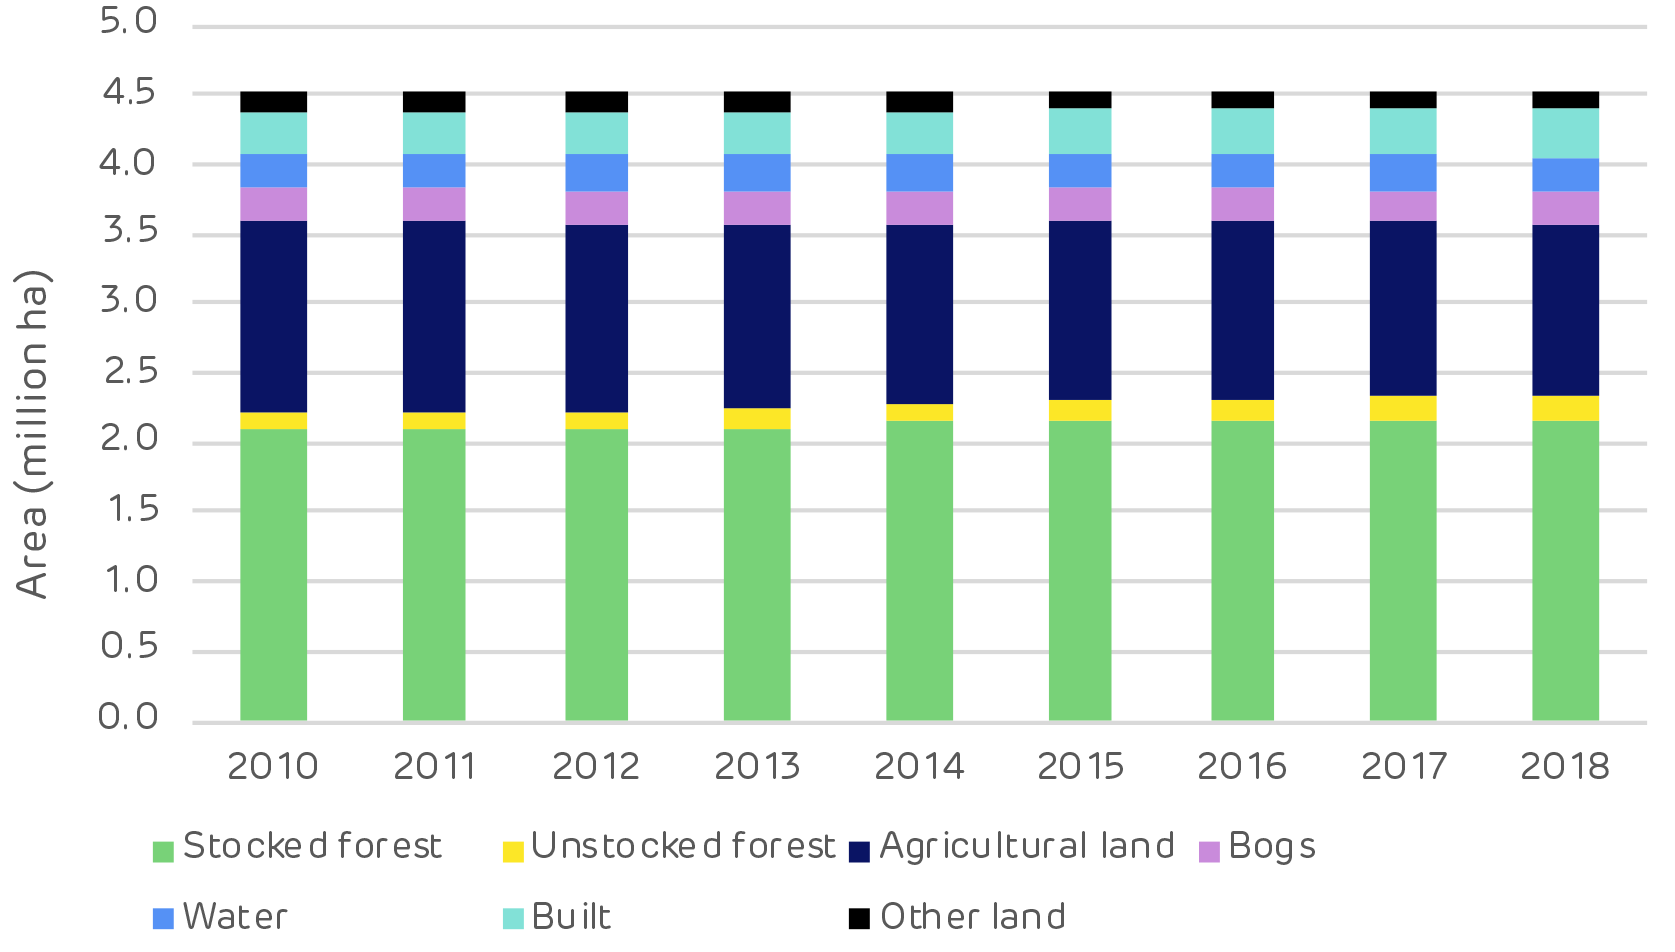
Land use in Estonia [click to view/download]
Change in forest growing stock – Estonia [click to view/download]
Since 2008, harvesting and management has increased. Private and corporate forest owners have been harvesting forest that had been mature and ready for clear felling. The longer-term harvesting trend has been considerably lower than annual growth (increment) and the maximum sustainable harvesting level, as shown on the chart below.
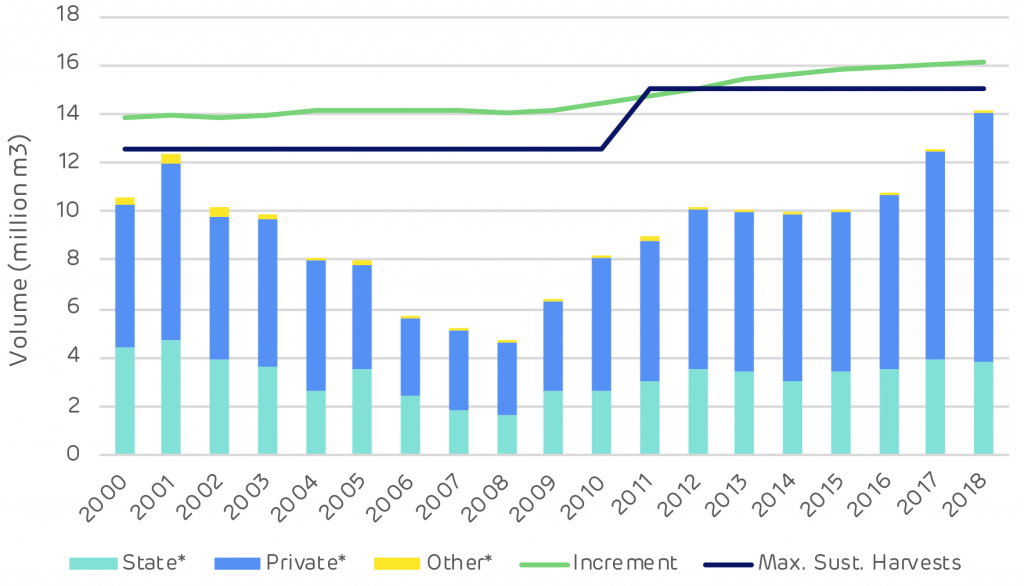
Annual increment and harvesting levels [click to view/download]
-
-
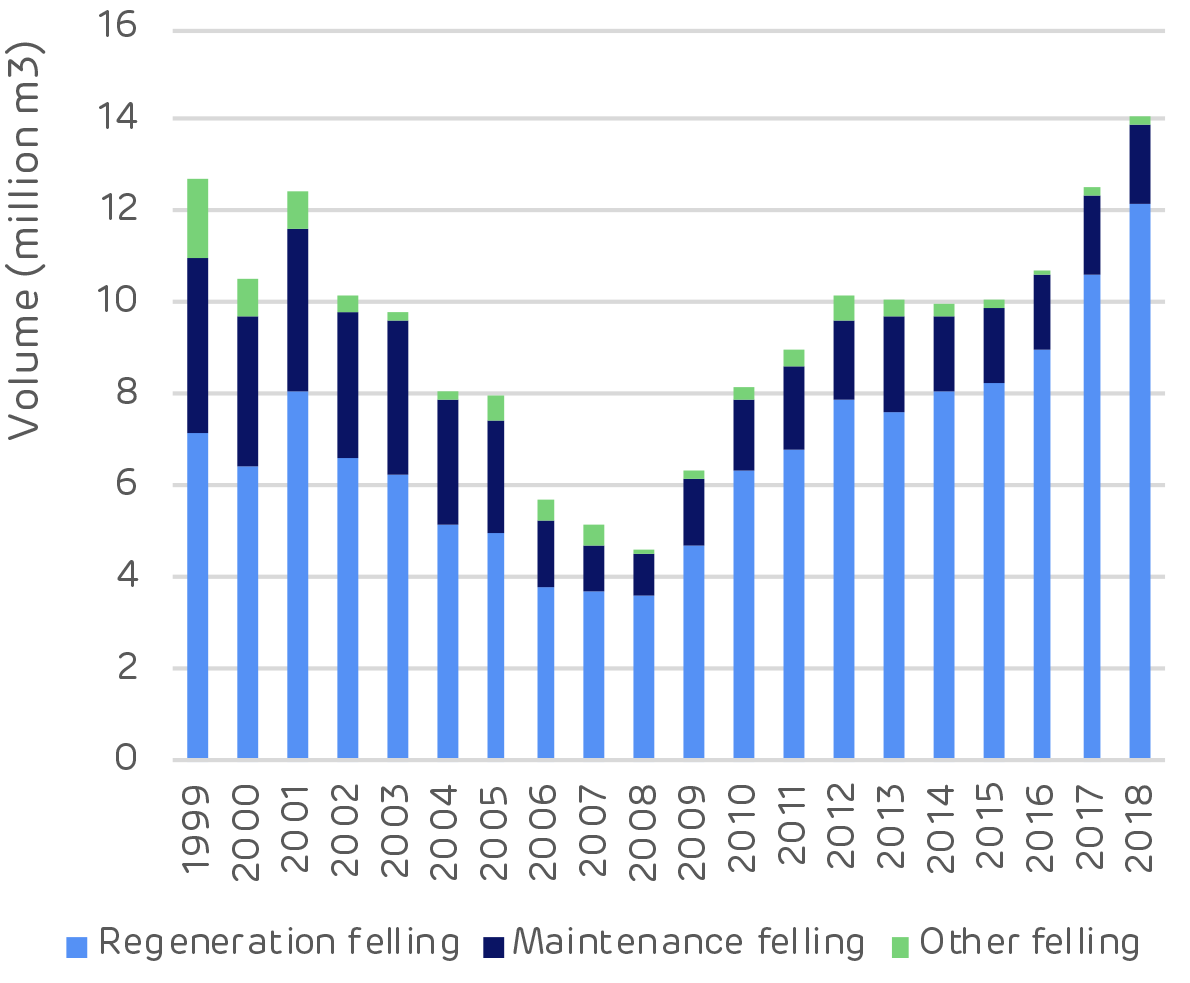
Harvesting type by volume [click to view/download]
-
-
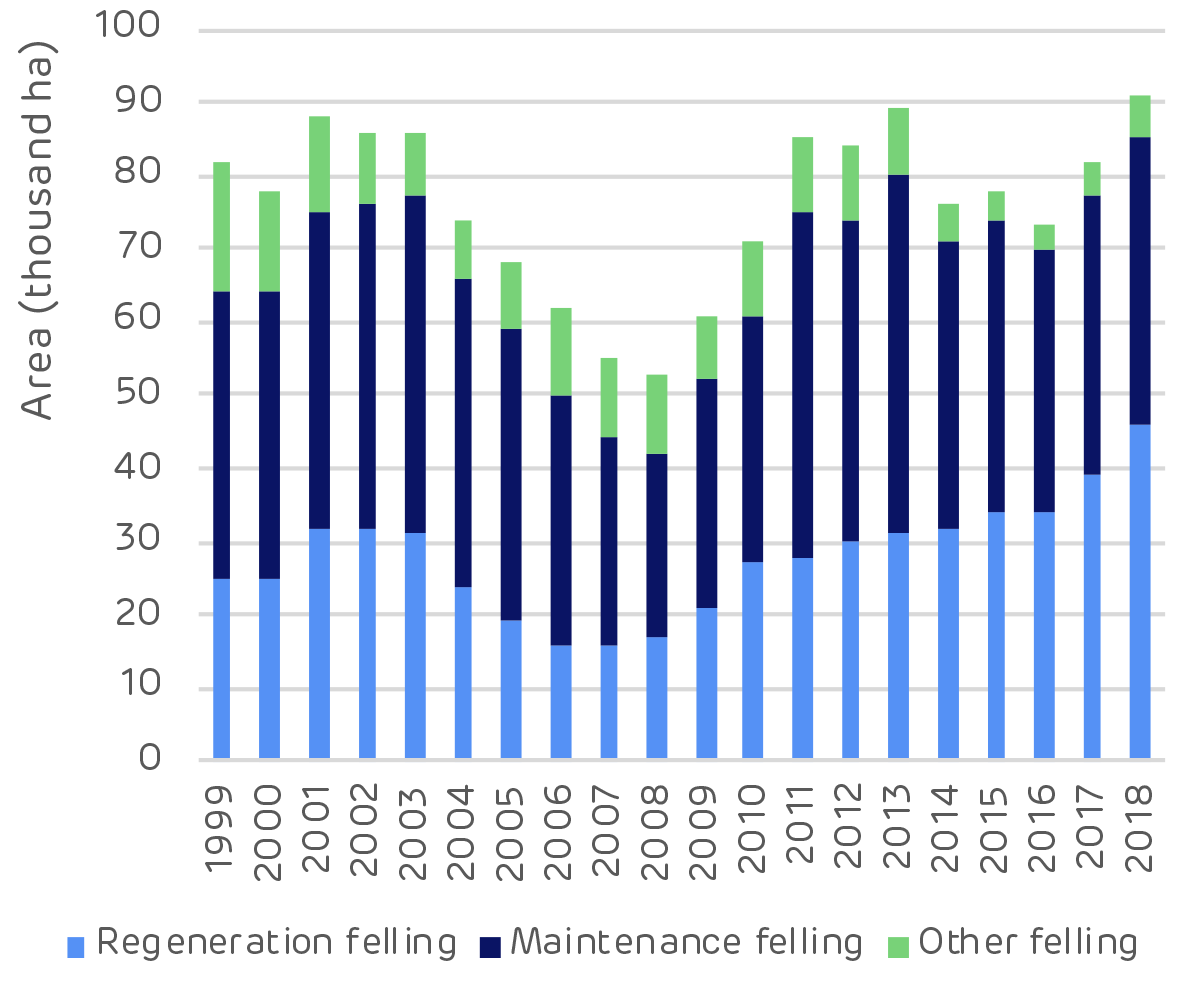
Harvesting type by area [click to view/download]
Clear cutting (regeneration felling) is the largest operation by volume but thinning (maintenance felling) is the largest by area.
This indicates a forest landscape in balance, with widespread thinning to produce more sawlog trees and a large volume of clear cuts in the mature stands to make way for the next generation of forests.
![Reforestation in Estonia. * Note: Since 2014 it has not been compulsory for private and other forest owners to submit reforestation data. [Click to view/download]](https://www.drax.com/uk/wp-content/uploads/sites/8/2020/03/figure_3.13-1024x590.png)
Reforestation in Estonia. * Note: Since 2014 it has not been compulsory for private and other forest owners to submit reforestation data. [Click to view/download]
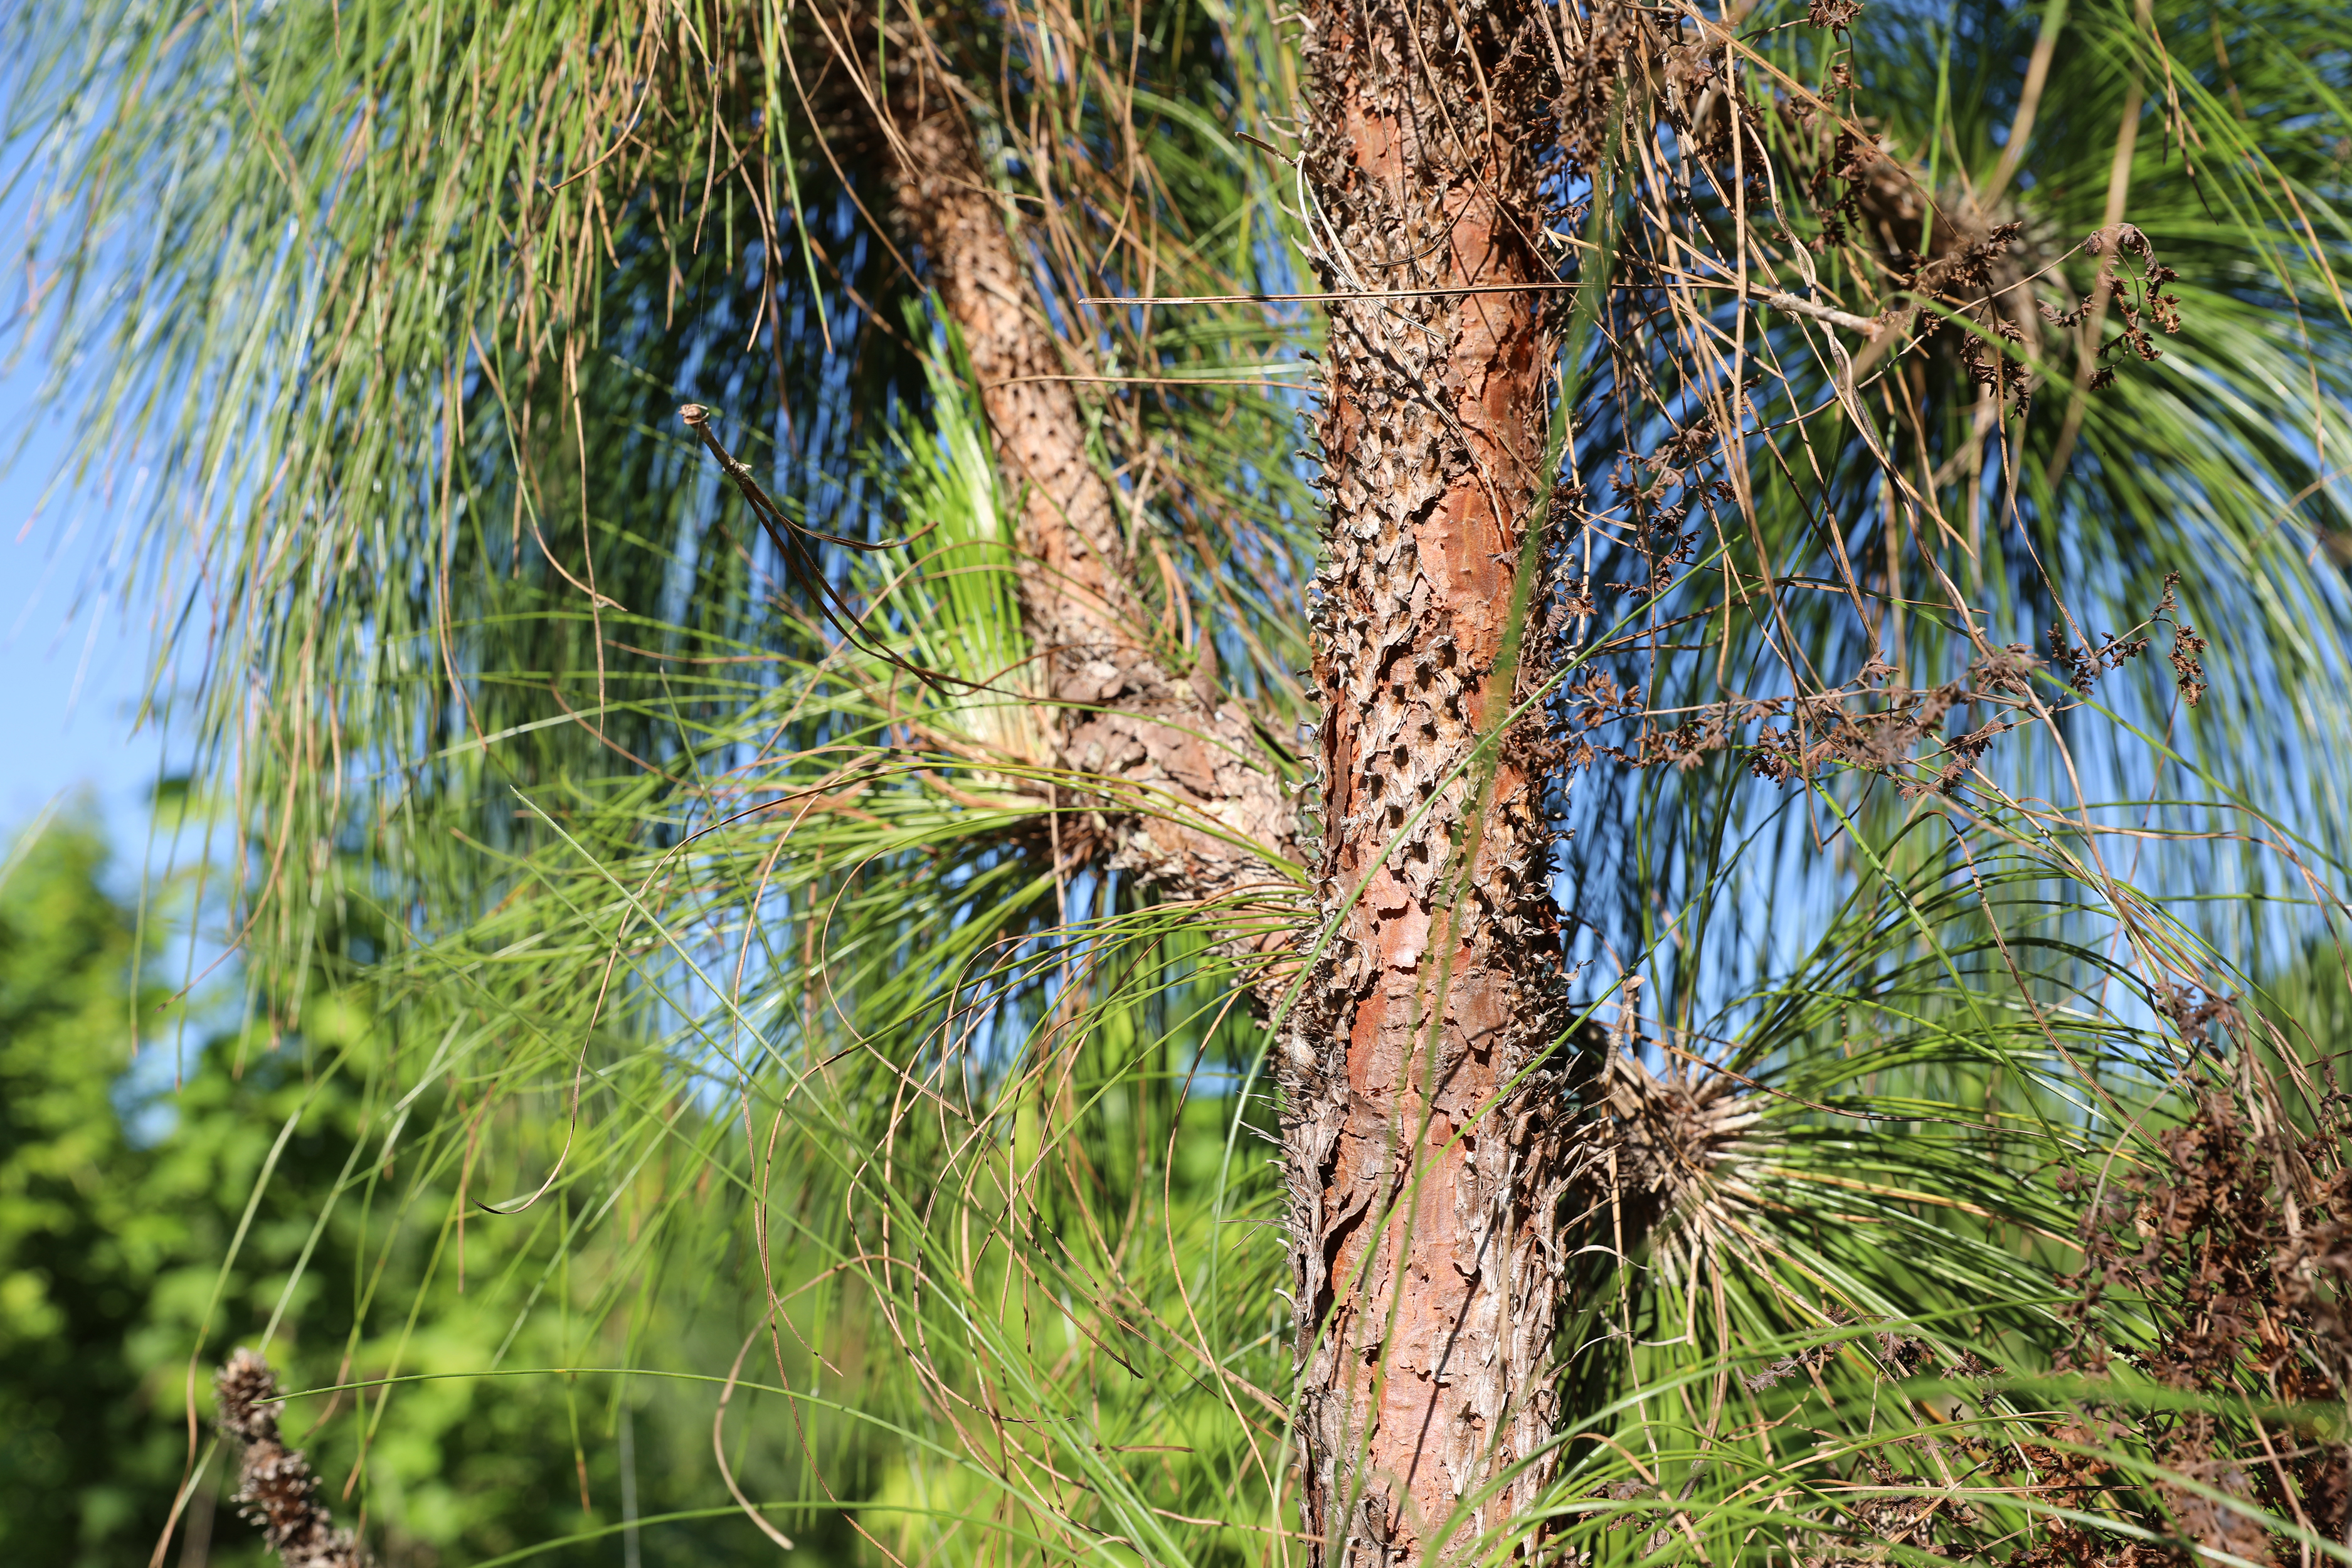
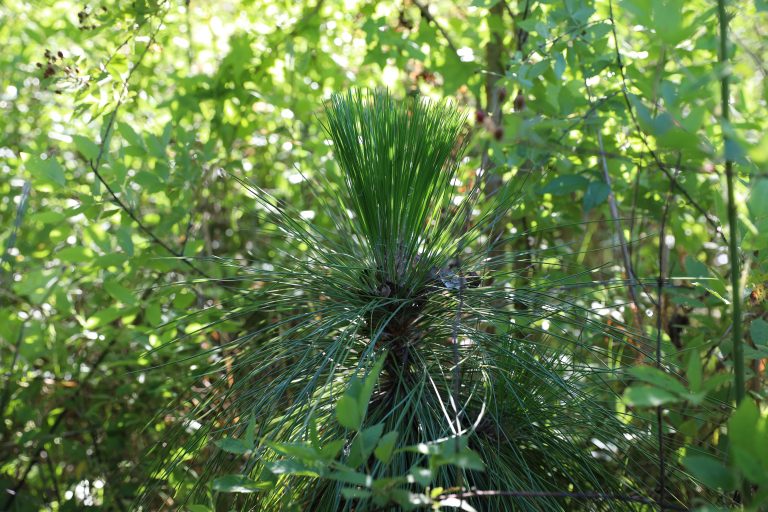
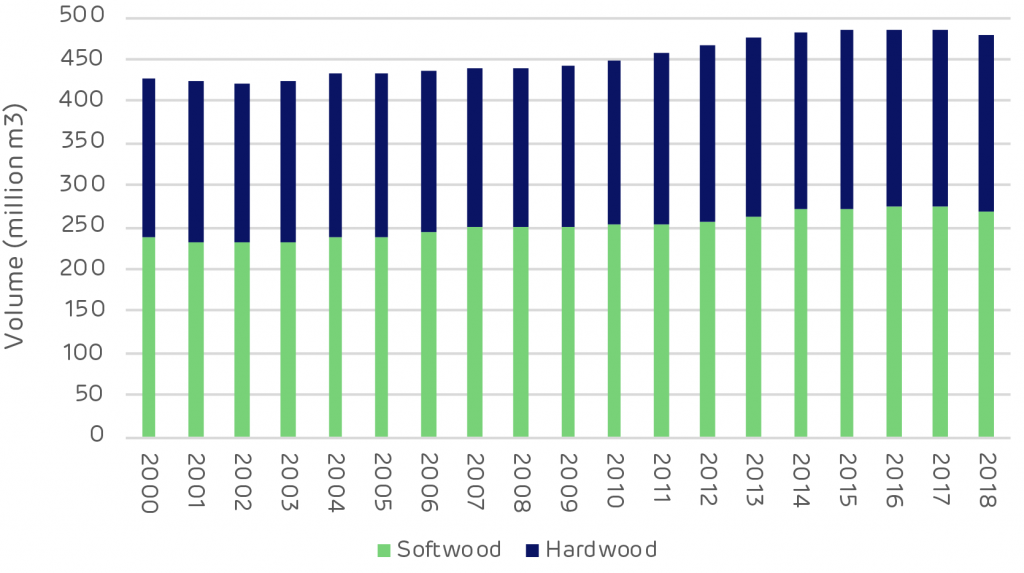
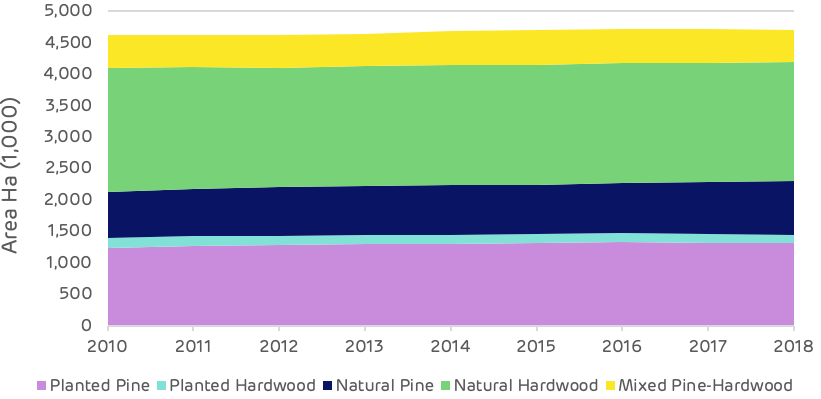
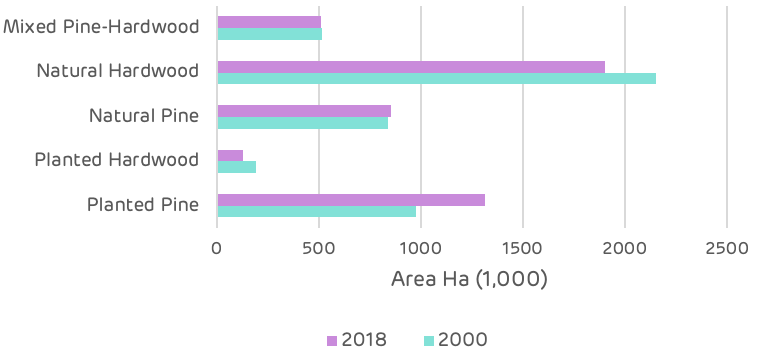
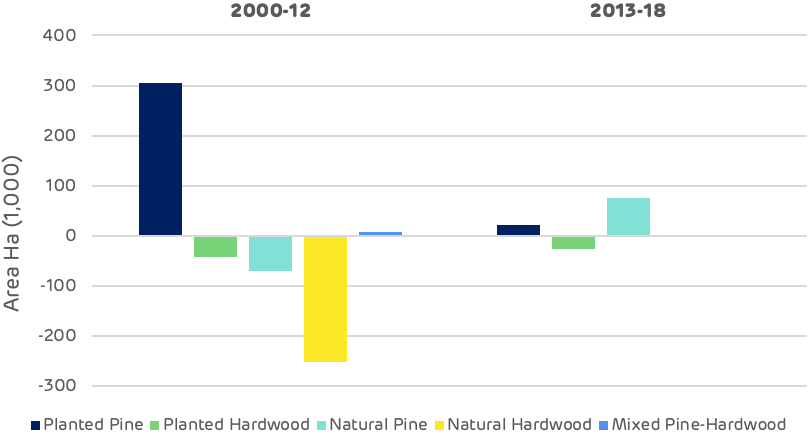
![Species mix in Estonian forests [Click to view/download]](https://www.drax.com/uk/wp-content/uploads/sites/8/2020/03/figure_3.3.png)
Species mix in Estonian forests [Click to view/download]
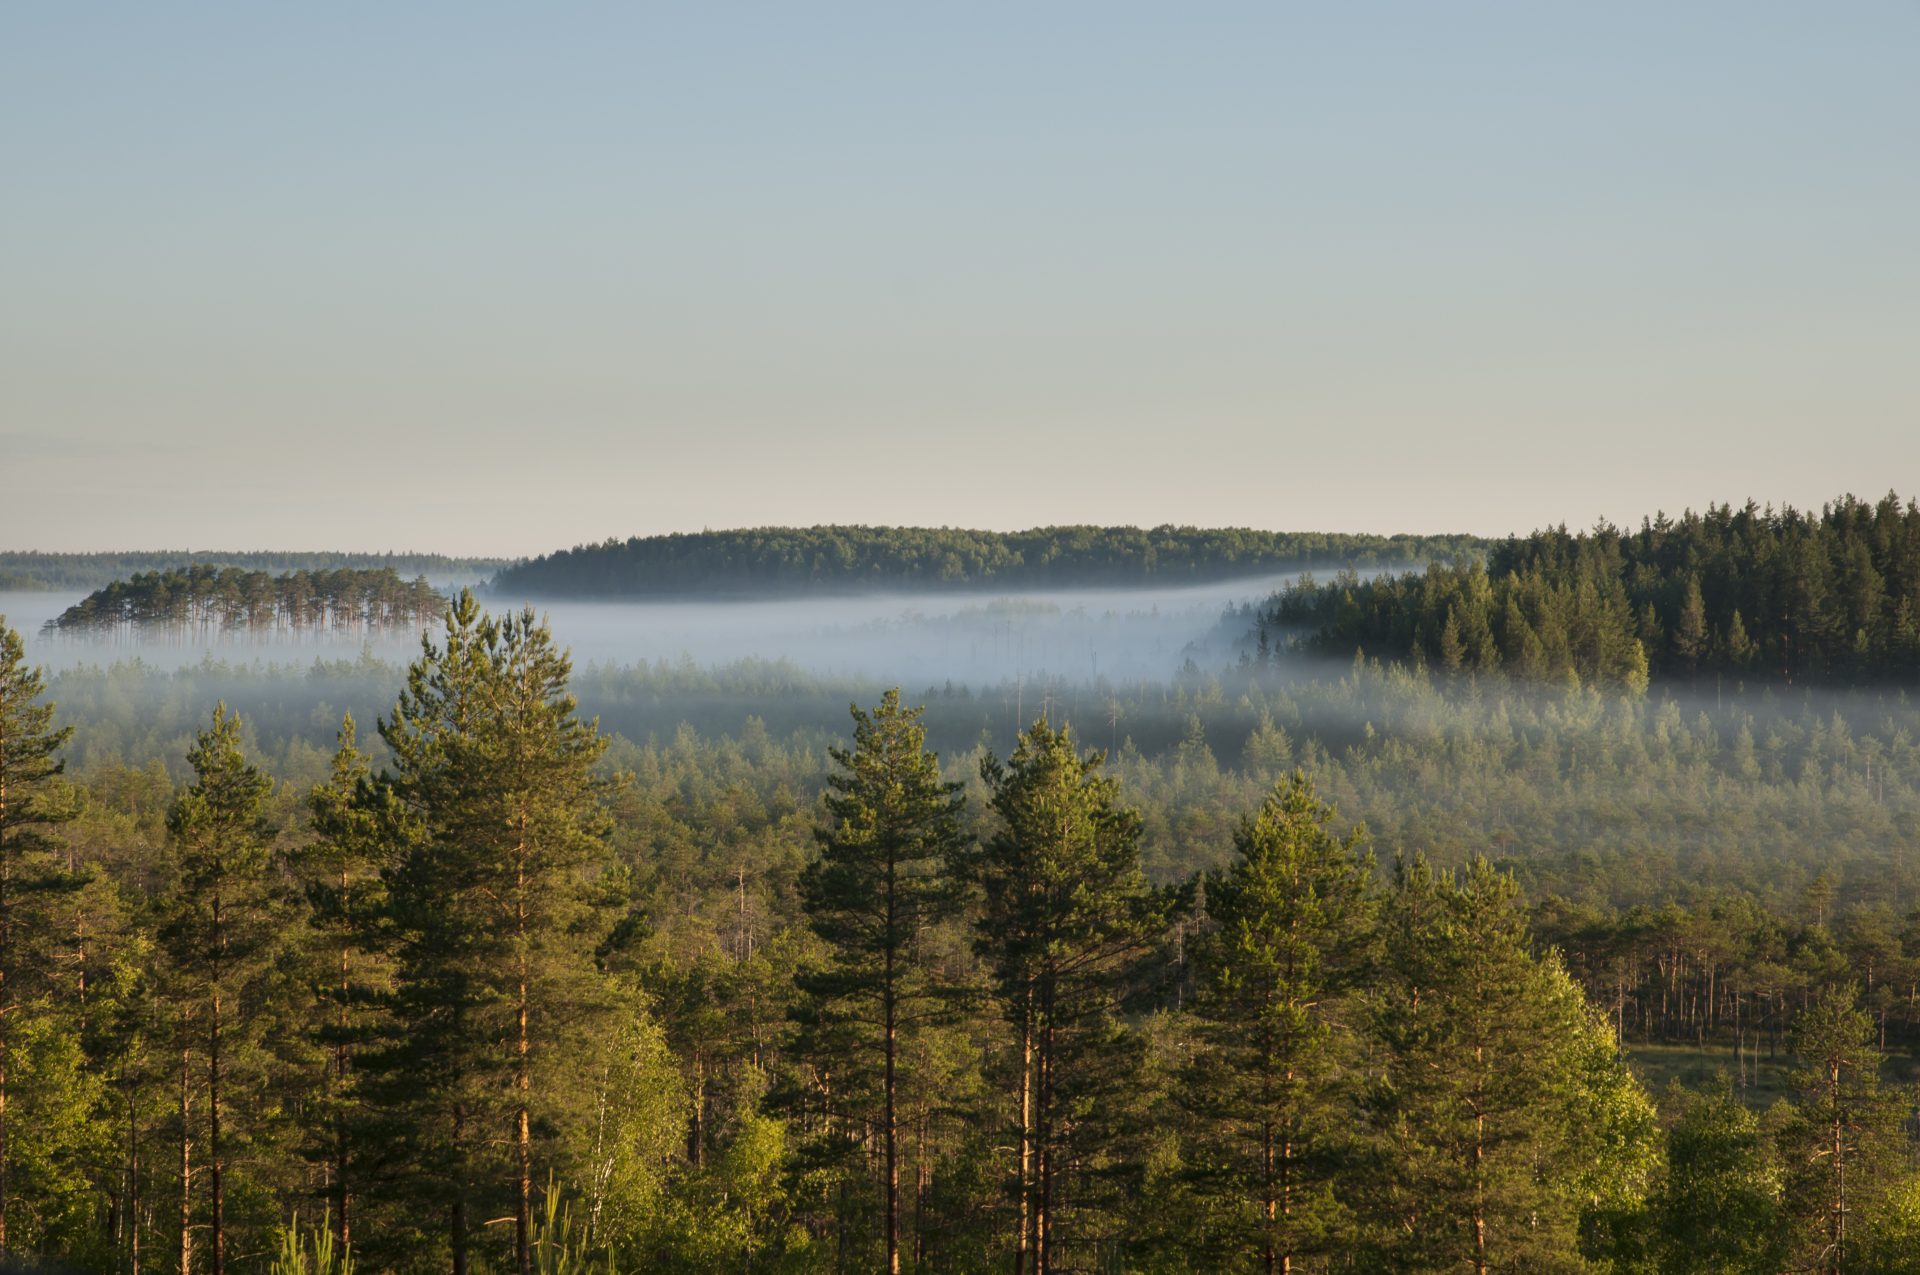
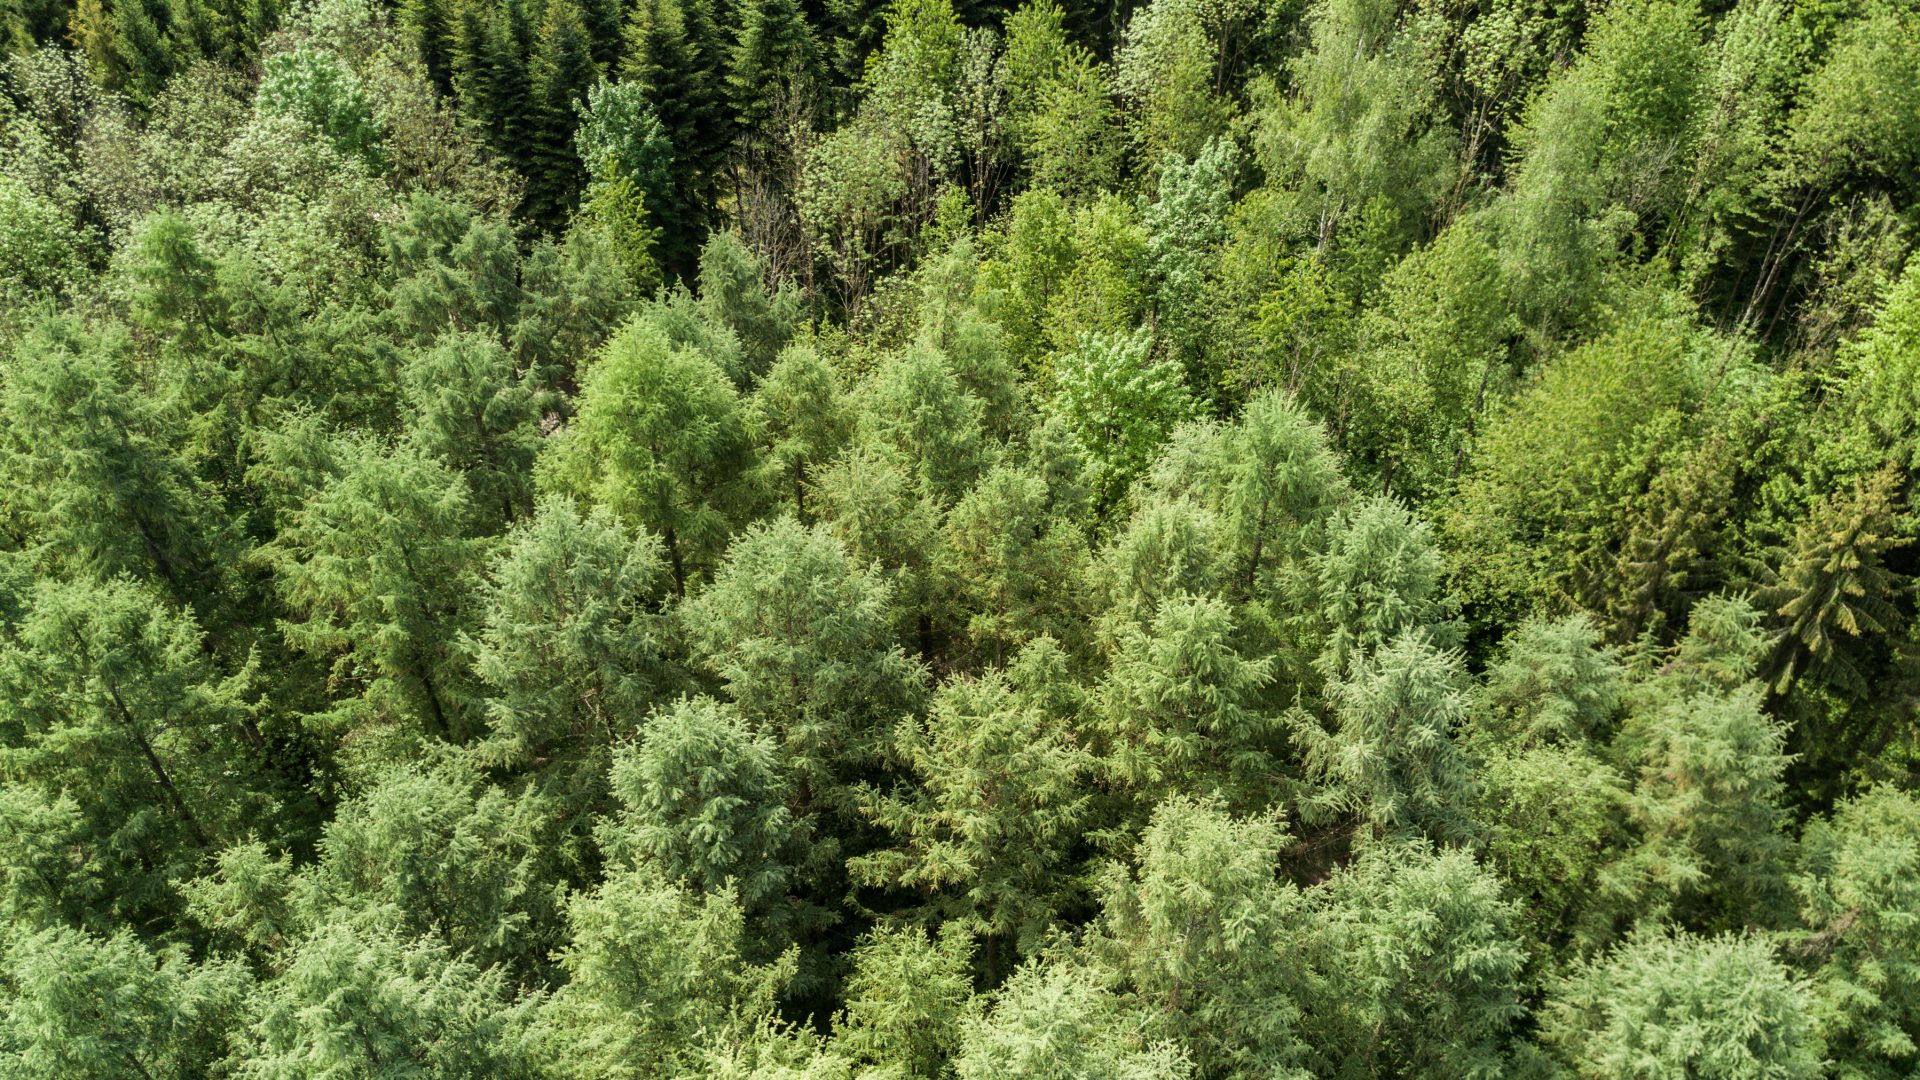
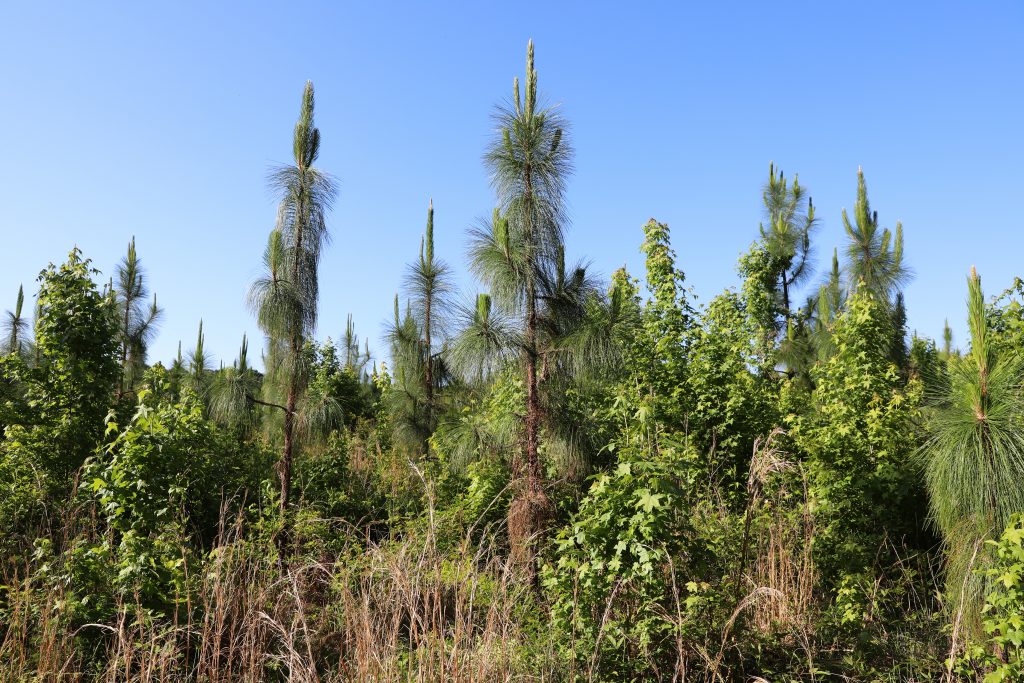
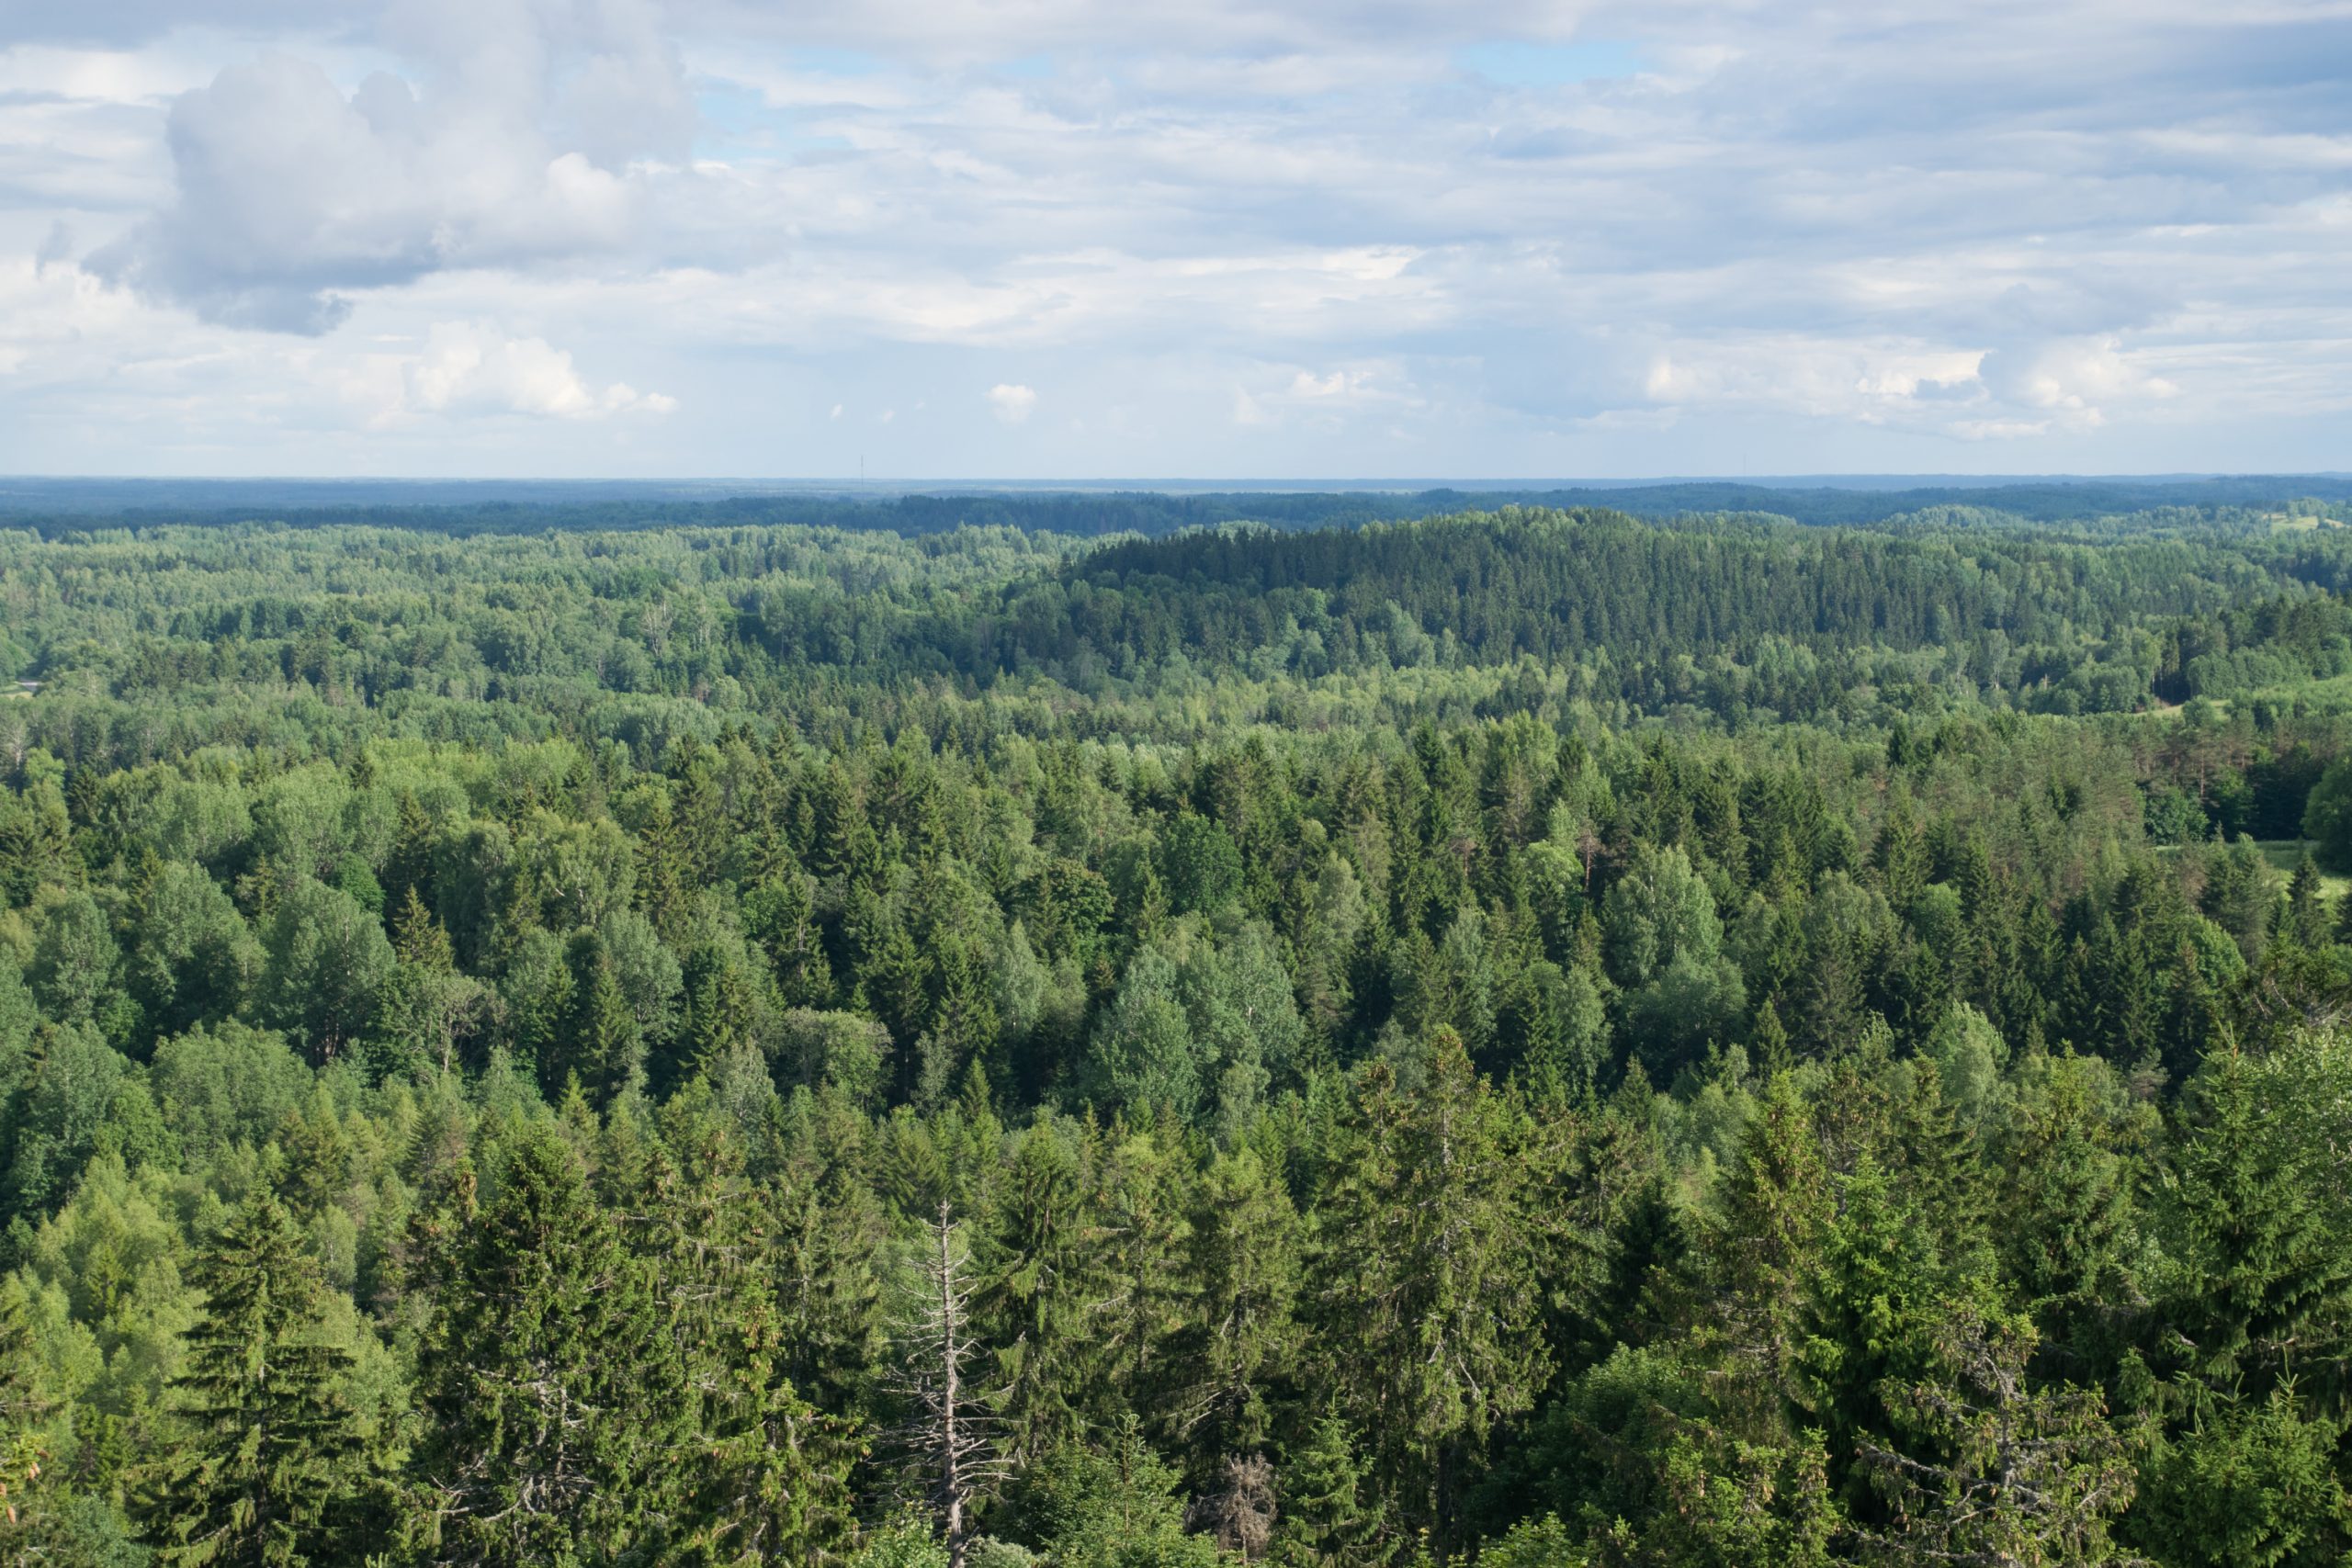
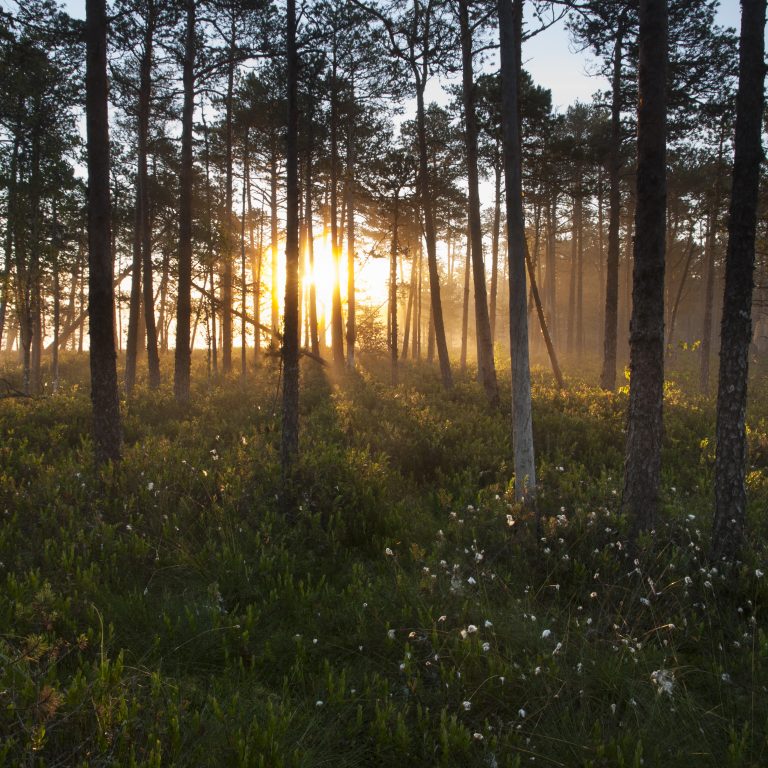
Sunrise and fog over forest landscape in Estonia
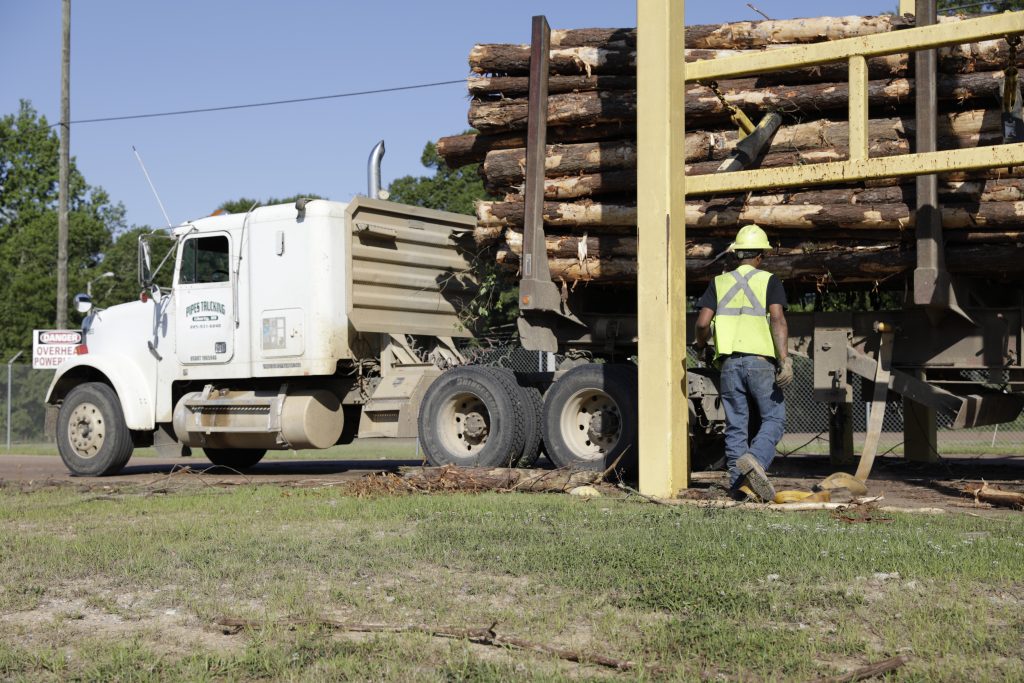
Pulpwood markets are limited in Estonia and this material has been historically exported to neighbouring Finland and Sweden. Export demand has had a significant impact on prices as can be seen in a spike in 2018 when demand was at its strongest.
The forest industry has been dominated by sawmills and panel board mills. Demand and production in this sector has been increasing and this has kept prices high. There is a substantial differential between sawlog and pulpwood pricing.
![Comparison of sawlog and pulpwood prices [click to view/download]](https://www.drax.com/uk/wp-content/uploads/sites/8/2020/03/Picture-1.pdf2_-1.png)
Comparison of sawlog and pulpwood prices [click to view/download]
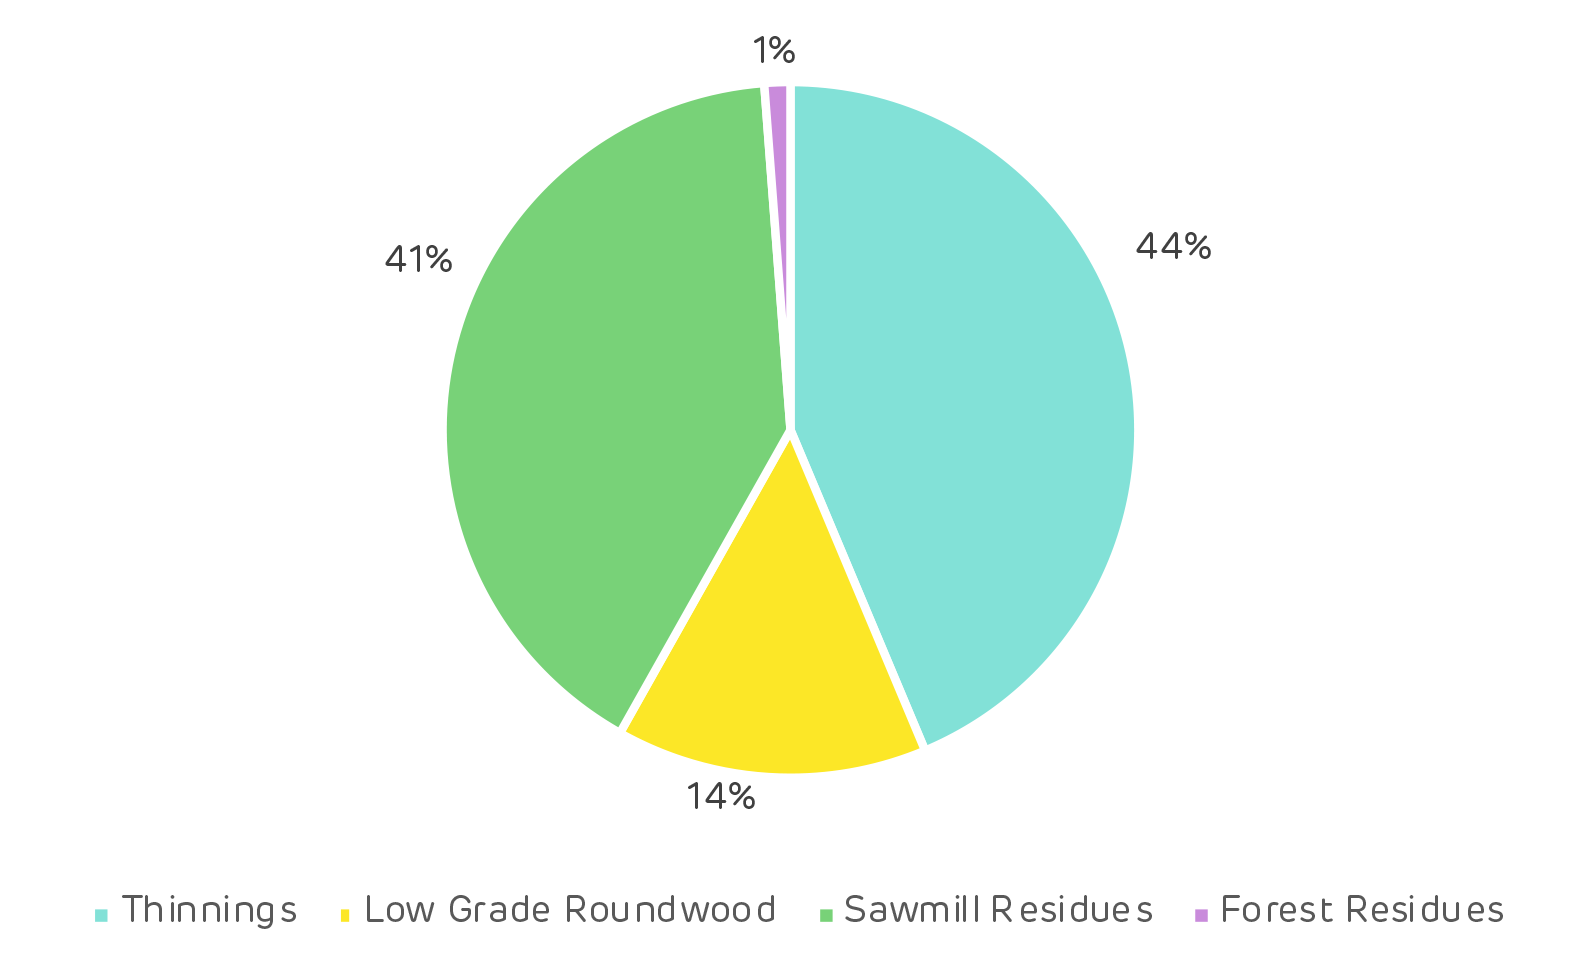
Drax feedstocks from Estonia 2018 [click to view download]
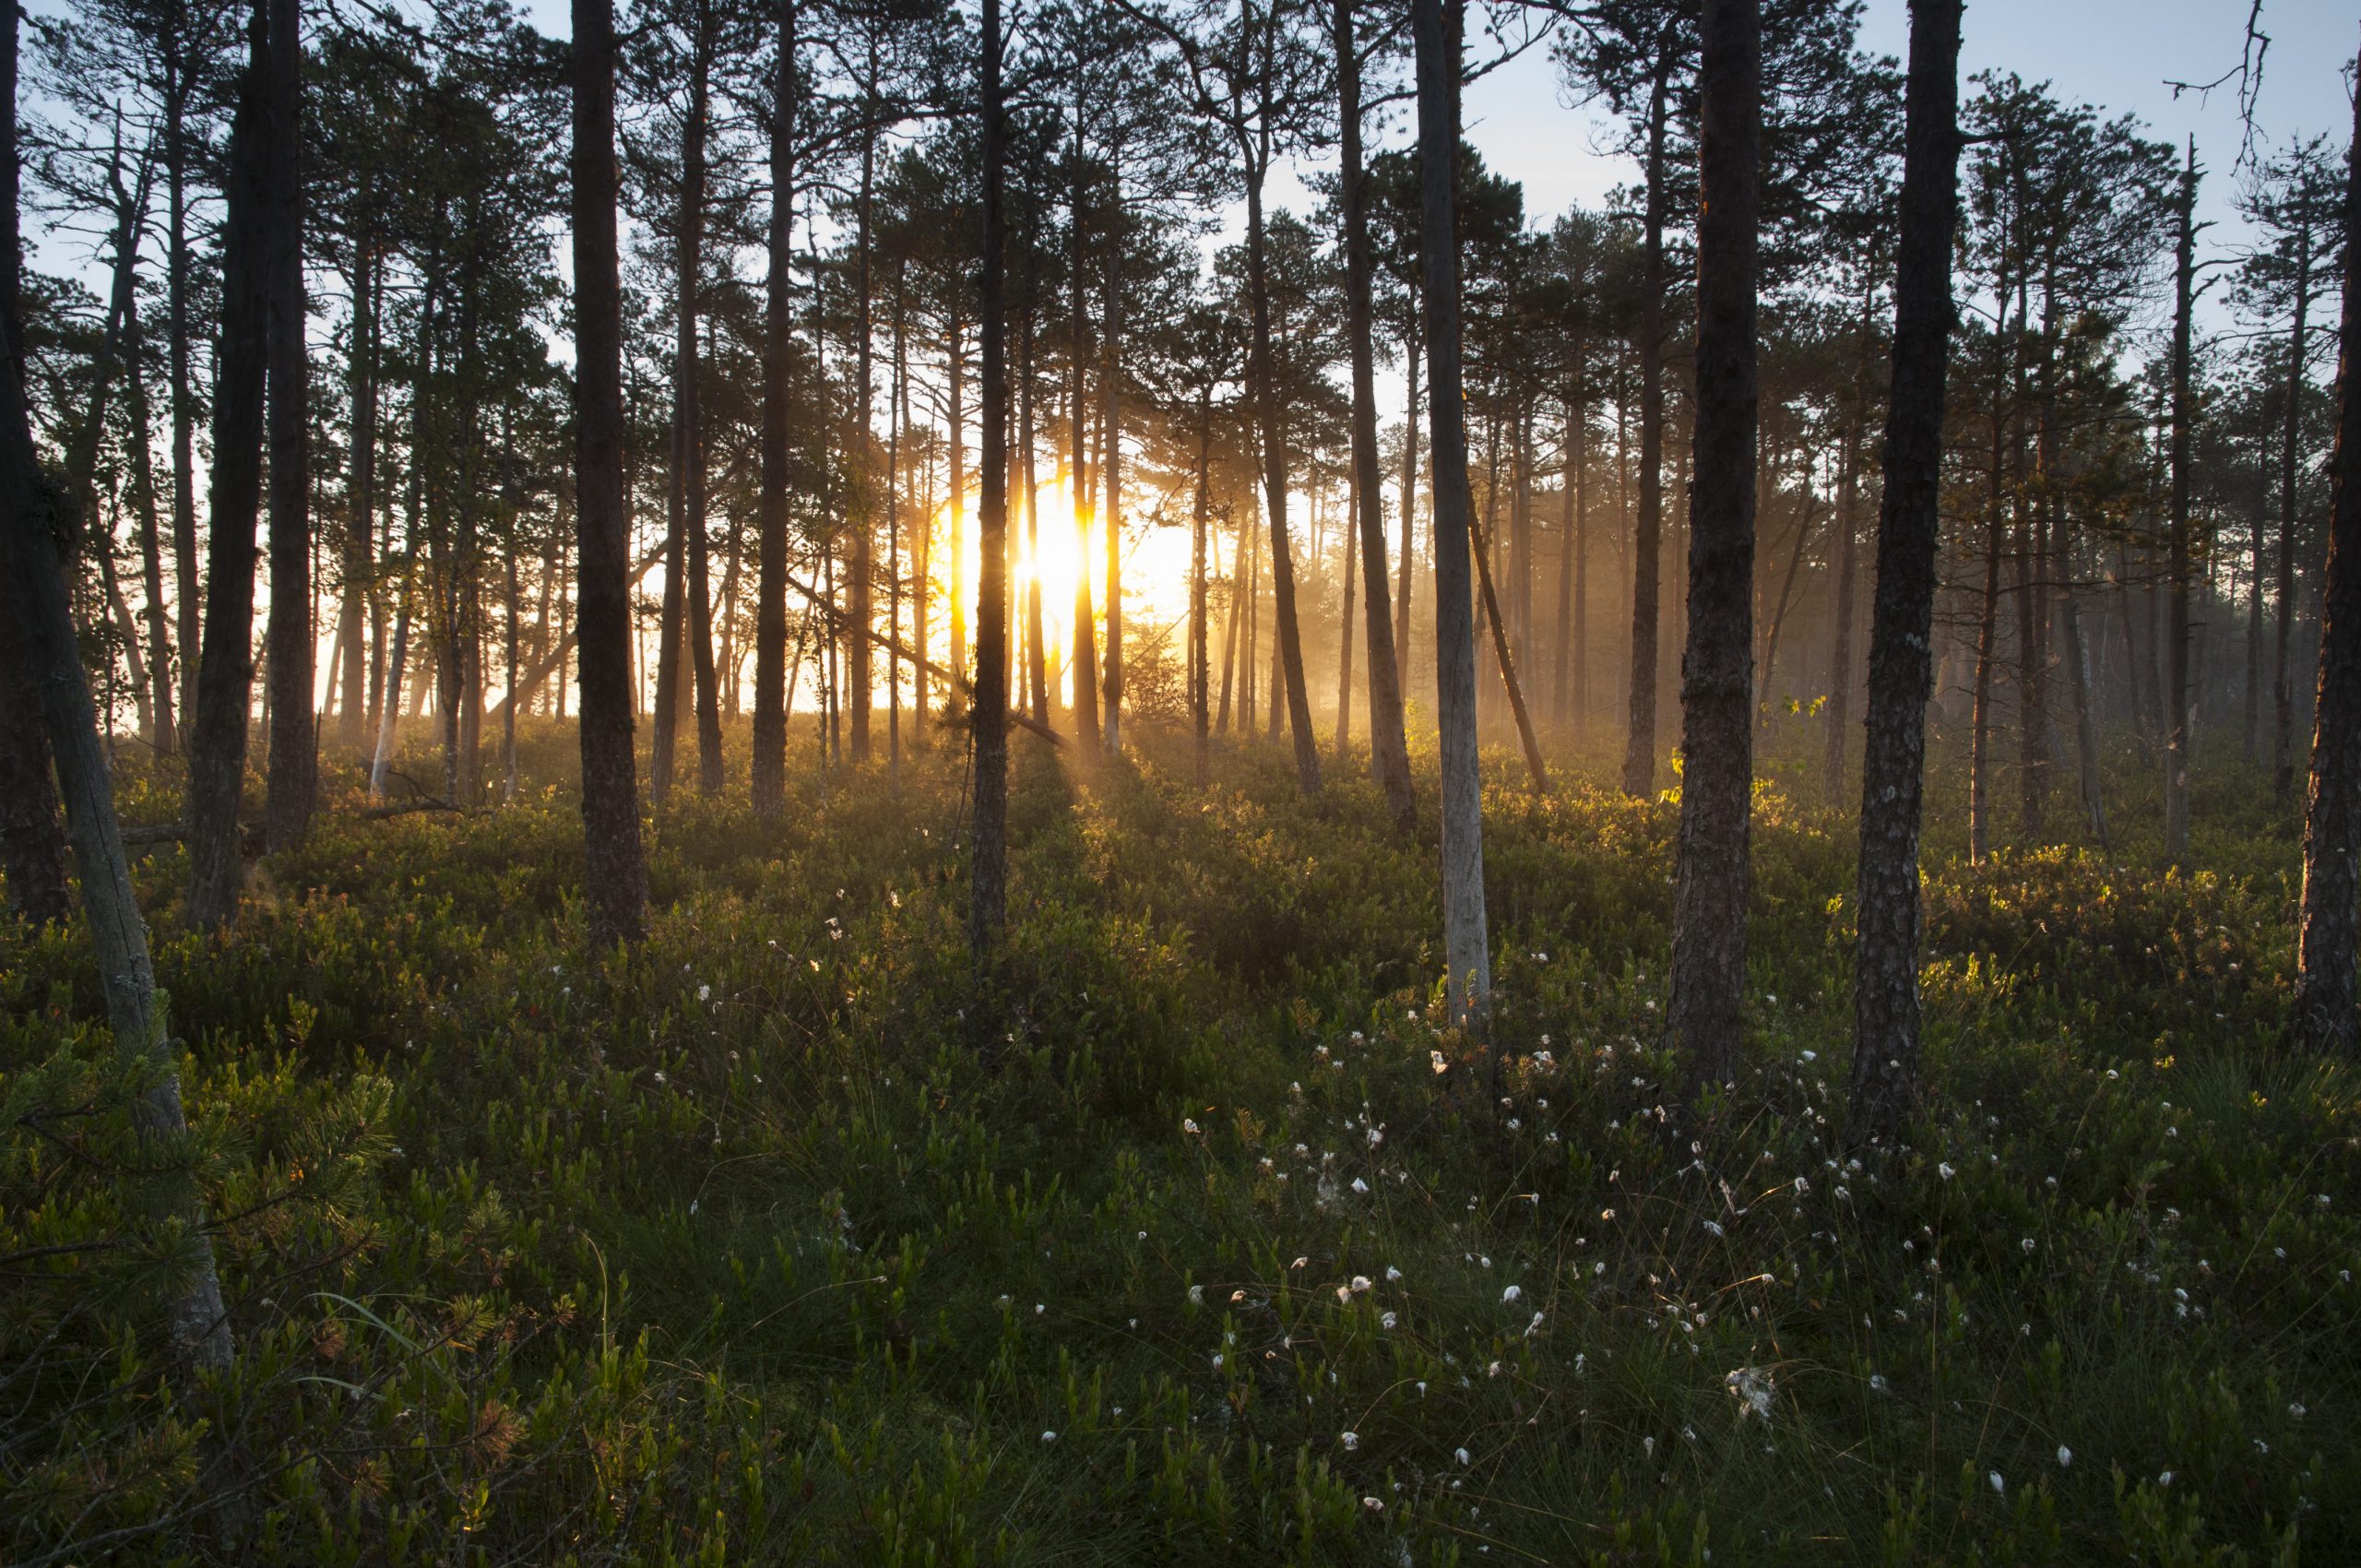
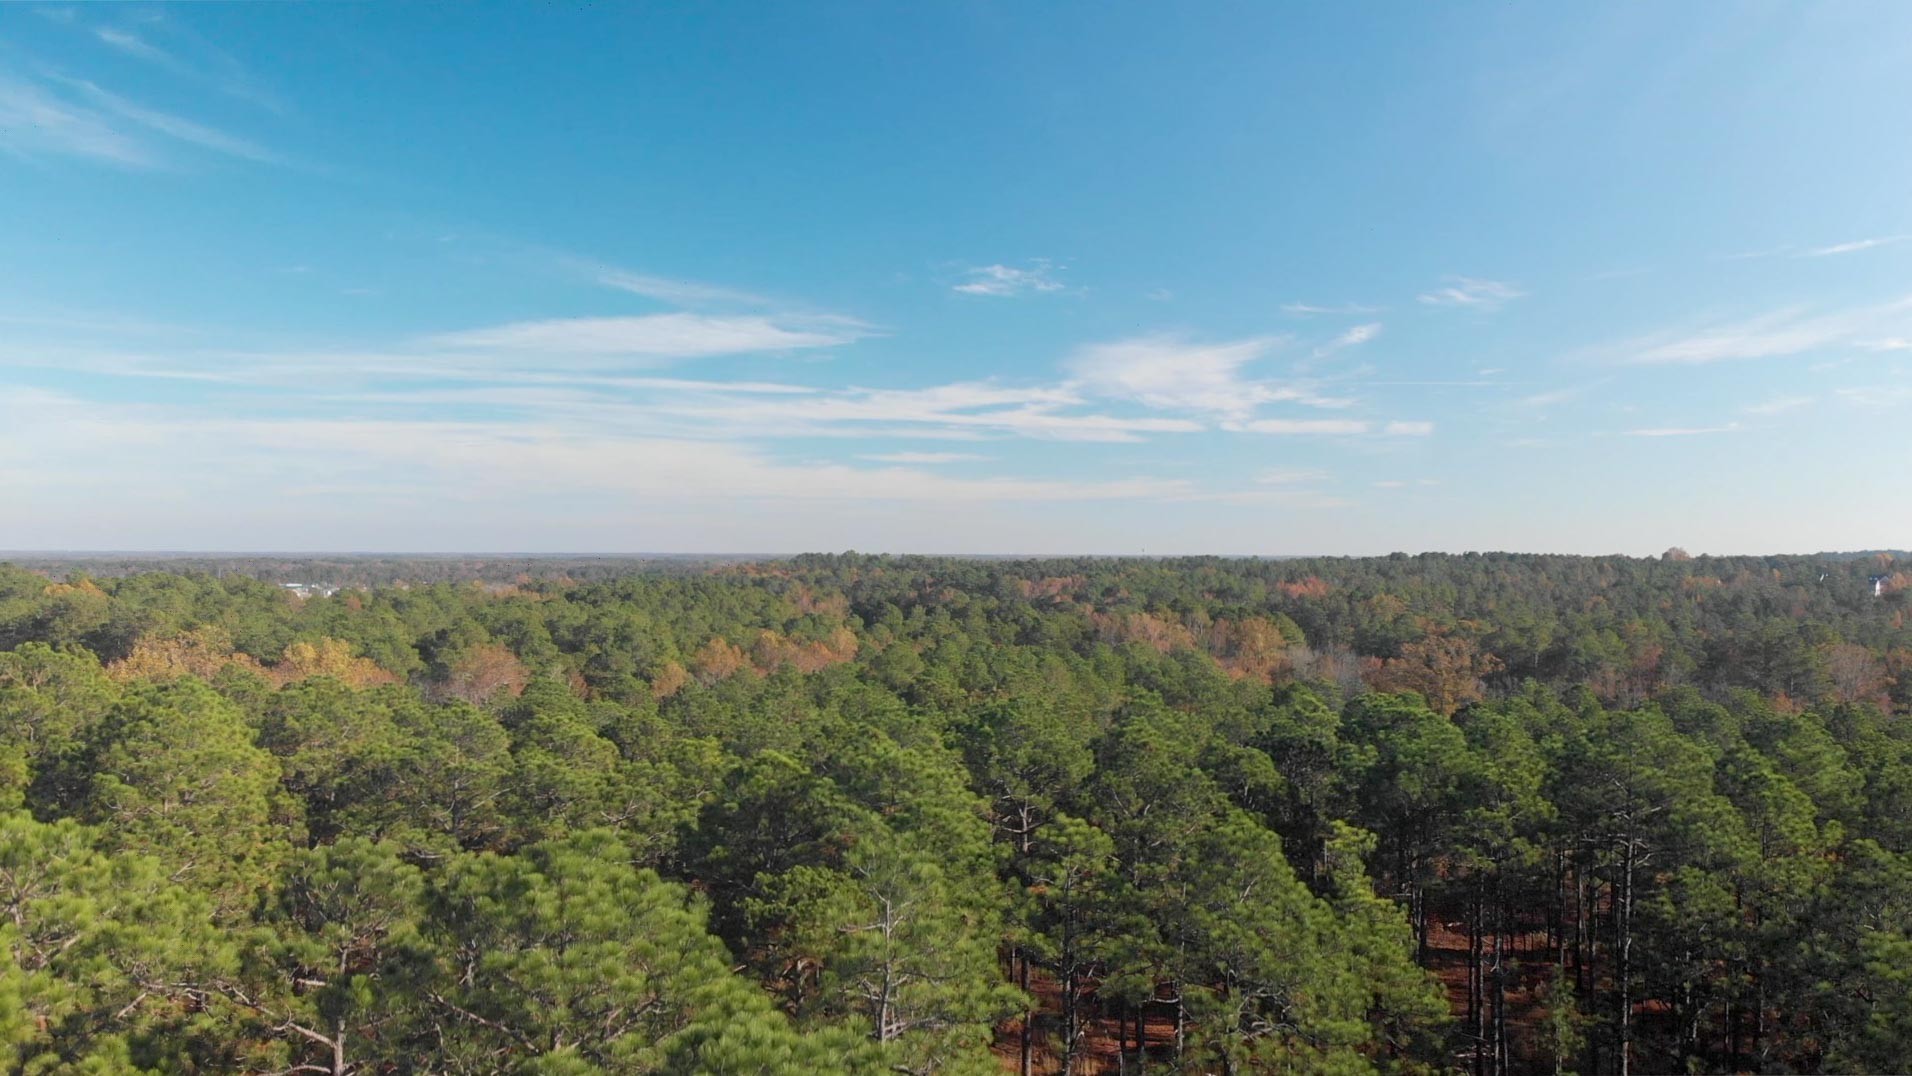
Sunrise through forest in Estonia
Summary of key questions addressed in the analysis:
Impacts of wood-based bioenergy demand to forest resources:
Forest area / forest cover
No negative impact. Regardless of increasing domestic biomass utilisation for energy and exports, forest area has increased due to afforestation programmes. Forest cover is not as high as forest area, due to temporarily un-stocked area after clear-cut. Despite this, forest cover has continuously increased from 2010–2018.
Growing stock
No negative impact. The total forest growing stock has been increasing for the last two decades. In 2018 the growth slowed or halted (official statistics show a decrease, but this is due to sampling error). In 2018 there was record-high wood demand from Finland, which was driven by high global pulp prices motivating maximal pulp production. This increased harvests to a previously unseen level.
Harvesting levels
Slight increasing impact. During 2004–2011, harvesting levels in Estonia were less than half of the estimated maximum sustainable level. This resulted in an increase in the maximum sustainable harvesting level for the 2011–2020 period. In 2018, the harvesting volumes were at the maximum sustainable level. The main drivers increasing the harvesting volumes have been increased sawmill capacity and production, high demand for pulpwood in Finland and Sweden and improved demand for energy wood. This was a temporary peak and demand has already slowed. Softwood lumber prices have decreased significantly in Europe due to an abundance of wood supply from Central Europe, which has been created by widespread bark beetle and other forest damages. Global pulp prices have also decreased to below 2017 prices.
Forest growth / carbon sequestration potential
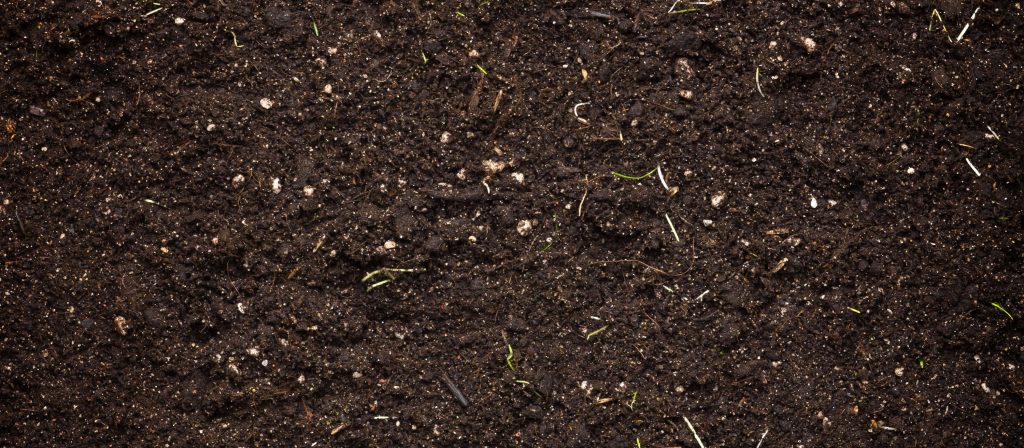
Ambivalent impact. The annual increment has grown throughout the 2000–2018 period. Increased fuelwood price has enabled forest management in some of the alder forests that were completely unutilised in the past. Thinnings, both commercial and pre-commercial, accelerate long-term volume growth in forests, leading to increased carbon sequestration. Removal of harvesting residues decreases carbon sequestration since the residues are input to the soil carbon pool. However, the majority of the harvesting residues’ carbon is released to the atmosphere when the biomass decays, so the ultimate impact of harvesting residue collection is minimal if the collection is done on a sustainable level. The sustainability of the collection is determined by how the soil nutrient balance is impacted by collection. This is not accounting for the substitution effect that the harvesting residues may have, by e.g. reducing the need to burn fossil fuels. Utilisation of sawmill by-products does not directly impact forests’ carbon sequestration potential, but it can increase harvesting through improved sawmill overall profitability.
Impacts of wood-based bioenergy demand to forest management practices:
Rotation lengths
Neutral. Forest law regulates minimum forest age for clear-cuts. According to interviews, Riigimetsa Majandamise Keskus (RMK – the Estonian state forest company), often conducts the final felling at the minimum age. Due to the regulation, an increase of wood-based bioenergy demand has not shortened rotations at least in state-managed forests. In forests that are older than the minimum final felling age, sawlog price is a more important driver for final-felling decisions than wood-based bioenergy demand.
Thinning
Increasing impact. The increase of bioenergy demand has increased the demand for small-diameter hardwood, which in turn has increased thinnings in previously unmanaged forest stands. This will increase the availability of good quality sawlogs and will also accelerate the carbon sequestration (tonnes/ha/year) of the forests. However, the total forest carbon stock (tonnes/ha) will be reduced; in unmanaged (e.g. no thinnings) mature stands, the carbon stock is larger than in managed stands of similar age. The carbon stock of a thinned stand will remain below that of an unthinned stand regardless of post-thinning accelerated growth.
Conversion from hardwood to softwood
Neutral. No indication of hardwood conversion to softwood was found.
Impacts of wood-based bioenergy demand to solid wood product (SWP) markets:
Diversion from other wood product markets
Neutral. Production of sawnwood, wood-based panels, pulp and paper products have increased or remained steady, i.e. no evidence of diversion.
Wood prices
Slight increasing impact. During 2017–2018, the price of all roundwood assortments increased notably. The increase was strongest in pulpwood assortments, especially those that are not further processed domestically but are exported to mainly Finland and Sweden. Finnish demand for pulpwood was at a very high level in 2018. This was a temporary trend, however, and prices and demand have since decreased. The price increase for fuelwood was less dramatic, no sharp increases are observed. According to interviews, pellet production was the most important driver of fuelwood prices.
Read the full report: Catchment Area Analysis in Estonia. A 2017 interview with Raul Kirjanen, CEO of Graanul Invest, a wood pellet supplier of Drax operating in Estonia, can be read here. Read how Drax and Graanul work with NGOs when concerns are raised within our supply chain here.
Read more about how bioenergy has no negative impact on Estonia’s forest resources here.
This is part of a series of catchment area analyses around the forest biomass pellet plants supplying Drax Power Station with renewable fuel. Others in the series include: Georgia Mill, Latvia, Chesapeake and Drax’s own, other three mills LaSalle Bionergy, Morehouse Bioenergy and Amite Bioenergy.


![Reforestation in Estonia. * Note: Since 2014 it has not been compulsory for private and other forest owners to submit reforestation data. [Click to view/download]](https://www.drax.com/uk/wp-content/uploads/sites/8/2020/03/figure_3.13.png)