


https://www.drax.com/uk/investors/disclaimer-proposed-acquisition-of-pinnacle-renewable-energy-inc-by-drax/
https://www.drax.com/uk/investors/disclaimer-proposed-acquisition-of-pinnacle-renewable-energy-inc-by-drax/

27 January 2021

Tackling climate change requires global collaboration. As a UK-US sustainable energy company, with communities on both sides of the Atlantic, we at Drax are keenly aware of the need for thinking that transcends countries and borders.
Joe Biden has become the 46th President of my native country at a crucial time to ensure there is global leadership and collaboration on climate change. Starting with re-joining the Paris Agreement, I am confident that the new administration can make a significant difference to this once-in-a-lifetime challenge.
This is why Drax and our partners are mobilising a transatlantic coalition of negative emissions producers. This can foster collaboration and shared learning between the different technologies and techniques for carbon removal that are essential to decarbonise the global economy.
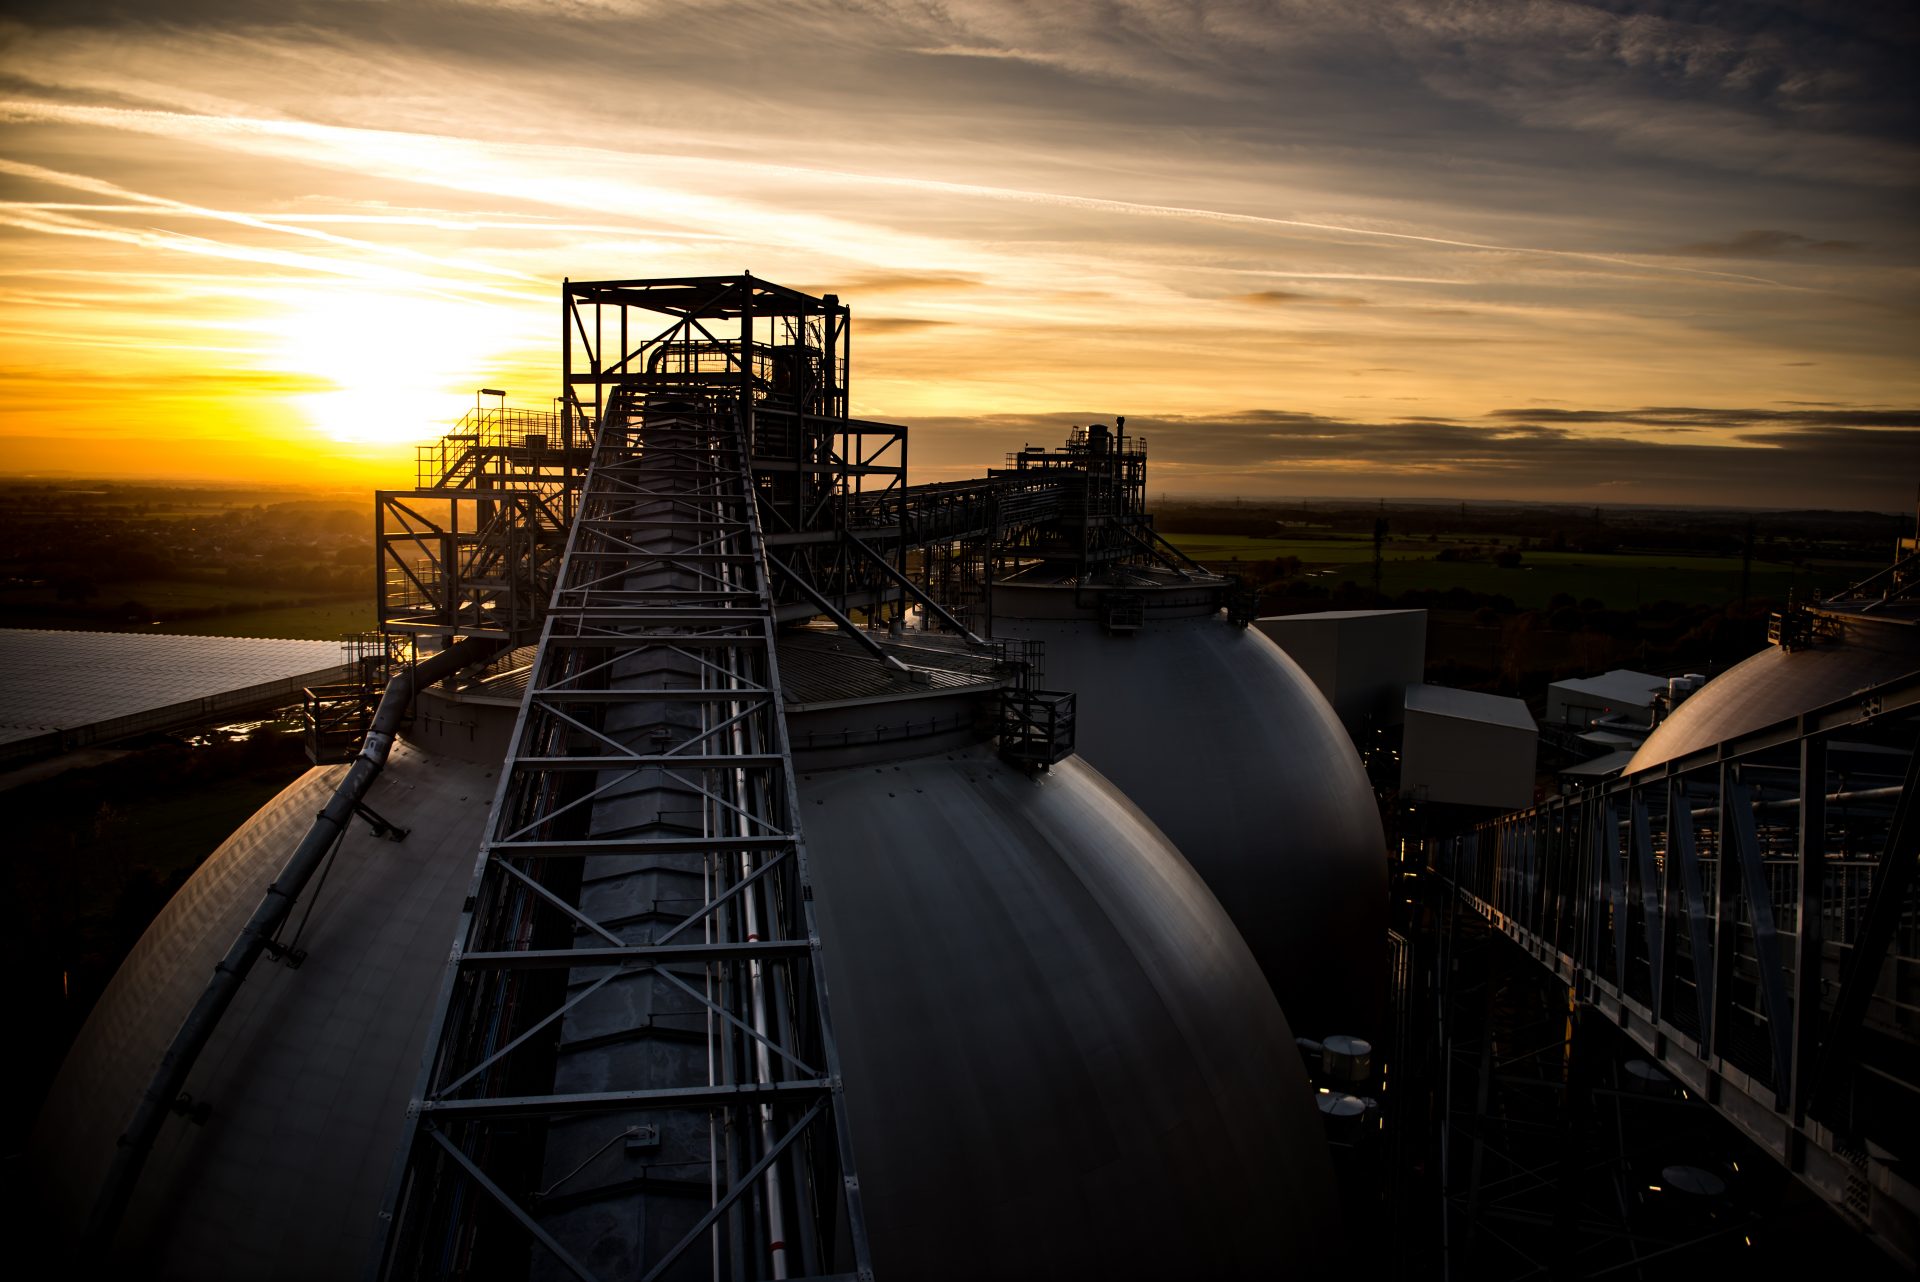
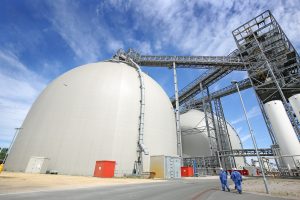
Biomass storage domes at Drax Power Station in North Yorkshire
Whilst political and technical challenges lie ahead, clear long-term policies that spur collaboration, drive innovation and enable technologies at scale are essential in achieving the UK and US’ aligned targets of reaching net zero carbon emissions by 2050.
What makes climate change so difficult to tackle is that it requires collaboration from many different parties on a scale like few other projects. This is why the Paris Agreement and this year’s COP26 conference in Glasgow are so vital.
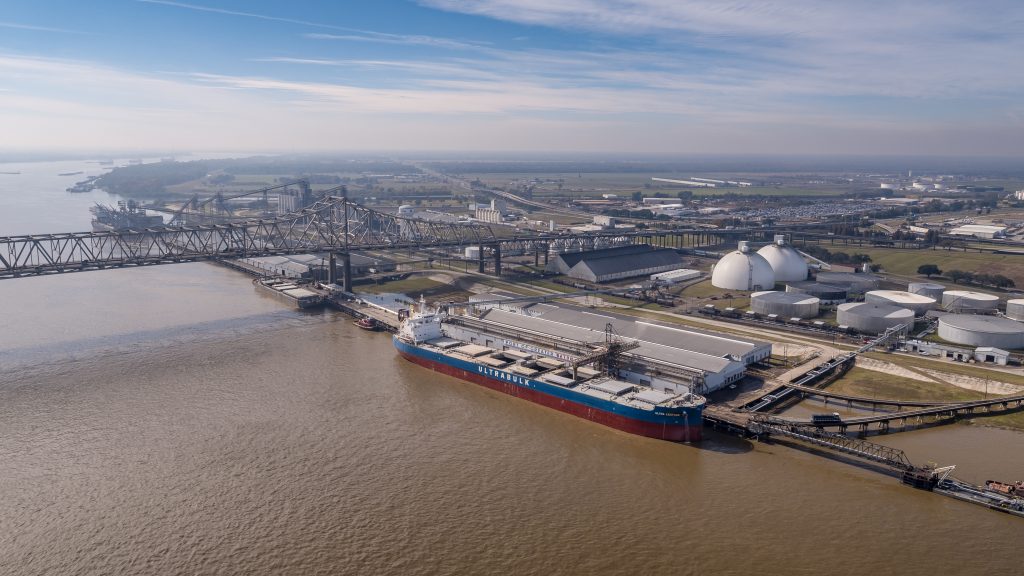
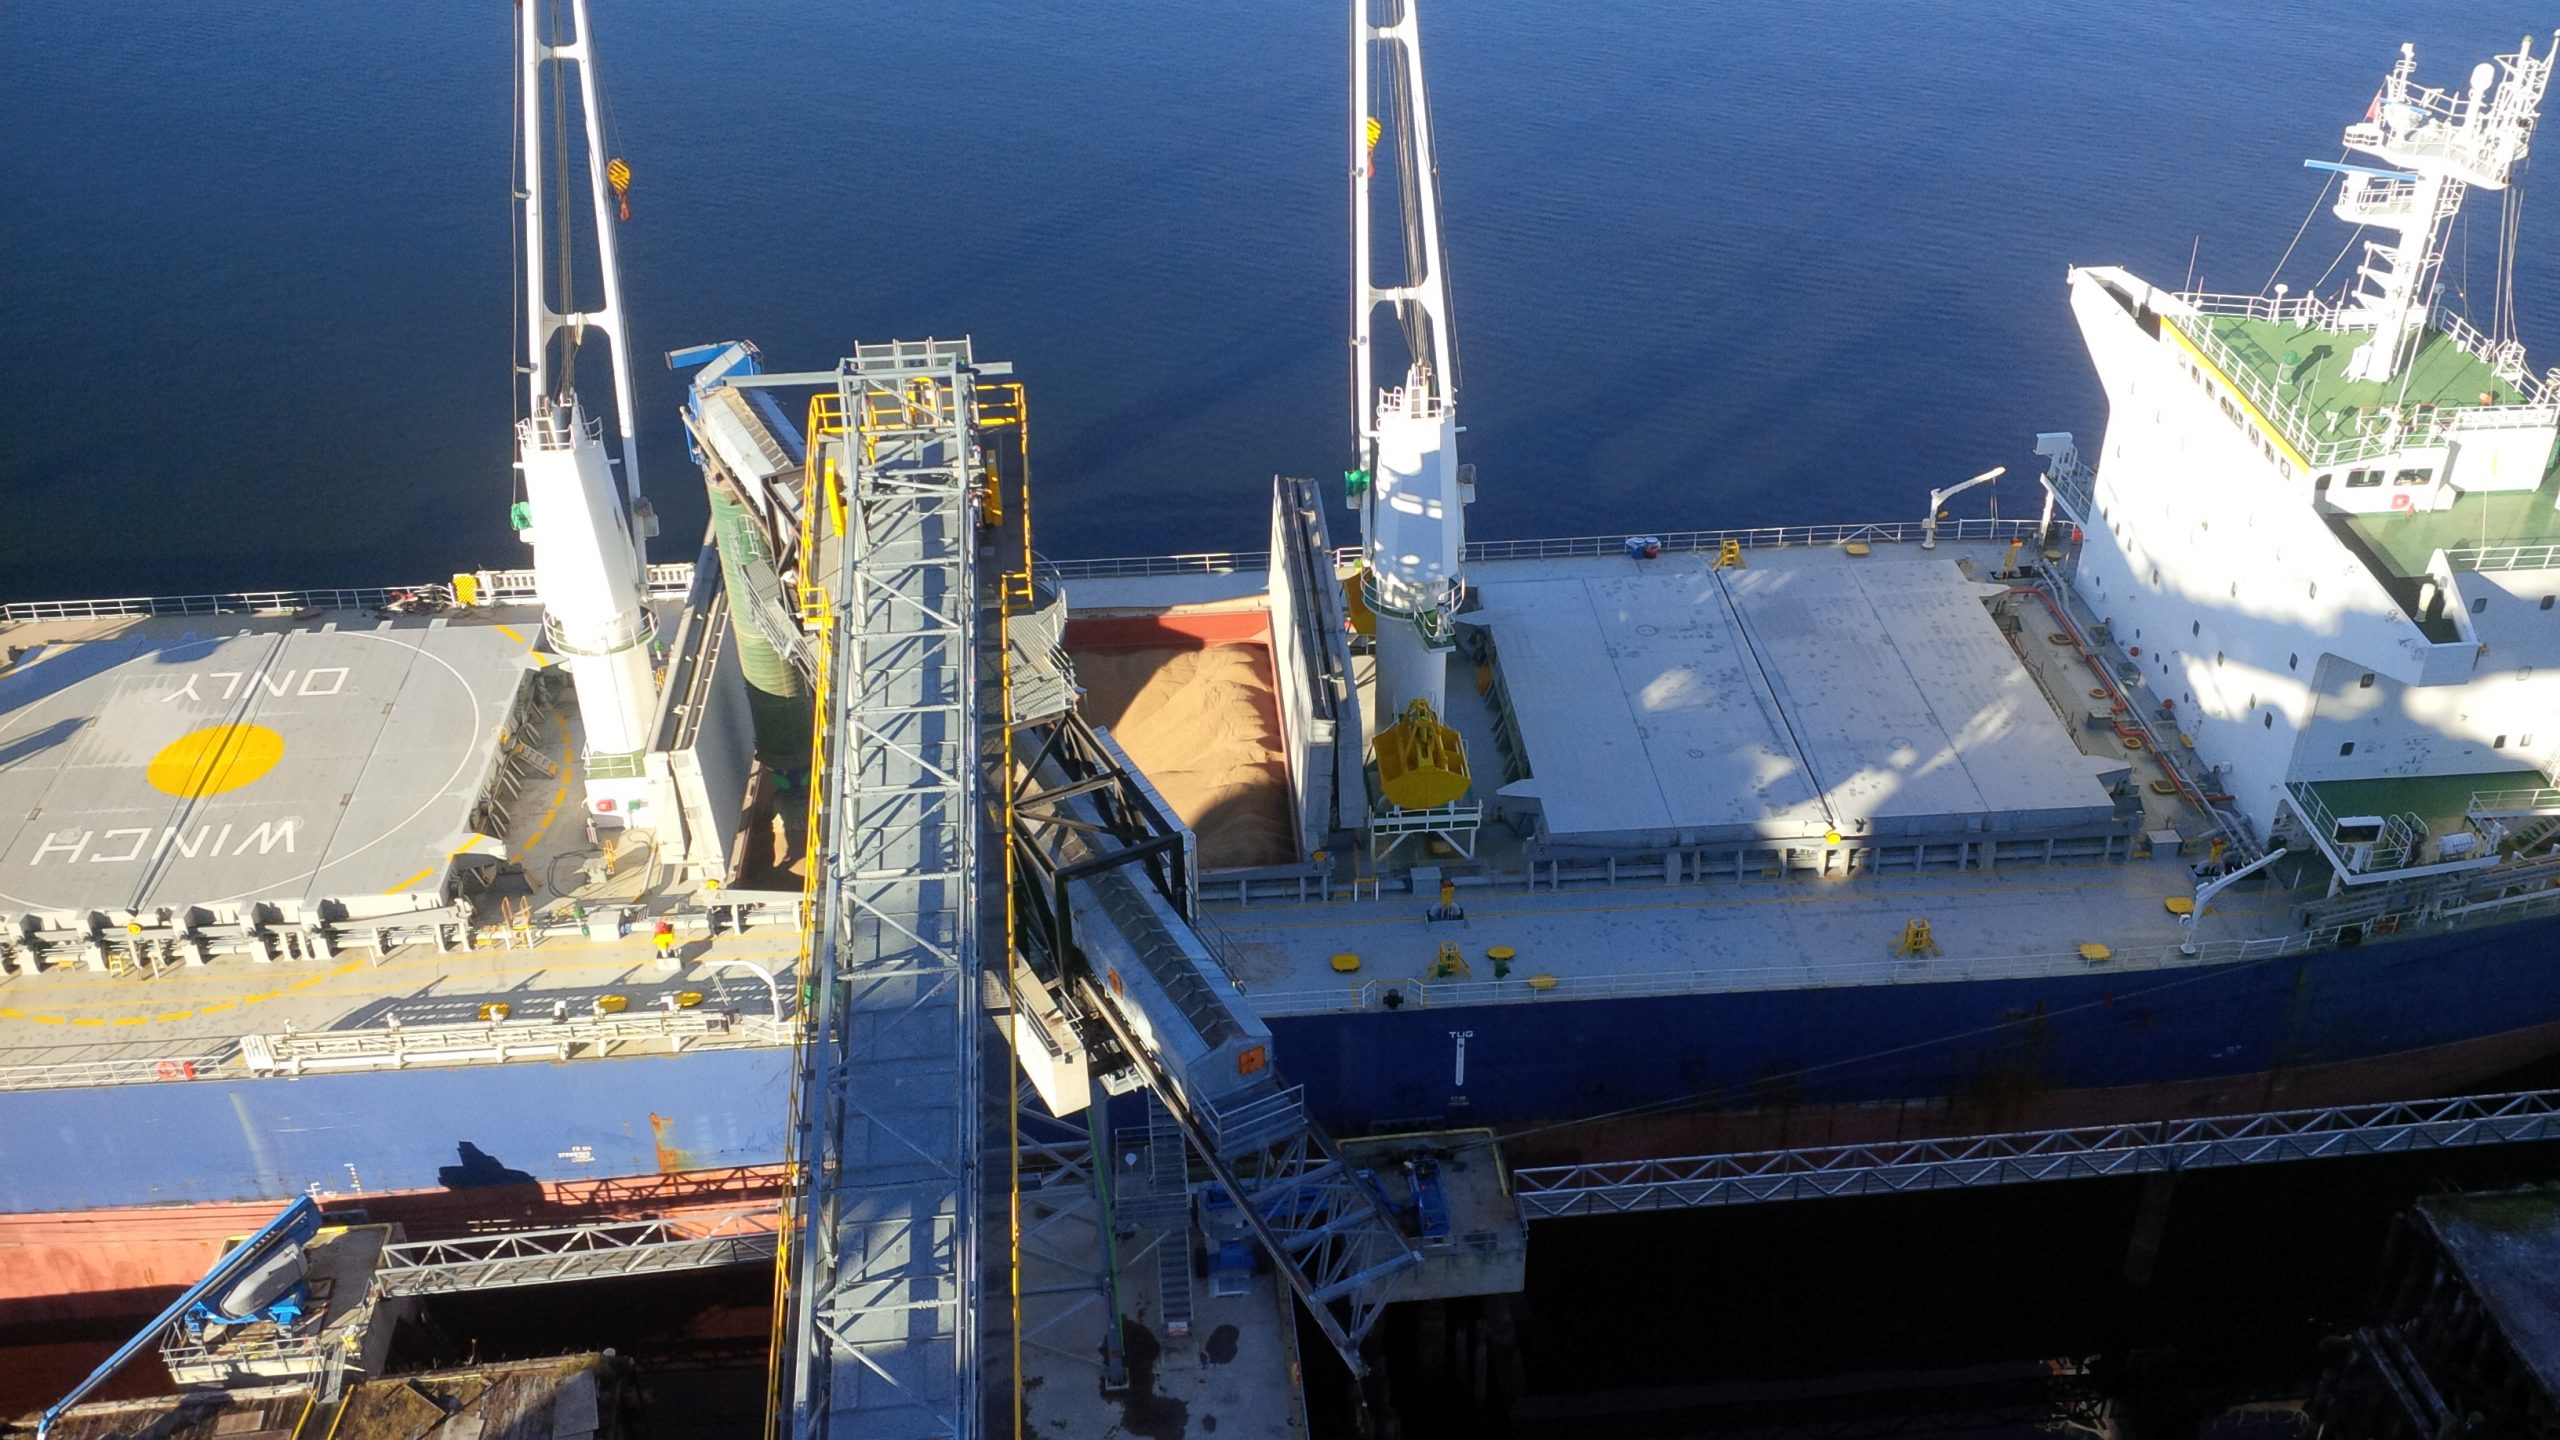
Sustainable biomass wood pellets being safely loaded at the Port of Greater Baton Rouge onto a vessel destined for Drax Power Station
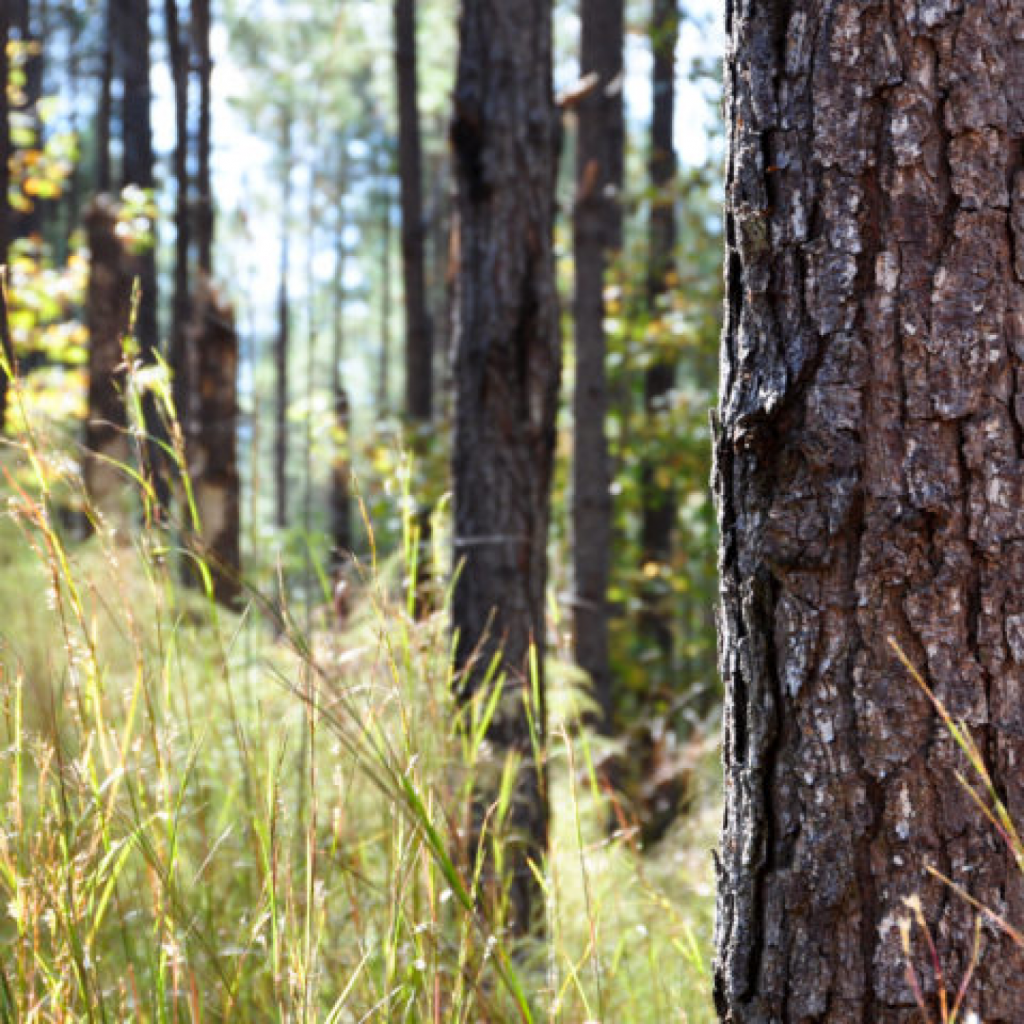
Our effort towards delivering negative emissions using bioenergy with carbon capture and storage (BECCS) is another example of ambitious decarbonisation that is most impactful as part of an integrated, collaborative energy system. The technology depends upon sustainable forest management in regions, such as the US South where our American communities operate. Carbon capture using sustainable bioenergy will help Drax to be carbon negative by 2030 – an ambition I announced at COP25, just over a year ago in Madrid.
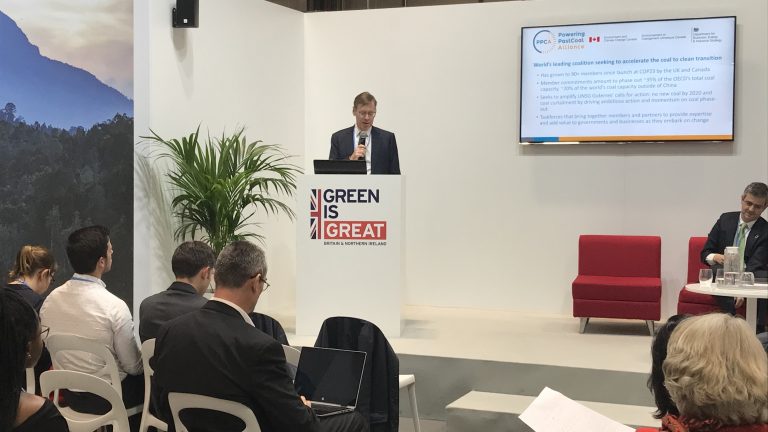
Will Gardiner announcing Drax’s carbon negative ambition at COP25 in Madrid (December 2019).
Experts on both sides of the Atlantic consider BECCS essential for net zero. The UK’s Climate Change Committee says it will play a major role in tackling carbon dioxide (CO2) emissions that will remain in the UK economy after 2050, from industries such as aviation and agriculture that will be difficult to fully decarbonise. Meanwhile, a report published last year by New York’s Columbia University revealed that rapid development of BECCS is needed within the next 10 years in order to curb climate change.
A variety of negative emissions technologies are required to capture between 10% and 20% of the 35 billion metric tonnes of carbon produced annually that the International Energy Agency says is needed to prevent the worst effects of climate change.
We believe that sharing our experience and expertise in areas such as forestry, bioenergy, and carbon capture will be crucial in helping more countries, industries and businesses deploy a range of technologies.
A formal coalition of negative emissions producers that brings together approaches including land management, afforestation and reforestation, as well as technical solutions like direct air capture (DAC), as well as BECCS, would offer an avenue to ensure knowledge is shared globally.
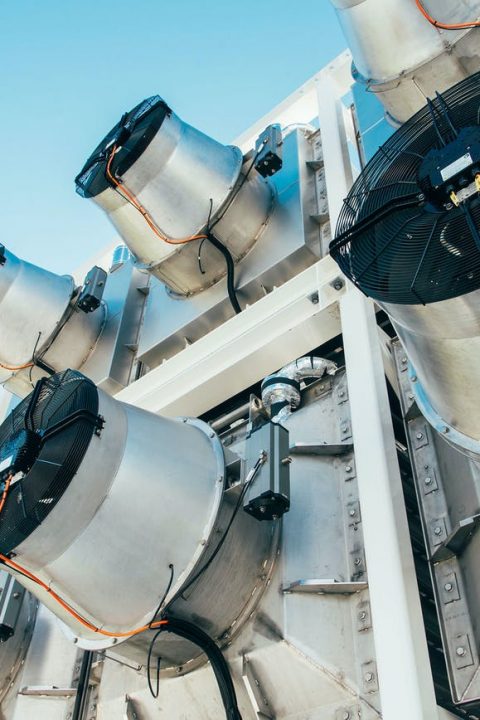
Direct air capture (DAC) facility
It would also offer flexibility in countries’ paths to net zero emissions. If one approach under-delivers, other technologies can work together to compensate and meet CO2 removal targets.
As with renewable energy, working in partnership with governments is essential to develop these innovations into the cost-effective, large scale solutions needed to meet climate targets in the mid-century.
I agree whole heartedly that a nation’s economy and environment are intrinsically linked – something many leaders are now saying, including President Biden. The recently approved US economic stimulus bill, supported by both Republicans and Democrats in Congress and which allocates $35 billion for new clean energy initiatives, is a positive step for climate technology and job creation.
Globally as many as 65 million well-paid jobs could be created through investment in clean energy systems. In the UK, BECCS and negative emissions are not just essential in preventing the impact of climate change, but are also a vital economic force as the world begins to recover from the effects of COVID-19.
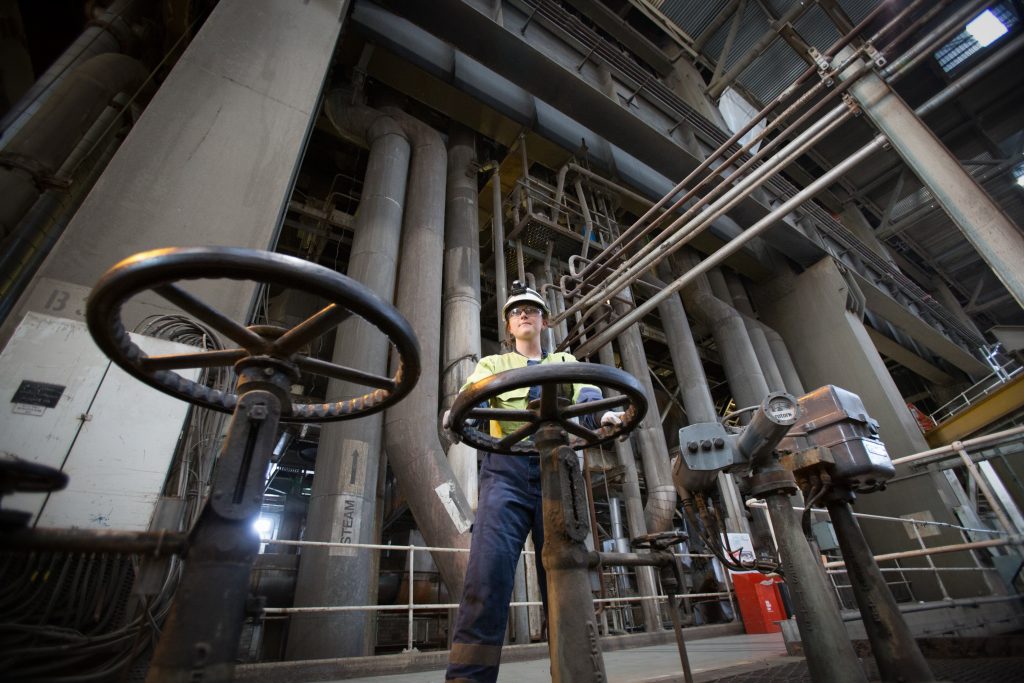
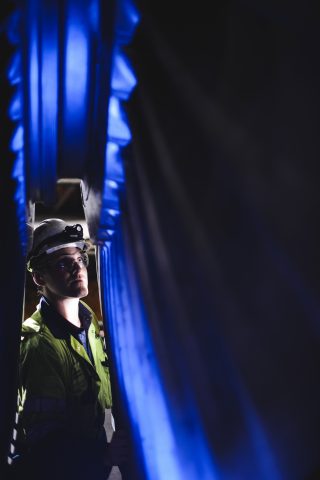
Engineer inside the turbine hall of Drax Power Station
Government and private investments in clean energy technologies can create thousands of well-paid jobs, new careers, education opportunities and upskill workforces. Developing BECCS at Drax Power Station, for example, would support around 17,000 jobs during the peak of construction in 2028, including roles in construction, local supply chains and the wider economy.
Additional jobs would be supported and created throughout our international supply chain. This includes the rail, shipping and forestry industries that are integral to rural communities in the US South.
We are also partnered with 11 other organisations in the UK’s Humber region to develop a carbon capture, usage and storage (CCUS) and hydrogen industrial cluster with the potential to spearhead creating and supporting more than 200,000 jobs around the UK in 2039.
The expertise and equipment needed for such a project can be shared, traded and exported to other industrial clusters around the world, allowing us to help reach global climate goals and drive global standards for CCUS and biomass sustainability.
Clear, long-term policies are essential here, not just to help develop technology but to mitigate risk and encourage investment. These are the next crucial steps needed to deploy negative emissions at the scale required to impact CO2 emissions and lives of people.
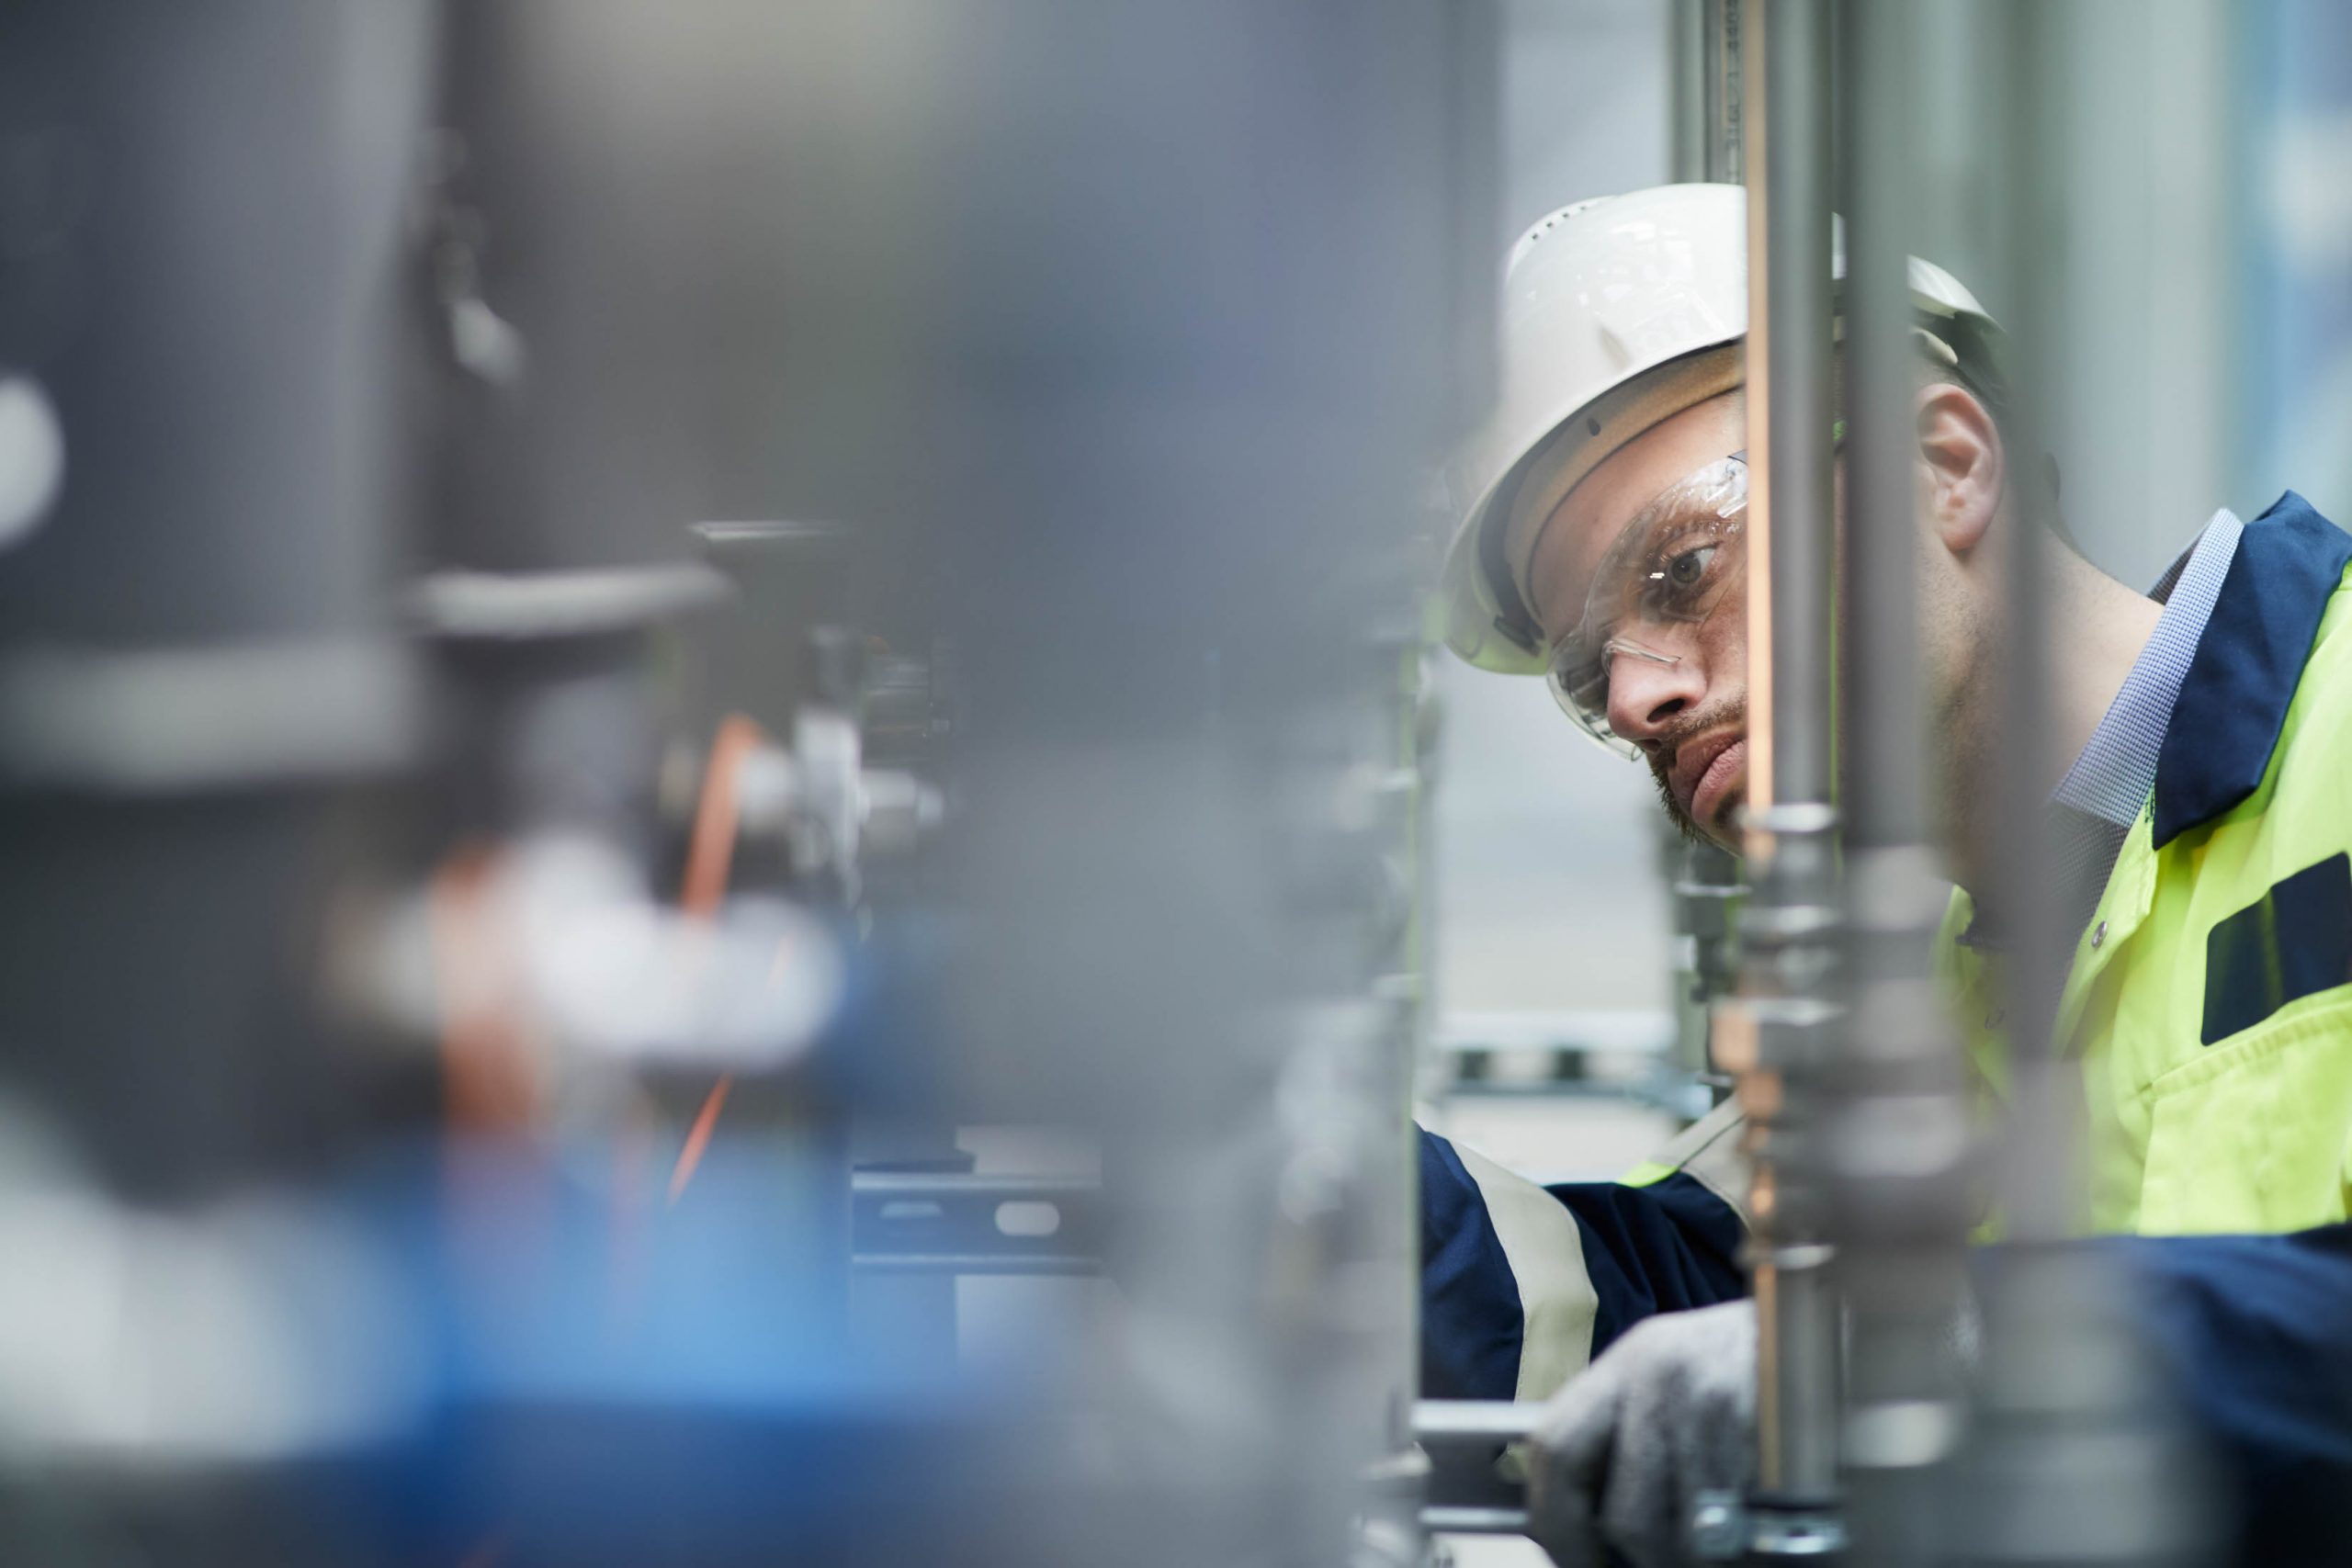
Engineer at BECCS pilot project within Drax Power Station
At Drax we directly employ almost 3,000 people in the US and UK, and indirectly support thousands of families through our supply chains on both sides of the Atlantic. Drax Power Station is the most advanced BECCS project in the world and we stand ready to invest in this cutting-edge carbon capture and removal technology. We can then share our expertise with the United States and the rest of the world – a world where major economies are committing to a net zero future and benefiting from a green economic recovery.

(“Drax”, “the Group”, “Drax Group”, “the Company”; Symbol: DRX)
Drax is pleased to announce that it has reached agreement for the sale of Drax Generation Enterprise Limited (“DGEL”), which holds four Combined Cycle Gas Turbine (“CCGT”) power stations, to VPI Holding Limited (“VPI”) for consideration of £193.3 million, subject to customary adjustments. This includes £29.0 million of contingent consideration associated with the option to develop a new CCGT at Damhead Creek.
The transaction is subject to certain customary closing conditions, including anti-trust approval, with completion to take place by 31 January 2021.
The CCGTs have performed well since acquisition by Drax in December 2018, but do not form part of the Group’s core flexible and renewable generation strategy. Drax expects to realise a premium on sale, use the proceeds to develop its biomass supply chain and accelerate its ambition to become a carbon negative business by 2030.
DGEL also holds the Group’s pumped storage and hydro assets and is the shareholder of SMW Limited (the owner of the Daldowie fuel plant). These assets, shares and employees are to be transferred out of DGEL prior to completion and will be retained by Drax.

Drax Group CEO Will Gardiner in the control room at Drax Power Station [Click to view/download]
“By focusing on our flexible and renewable generation activities in the UK we expect to deliver a further reduction in the Group’s CO2 emissions, which should accelerate our ambition to become not just carbon neutral but carbon negative by 2030.
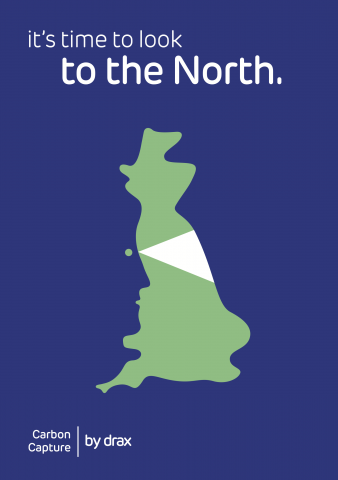
“By using carbon capture and storage with biomass (BECCS) at the power station in North Yorkshire to underpin the decarbonisation of the wider Humber region, we believe we would be creating and supporting around 50,000 new jobs and delivering a green economic recovery in the North.
“We greatly value the contribution that our colleagues in gas generation have made to the Group over the last two years. As we focus on a renewable and flexible portfolio, it is right that we divest these gas generation assets and in doing so create value for our shareholders.”
Between 2012 and 2019, through investment in sustainable biomass and hydro, Drax has reduced its carbon emissions by over 85% and become the largest source of renewable electricity in the UK(1).
In December 2019 Drax announced an ambition to become a carbon negative company by 2030. The negative emissions provided by BECCS will offset carbon emissions within the Group’s supply chain and help to offset emissions in harder to abate sectors of the economy, such as aviation and agriculture.
In February 2020 Drax announced an end to commercial coal generation in 2021 and now, by divesting its existing gas generation assets, Drax will further reduce its carbon emissions.
Drax will continue to provide system support services alongside its decarbonisation strategy through its renewable generation portfolio, other development opportunities and demand-side response within its Customers business. These activities provide renewable electricity and a fully flexible generation and supply portfolio, which can support the UK power system as it becomes increasingly reliant on intermittent and inflexible generation sources.
Rye House Power Station, Hertfordshire [Click to view/download]
Drax acquired the CCGTs from Iberdrola in December 2018 as part of a portfolio of pumped storage, hydro and gas generation. The majority of the value in the acquisition was ascribed to the pumped storage and hydro assets, which in the first six months of 2020 provided £35 million of Adjusted EBITDA(3). In the same period the CCGTs provided £18 million of Adjusted EBITDA. Group Adjusted EBITDA for the first six months of 2020 was £179 million.
As at 30 June 2020 the gross fixed assets for the CCGTs were £182 million.
The CCGTs also have £89 million of Capacity Market income between 2021 and 2024(4) which will remain with DGEL on completion.
The CCGT business currently employs 121 people in operational roles who will transfer with DGEL on completion.
Drax has agreed a series of transitional services to support the transition through 2021.
Drax continues to evaluate options for the development of four Open Cycle Gas Turbines and Drax Power Station following the end of coal operations.
Total consideration is £193.3 million, subject to customary completion accounts adjustments, comprising £164.3 million for the four CCGT power stations and a further £29.0 million of contingent consideration payable on satisfaction of certain triggers in respect of the option to develop a new CCGT at Damhead Creek.
The payment of £164.3 million in respect of the four CCGTs is payable in cash on completion, with an option to defer the payment of £50.0 million until April 2022. The deferred component would carry an interest rate of four percent and be backed by a letter of credit. In the event that the deferral option is exercised Drax intends to convert the payment obligation to cash upon completion for the face value.
Subject to fulfilment of pre-closing conditions, completion is to take place by 31 January 2021.
The sale price represents an expected premium compared to the book value of the assets, subject to customary adjustments and a return over the period of ownership significantly ahead of the Group’s WACC.
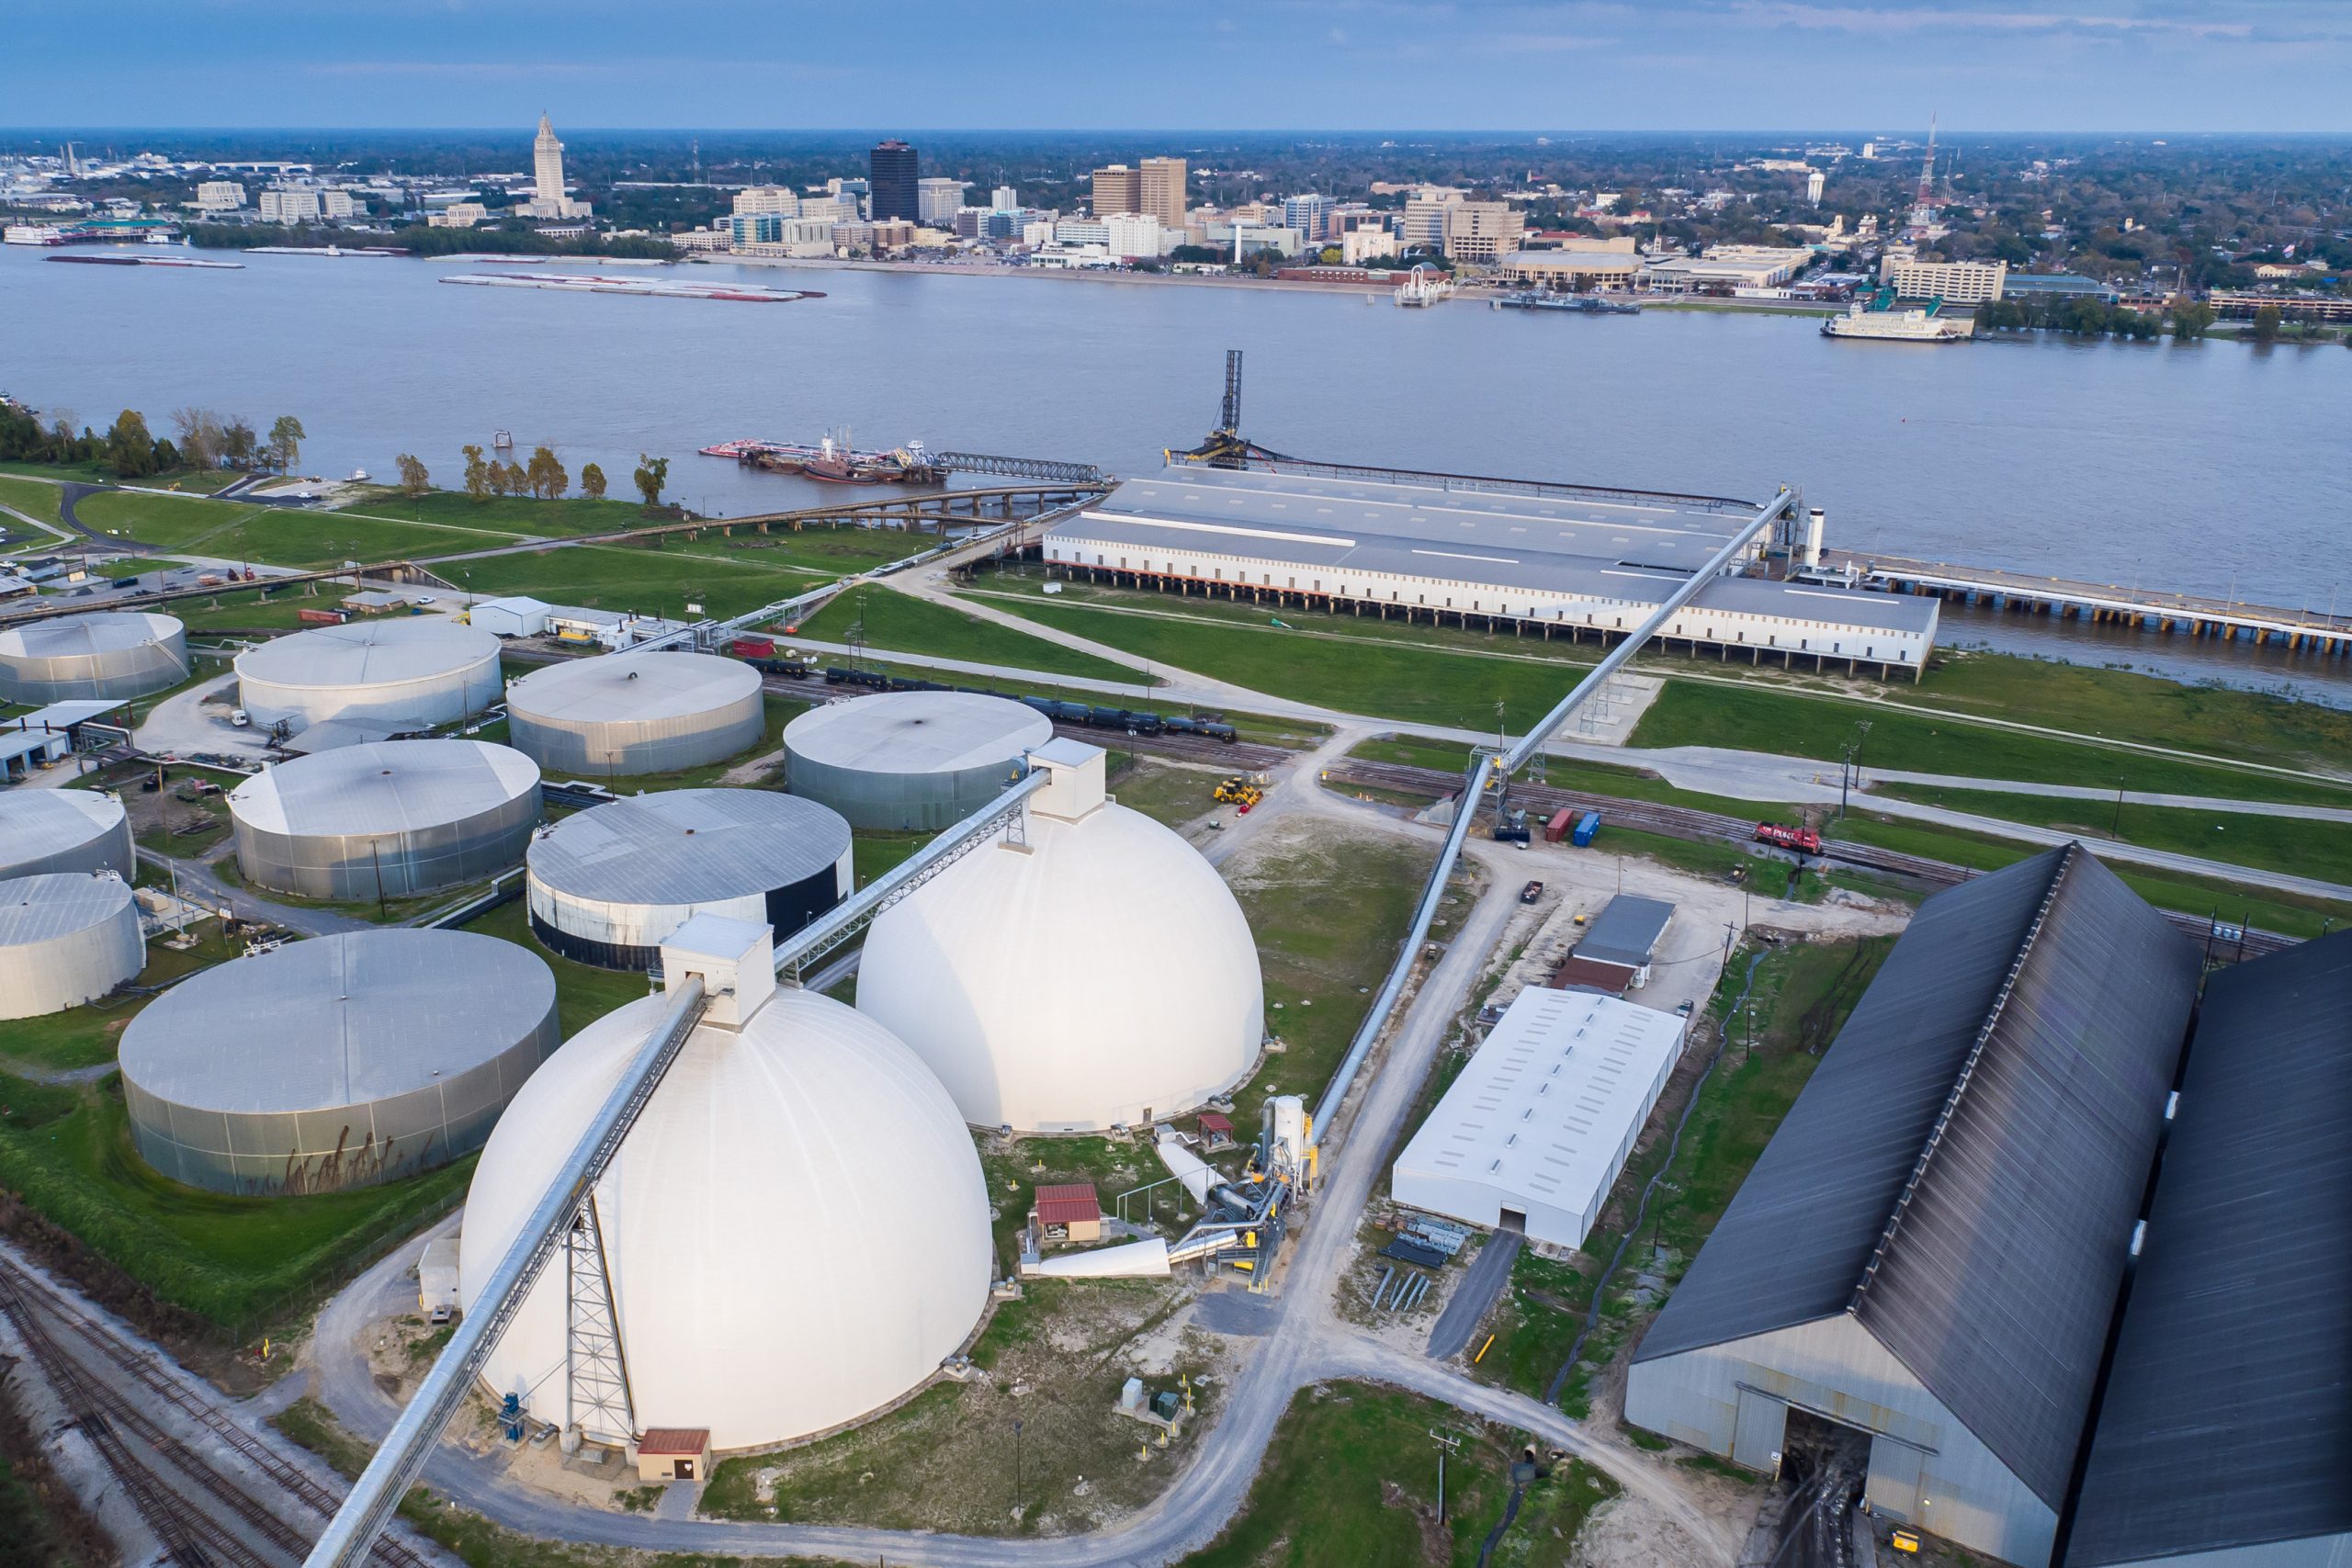
Sustainable biomass wood pellet storage domes at Baton Rouge Transit, a renewable fuel storage and logistics site operated by Drax at the Port of Greater Baton Rouge, Louisiana [Click to view/download]
These savings will be delivered through the optimisation of existing biomass operations, greater utilisation of low-cost wood residues and an expansion of the fuel envelope to incorporate other low-cost renewable biomass across the Group’s expanded supply chain.
Drax believes that the additional capital and operating cost investment required to deliver this supply chain expansion is in the region of £600 million, which the Group expects to invest ahead of 2027. Drax remains alert to sector opportunities for both organic and inorganic growth.
The Group has identified three models through which it believes it can deliver a long-term future for sustainable biomass, all of which are underpinned by the delivery of its supply chain expansion and cost reduction plans. These options, which are not mutually exclusive, are summarised below. The delivery of one or more of these models by 2027 would enable Drax to continue its biomass activities when the current UK renewable schemes for biomass generation end in March 2027.
Drax believe that biomass has an important role to play in the UK as a flexible and reliable source of renewable energy, supporting increased utilisation of intermittent and inflexible generation across the UK power grid. In March 2027, when the current CfD(6) and ROC(7) renewable schemes end, Drax believes that through a combination of peak power generation, system support services, Capacity Market income and a low-cost operating model for Drax Power Station (including low-cost biomass), this site can continue to operate as a merchant renewable power station.
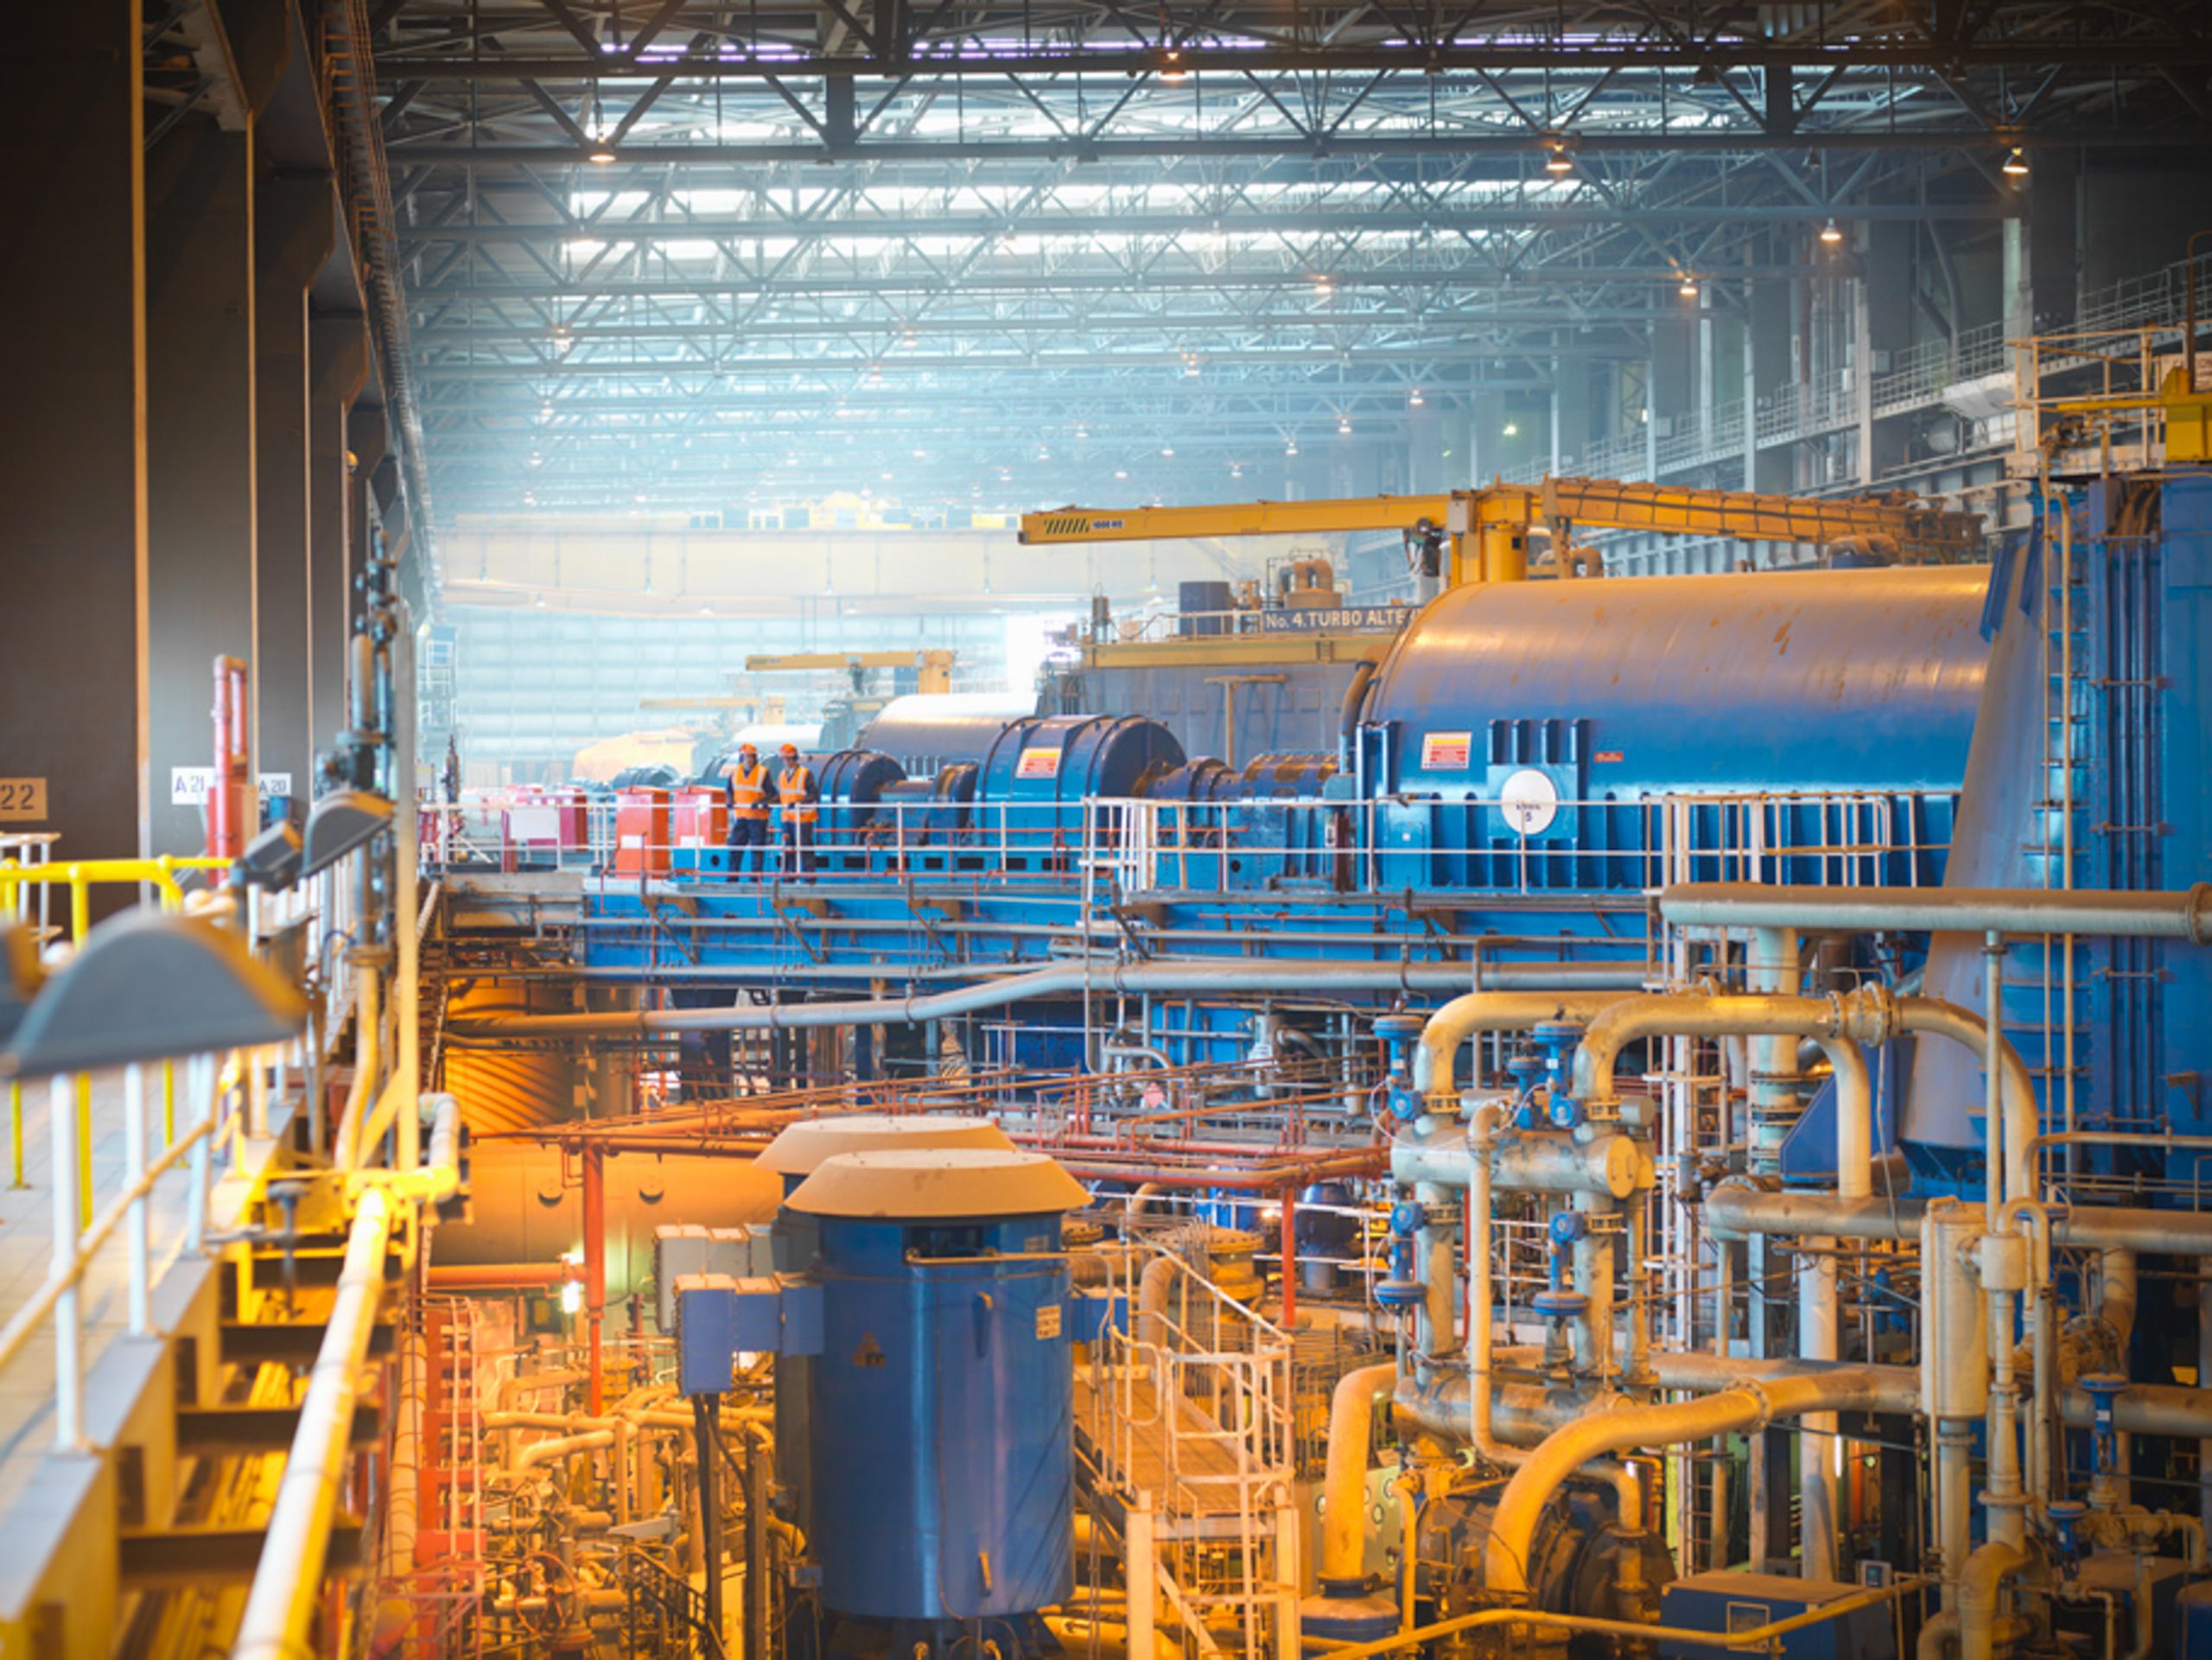
The four biomass units located in the turbine hall at Drax Power Station have a total capacity of 2.6 GW [Click to view/download]
The UK’s Climate Change Committee (CCC) has set out what is required for the country to achieve its legally binding objective of being net zero by 2050. This includes an important role for BECCS to remove CO2 from the atmosphere, creating negative emissions. BECCS is the only large-scale solution for negative emissions with renewable electricity and system support capabilities. Through combining BECCS with its existing four biomass generation units at Drax Power Station, Drax believes it could remove up to 16 million tonnes of CO2 per year – over two thirds of the CCC’s 2035 target for BECCS. In doing so Drax aims to become a carbon negative company by 2030.
The technology to deliver post-combustion BECCS exists and is proven at scale. In September 2020, Drax commenced a trial of one such technology provided by Mitsubishi Heavy Industries (MHI). In addition, Drax is developing innovative technology options, including C-Capture, a partnership between Leeds University, Drax, IP Group and BP, which has developed an organic solvent which could be used for BECCS.
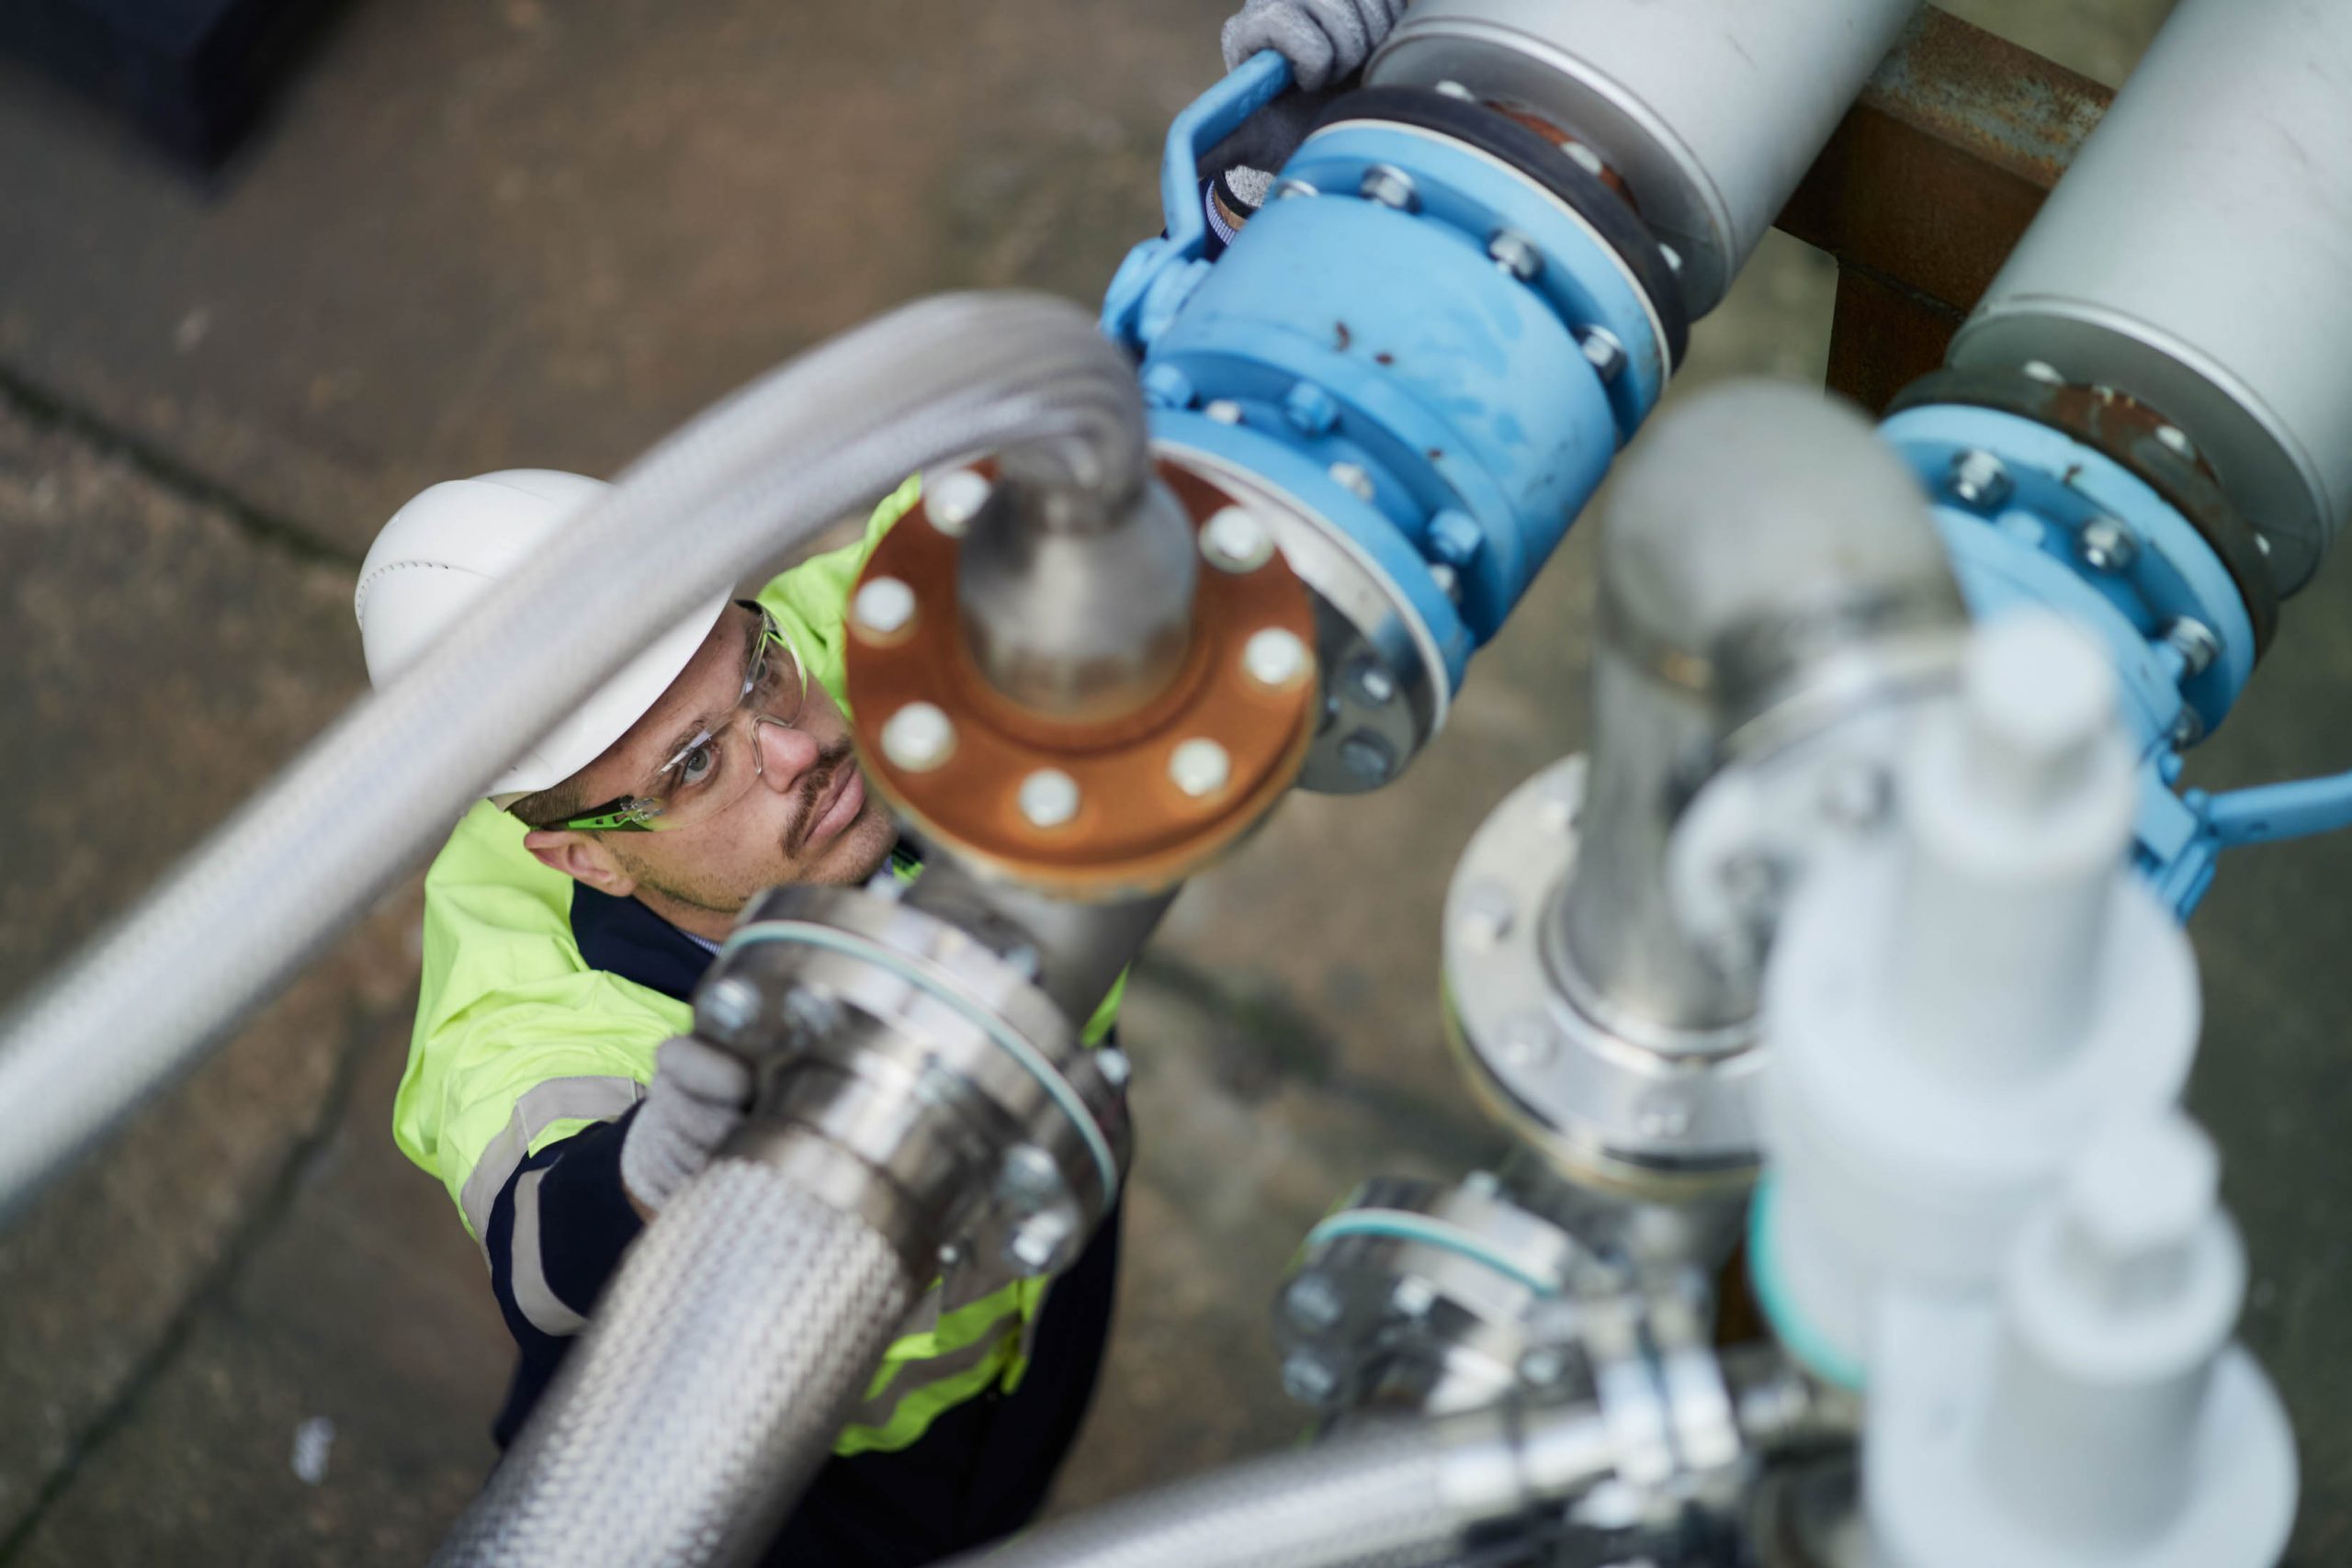
Innovation engineer inspects pilot carbon capture facility at Drax Power Station [Click to view/download]
Drax expects global demand for wood pellets to increase in the current decade, as other countries develop decarbonisation programmes which recognise the benefits of sustainable biomass for generation. Whilst there is an abundance of unprocessed sustainable biomass material globally, there remains limited capacity to convert these materials into energy dense pellets, which have a low-carbon footprint and lower cost associated with transportation. As a result, Drax expects the global market for biomass to remain under supplied. Drax is therefore exploring options to service biomass demand in Europe, North America and Asia alongside the UK. Establishing a presence in these markets could offer the potential for long-term offtake agreements, providing diversified revenues from other biomass markets.
Since publishing its half year results on 29 July 2020 the trading and operational performance of the Group has remained robust.
In the USA, the Group’s Pellet Production business is commissioning 100,000 tonnes of new production capacity at its Morehouse facility in Louisiana as part of its previously announced plans to add 350,000 tonnes across its three existing production sites by 2022. The project is part of the Group’s plan to expand its sustainable biomass supply chain and reduce costs.
The Generation business has continued to perform well in the provision of system support services, responding to both the low and high demand needs of the UK electricity system.
In addition to the successful completion of a major planned outage and upgrade of a biomass unit at Drax Power Station, the Group has progressed its earlier stage development work on BECCS. Alongside the commencement of a solvent trial with MHI, Drax has awarded pre-FEED (Front End Engineering Design) contracts and expects to incur incremental operating costs associated with the development of a full FEED study during 2021.
At its half year results in July 2020 Drax noted that further lockdown measures in the UK in the second half of 2020 could create a small downside risk on the performance of the Customers business, principally in the SME(8) market. Drax is continuing to assess operational and strategic options for this part of the Group.
The Group’s expectations for 2020 Adjusted EBITDA remain in line with market expectations(9), inclusive of the impact of Covid-19, principally in relation to its Customers business. Full year expectations for the Group remain underpinned by good operational availability for the remainder of 2020.
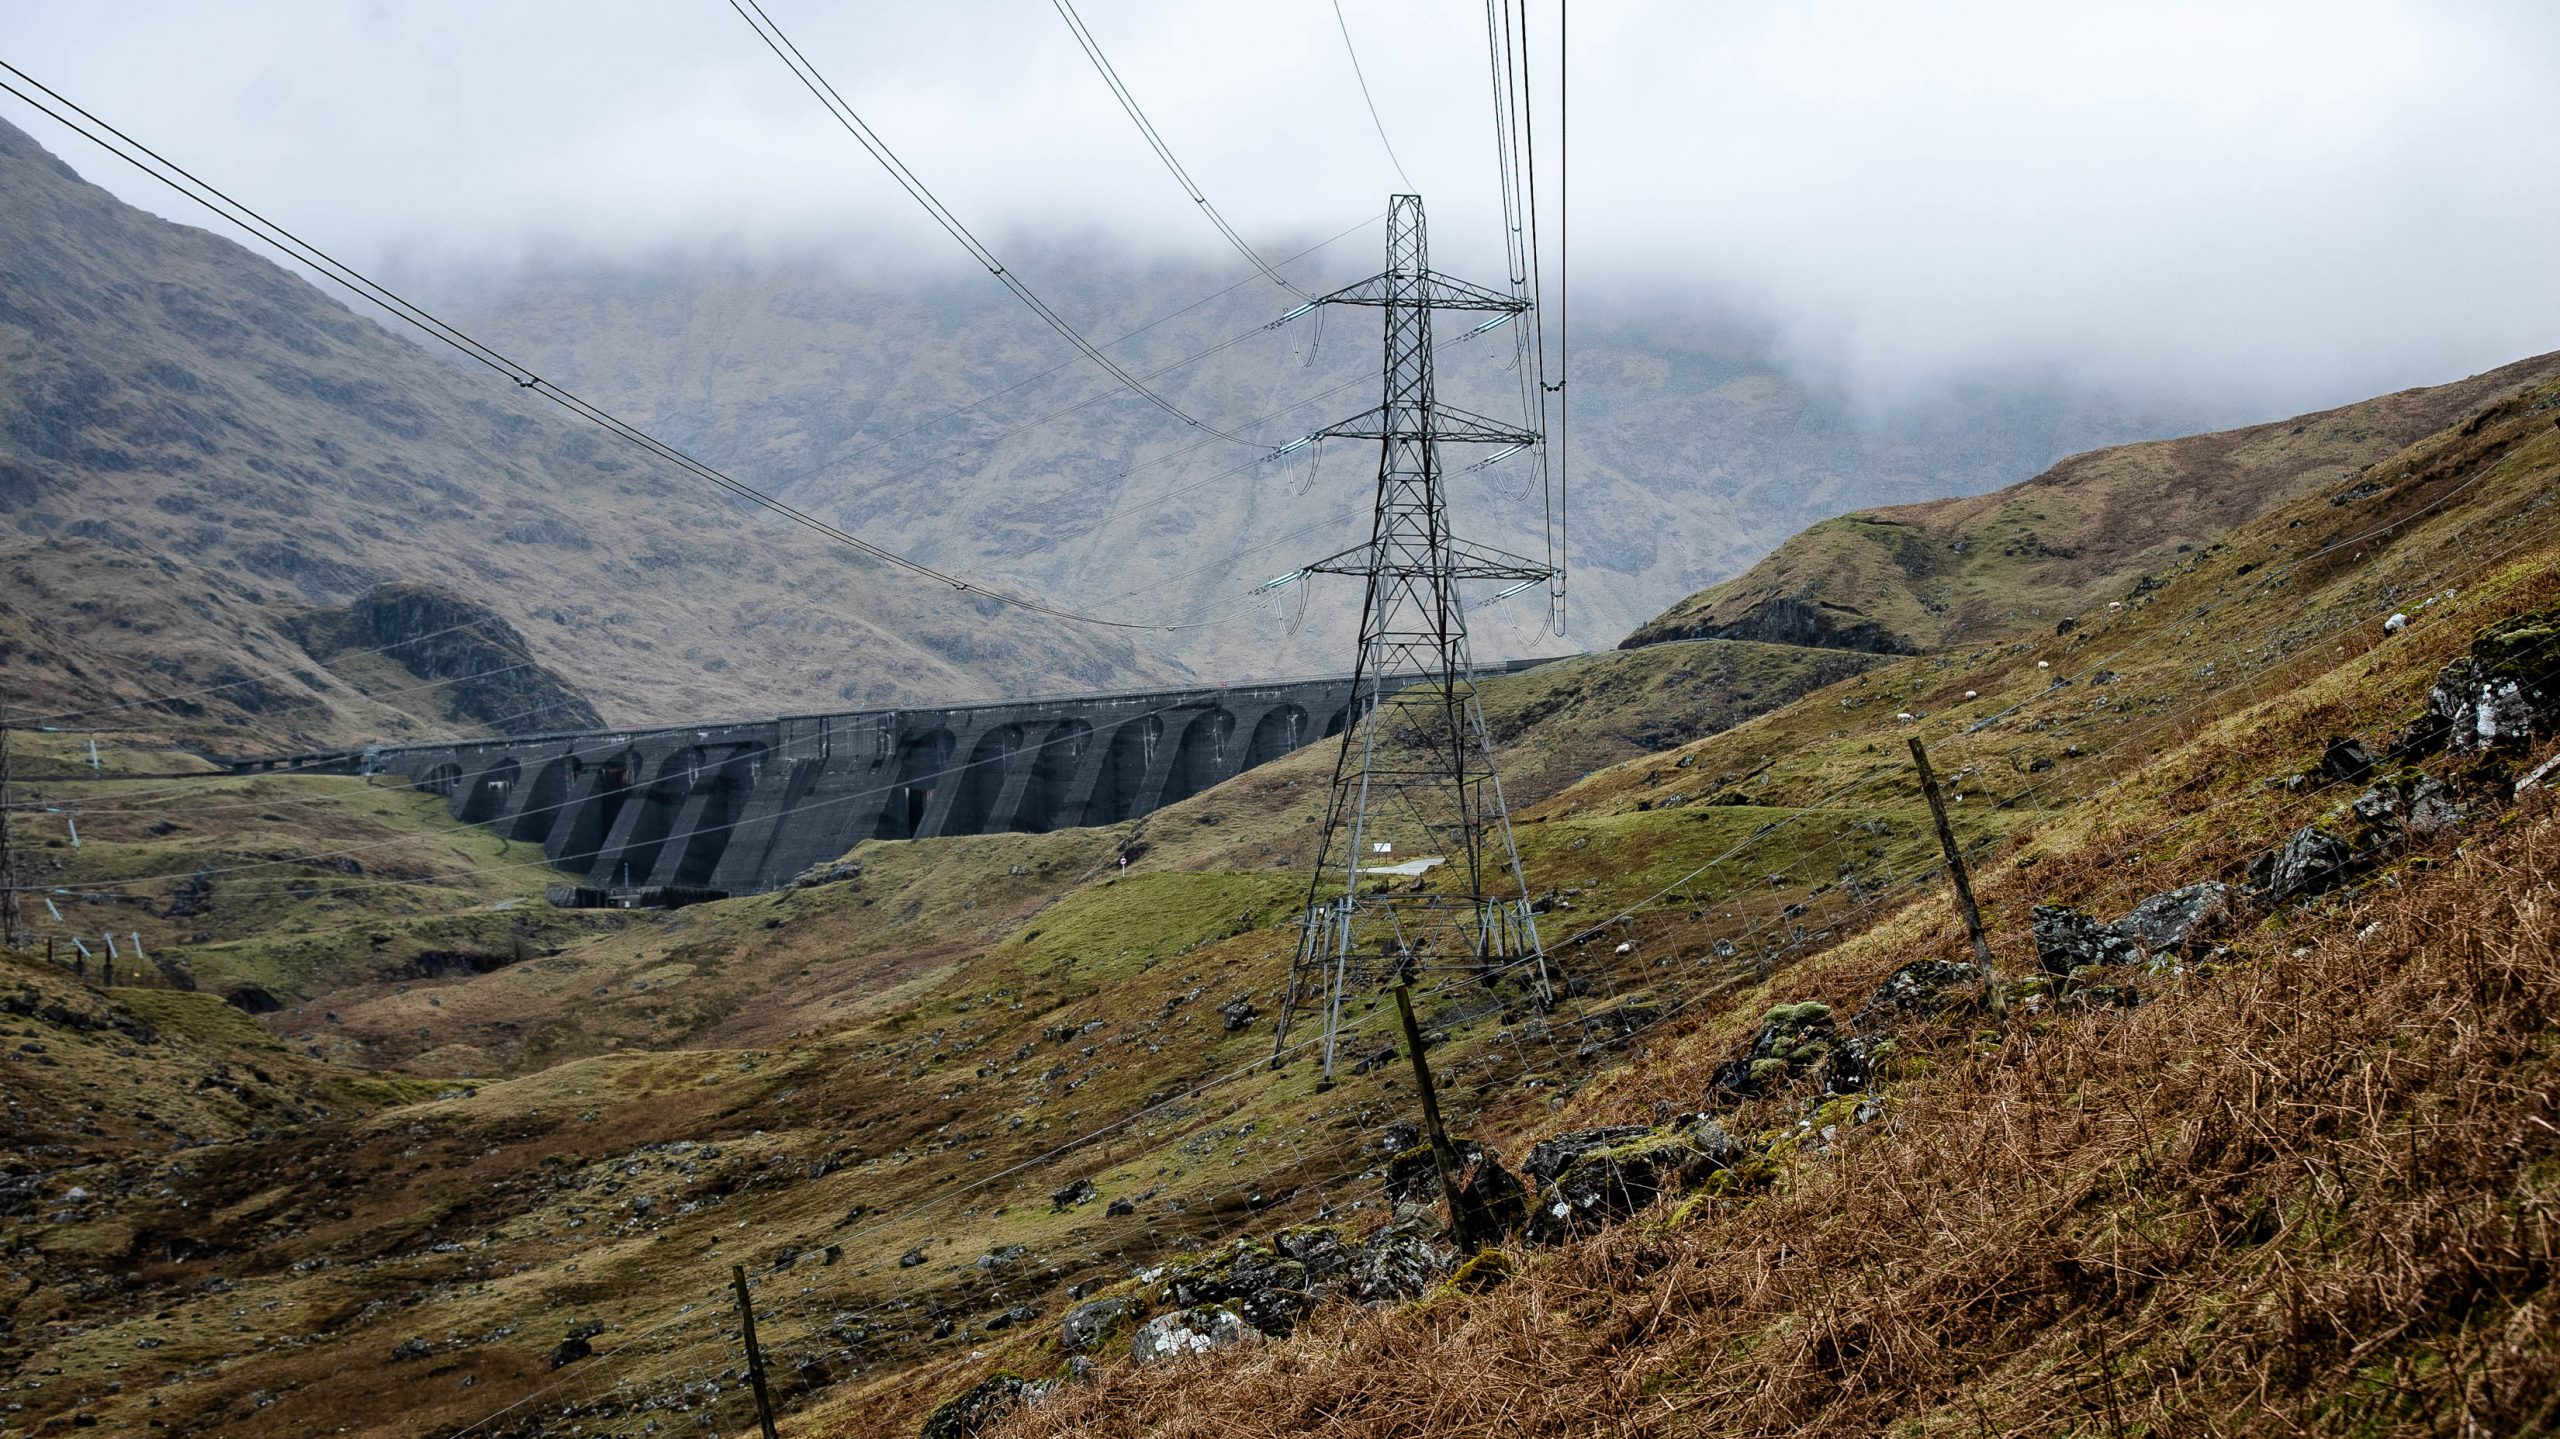
Electricity pylons take flexible power generated from water stored in a reservoir at Cruachan Power Station in the Highlands into the national grid [Click to view/download]
As announced on 19 November 2020 the Group agreed a new £300 million ESG(11) Revolving Credit Facility (RCF). This replaces an RCF which was due to mature in 2021 and provides increased liquidity, enabling the full facility to be drawn as cash (the previous facility restricted cash drawn to support liquidity to £165 million). The ESG RCF is currently undrawn for cash.
In addition to the ESG RCF, the Group has agreed new infrastructure facilities (£213 million) and a Euro denominated bond issue (€250 million), which replace an existing RCF, Sterling bond and ESG term-loan, reducing the Group’s overall cost of debt and extending its maturity profile to 2030.
As at 30 November 2020 Drax had adjusted cash and total committed facilities of £643 million.
The Group remains committed to its capital allocation policy, through which it aims to maintain a strong balance sheet; invest in the core business; pay a sustainable and growing dividend and return surplus capital beyond investment requirements.
Subject to the continued good operational performance and overall impact from Covid-19 remaining in line with the position Drax set out in April 2020, the Group continues to expect to pay a dividend for the 2020 financial year of 17.1 pence per share (approximately £68 million), a 7.5% increase on 2019. This is consistent with the policy to pay a dividend which is sustainable and expected to grow as the strategy delivers an increasing proportion of stable earnings and cash flows.
Drax Investor Relations:
Mark Strafford
Drax External Communications:
Ali Lewis
Website: www.drax.com/uk
ENDS
24 November 2020

For the UK to reach net zero CO2 emissions by 2050 and do its part in tackling the biggest challenge of our time, all sectors of the economy must reduce their emissions and do it quickly.
I believe the best approach to tackling climate change is through ‘co-benefit’ solutions: solutions that not only have a positive environmental impact, but that are economically progressive for society today and in the future through training, skills and job creation.
As an energy company, this task is especially important for Drax. We have a responsibility to future generations to innovate and use our engineering skills to deliver power that’s renewable, sustainable and that doesn’t come at a cost to the environment.
Our work on Zero Carbon Humber, in partnership with 11 other forward-thinking organisations, aims to deploy the negative emissions technology BECCS (bioenergy with carbon capture and storage), as well as CCUS (carbon capture, usage and storage) in industry and power, and ramp up hydrogen production as a low carbon fuel. These are all essential technologies in bringing the UK to net zero, but they are also innovative projects at scale that can benefit society and the lives of people in the Humber, and around the UK.
The Humber region has a proud history in heavy industries. What began as a thriving ship building hub has evolved to include chemicals, refining and steel manufacturing. However, these emissions-intensive industries have grown increasingly expensive to operate and many have left for countries where they can be run cheaper, leading to a decline in the Humber region.
If they are not decarbonised, these industries will face an even greater cost. By 2040, emitters could face billions of pounds per year in carbon taxes, making them less competitive and less attractive for international investment.
Deploying carbon capture and hydrogen are essential steps towards modernising these businesses and protecting up to 55,000 manufacturing and engineering jobs in the region.
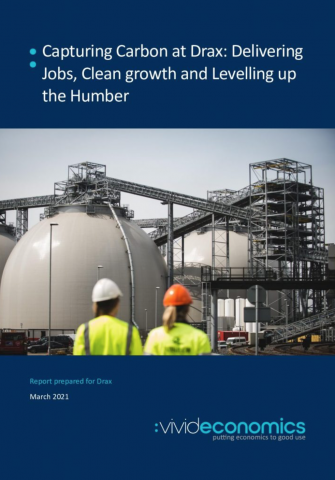
Capturing carbon at Drax: Delivering jobs, clean growth and levelling up the Humber. Click to view executive summary and case studies from Vivid Economics report for Drax.
A report by Vivid Economics commissioned by Drax, found that carbon capture and hydrogen in the Humber could create and support almost 48,000 new jobs at the peak of the construction period in 2027 and provide thousands of long term, skilled jobs in the following decades.
As well as protecting people’s livelihoods, decarbonisation is also a matter of public health. In the Humber alone, higher air quality could save £148 million in avoided public health costs between 2040 and 2050.
I believe the UK is well position to rise to the challenge and lead the world in decarbonisation technology. There is a clear opportunity to export knowledge and skills to other countries embarking on their own decarbonisation journeys. BECCS alone could create many more jobs related to exporting the technology and operational know-how and deliver additional value for the economy. As interest in negative emissions grows around the world, the UK needs to move quickly to secure a competitive advantage.
This is in many ways the start of a new sector in our economy – one that can offer new employment, earnings and economic growth. It comes at just the right time. Without intervention to spur a green recovery, the COVID-19 crisis risks subjecting long-term economic damage.
Being at the beginning of the industrial decarbonisation journey means we also have the power to shape this new industry in a way that spreads the benefits across the whole of the UK.
We’ve previously seen sector deals struck between the government and industry include equality measures. For example, the nuclear industry aims to count women as 40% of its employees by 2030, while offshore wind is committed to sourcing 60% of its supply chain from the UK.

Wind turbines at Bridlington, East Yorkshire
At present, the Humber region receives among the lowest levels of government investment in research and development in the UK, contributing to a pronounced skills gap among the workforce. In addition, almost 60% of construction workers across the wider Yorkshire and Humber region were furloughed as of August 2020.
A project such as Zero Carbon Humber could address this regional imbalance and offer skilled, long term jobs to local communities. That’s why I welcome the Prime Minister’s announcement of £1bn investment to support the establishment of CCUS in the Humber and other ‘SuperPlaces’ around the UK.
As the Government’s Ten Point Plan says, CCUS can ‘help decarbonise our most challenging sectors, provide low carbon power and a pathway to negative emissions’.
The co-benefits of BECCS extend beyond our communities in the UK. We aim to become carbon negative by 2030 by removing our CO2 emissions from the atmosphere and abating emissions that might still exist on the UK’s path to net zero.

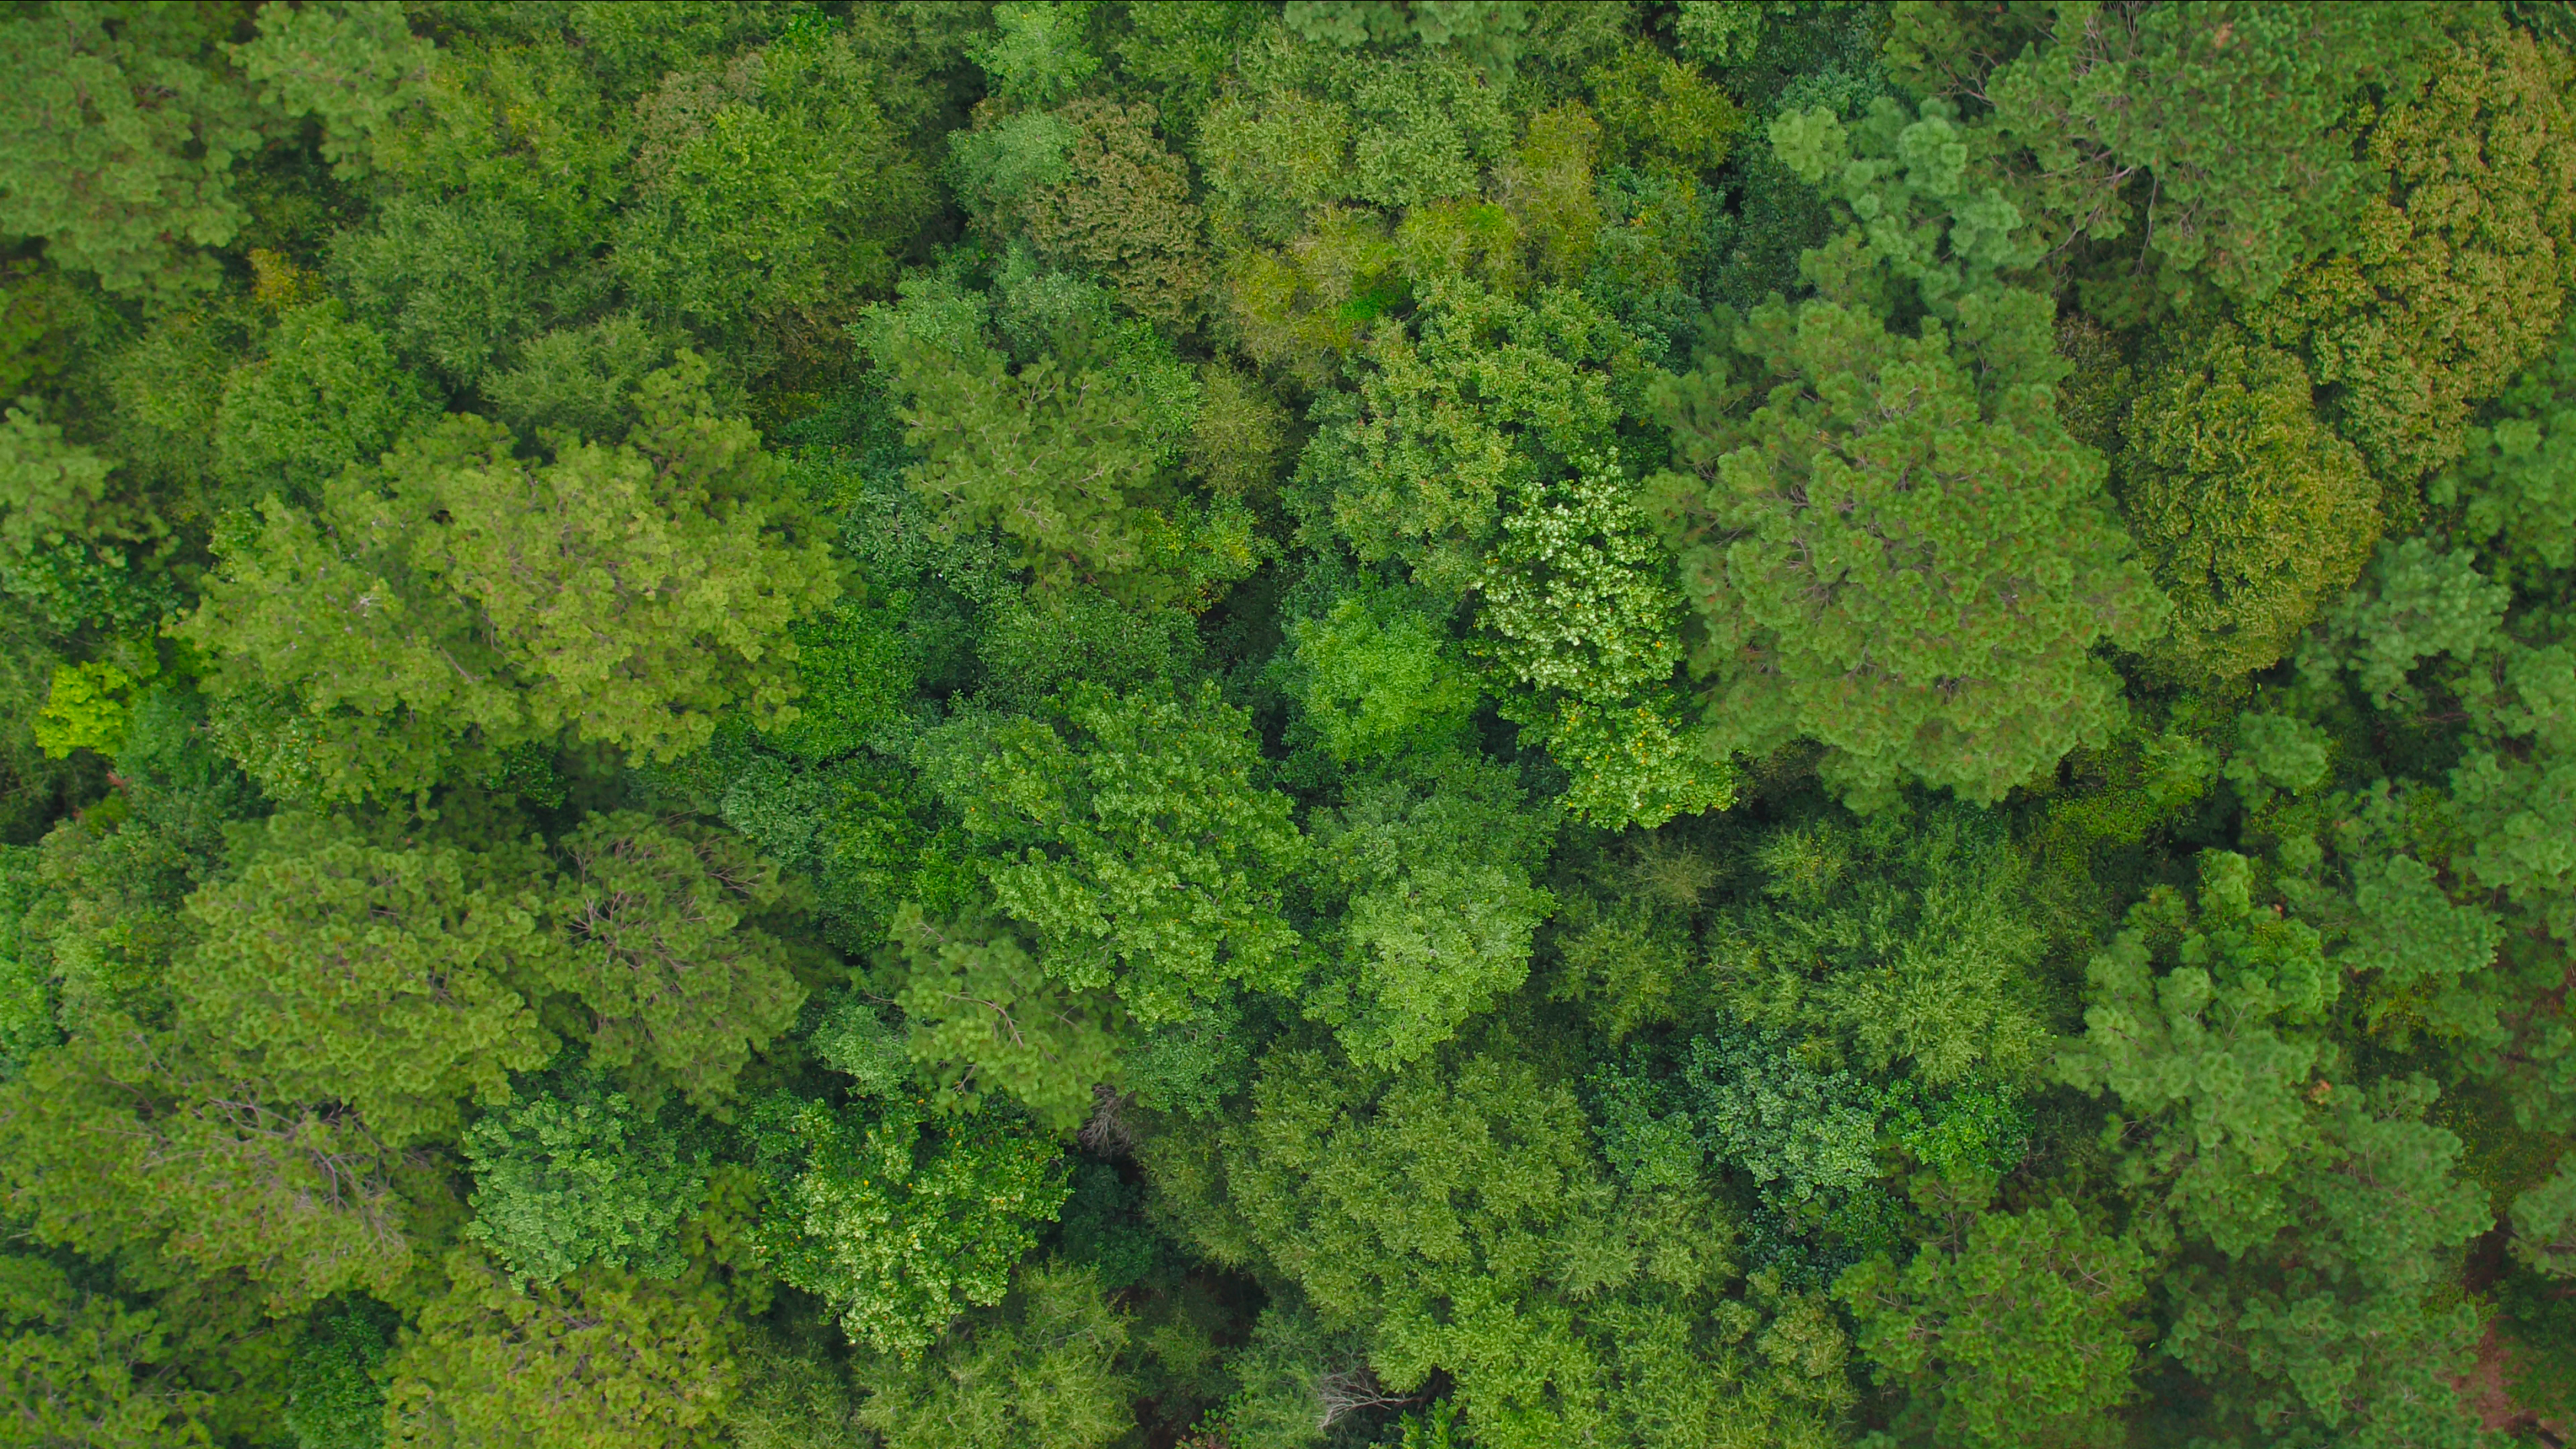
This ambition will only be realised if the biomass we use continues to be sourced from sustainable forests that positively benefit the environment and the communities in which we and our suppliers operate.
Engineer working in turbine hall, Drax Power Station, North Yorkshire
I believe we must continuously improve our sustainability policy and seek to update it as new findings come to light. We can help ensure the UK’s biomass sourcing is led by the latest science, best practice and transparency, supporting healthy, biodiverse forests around the world; and even apply it internationally.
Delivering deep decarbonisation for the UK will require collaboration from industries, government and society. What we can achieve through large-scale projects like Zero Carbon Humber is more than just the vital issue of reduced emissions. It is also about creating jobs, protecting health and improving livelihoods.
These are more than just benefits, they are the makings of a future filled with opportunity for the Humber and for the UK’s Green Industrial Revolution.
By implementing the Ten Point Plan and publishing its National Determined Contributions (NDCs) ahead of COP26 in Glasgow next year, the UK continues to be an example to the world on climate action.
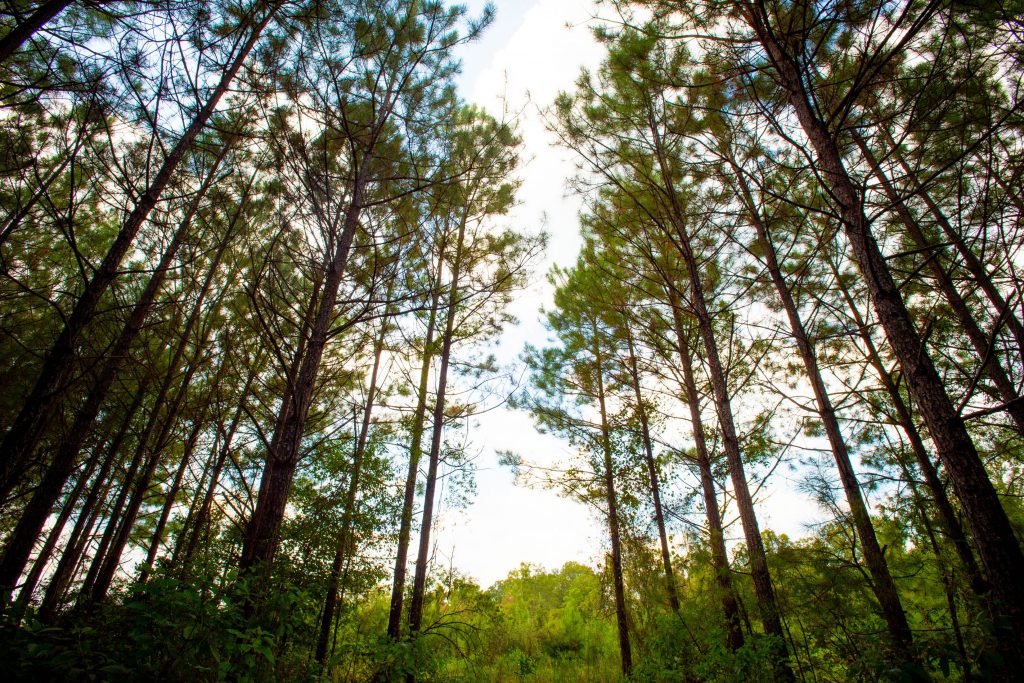
The seventh report in a series of catchment area analyses for Drax looks at the fibre sourcing area surrounding a number of compressed wood pellet plants operated by Georgia Biomass (now owned by Enviva) and Fram Renewable Fuels.
The evidence found in the report by Hood Consulting shows a substantial increase in forest inventory (stored carbon) and a relatively stable forest area. However, with continued pressure from urban development, future losses of timberland area are possible. Despite this, increasing growth rates can maintain and improve wood supply and carbon stock for the foreseeable future.
The overall inventory of growing stock in the catchment area has increased by 63 million cubic metres (m3) between 2000 and 2018, a growth of 19.3%. All of this increase has been in the pine area, which increased by nearly 68 million m3, whereas the hardwood species decreased in volume by 4.5 million m3. Overall, the inventory volume split by species in 2018 was 72% to 28% softwood to hardwood. The breakdown by product category is shown in Figure 3 below.
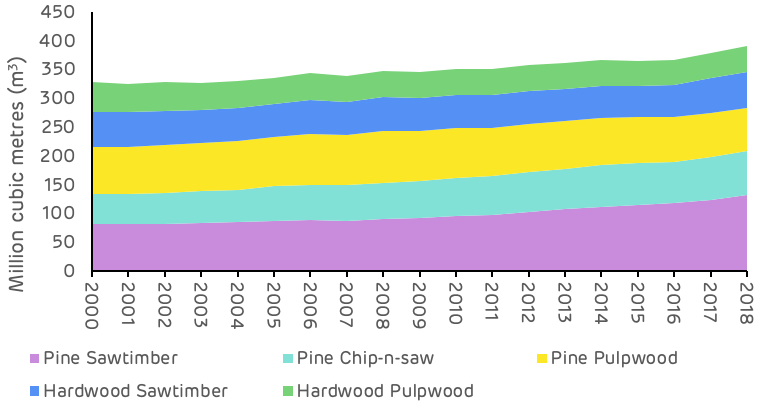
Figure 1: Change in growing stock by major product category and species (USFS)
The pine saw-timber and chip-n-saw product categories, larger dimension and higher value material, showed the largest increase in inventory, whereas pine pulpwood decreased in total volume. The most substantial change occurred from 2010 to 2018, where pulpwood went from an increasing trend to a decreasing trend and saw-timber increased in volume much more rapidly – this is shown in Table 1 and Figure 2 below.
Table 1: Change in growing stock volume by major product category (USFS)These changes are likely to reflect an increasing age class in the catchment area, with younger stands of pine (previously classed as pulpwood), growing into a larger size class and being reclassified as saw-timber. This means that the volume of saw-timber availability in future will be significantly higher, but pulpwood availability will be diminished. For pellet mill markets any loss in pulpwood availability can be compensated by an increase in sawmill residue production if market demand is maintained or increased.
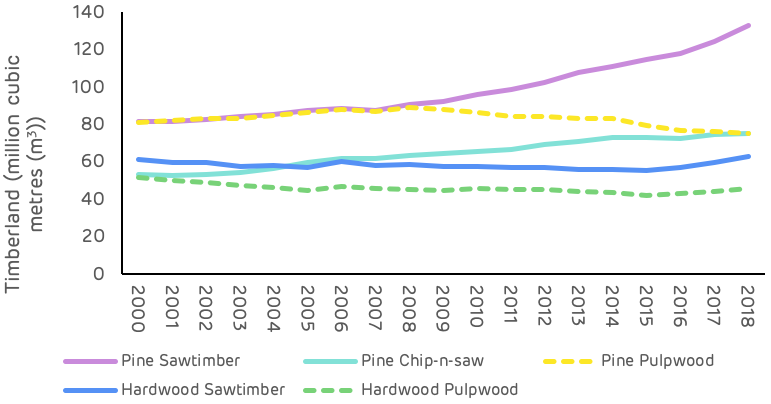
Figure 2: Change in growing stock by major product category and species (USFS)
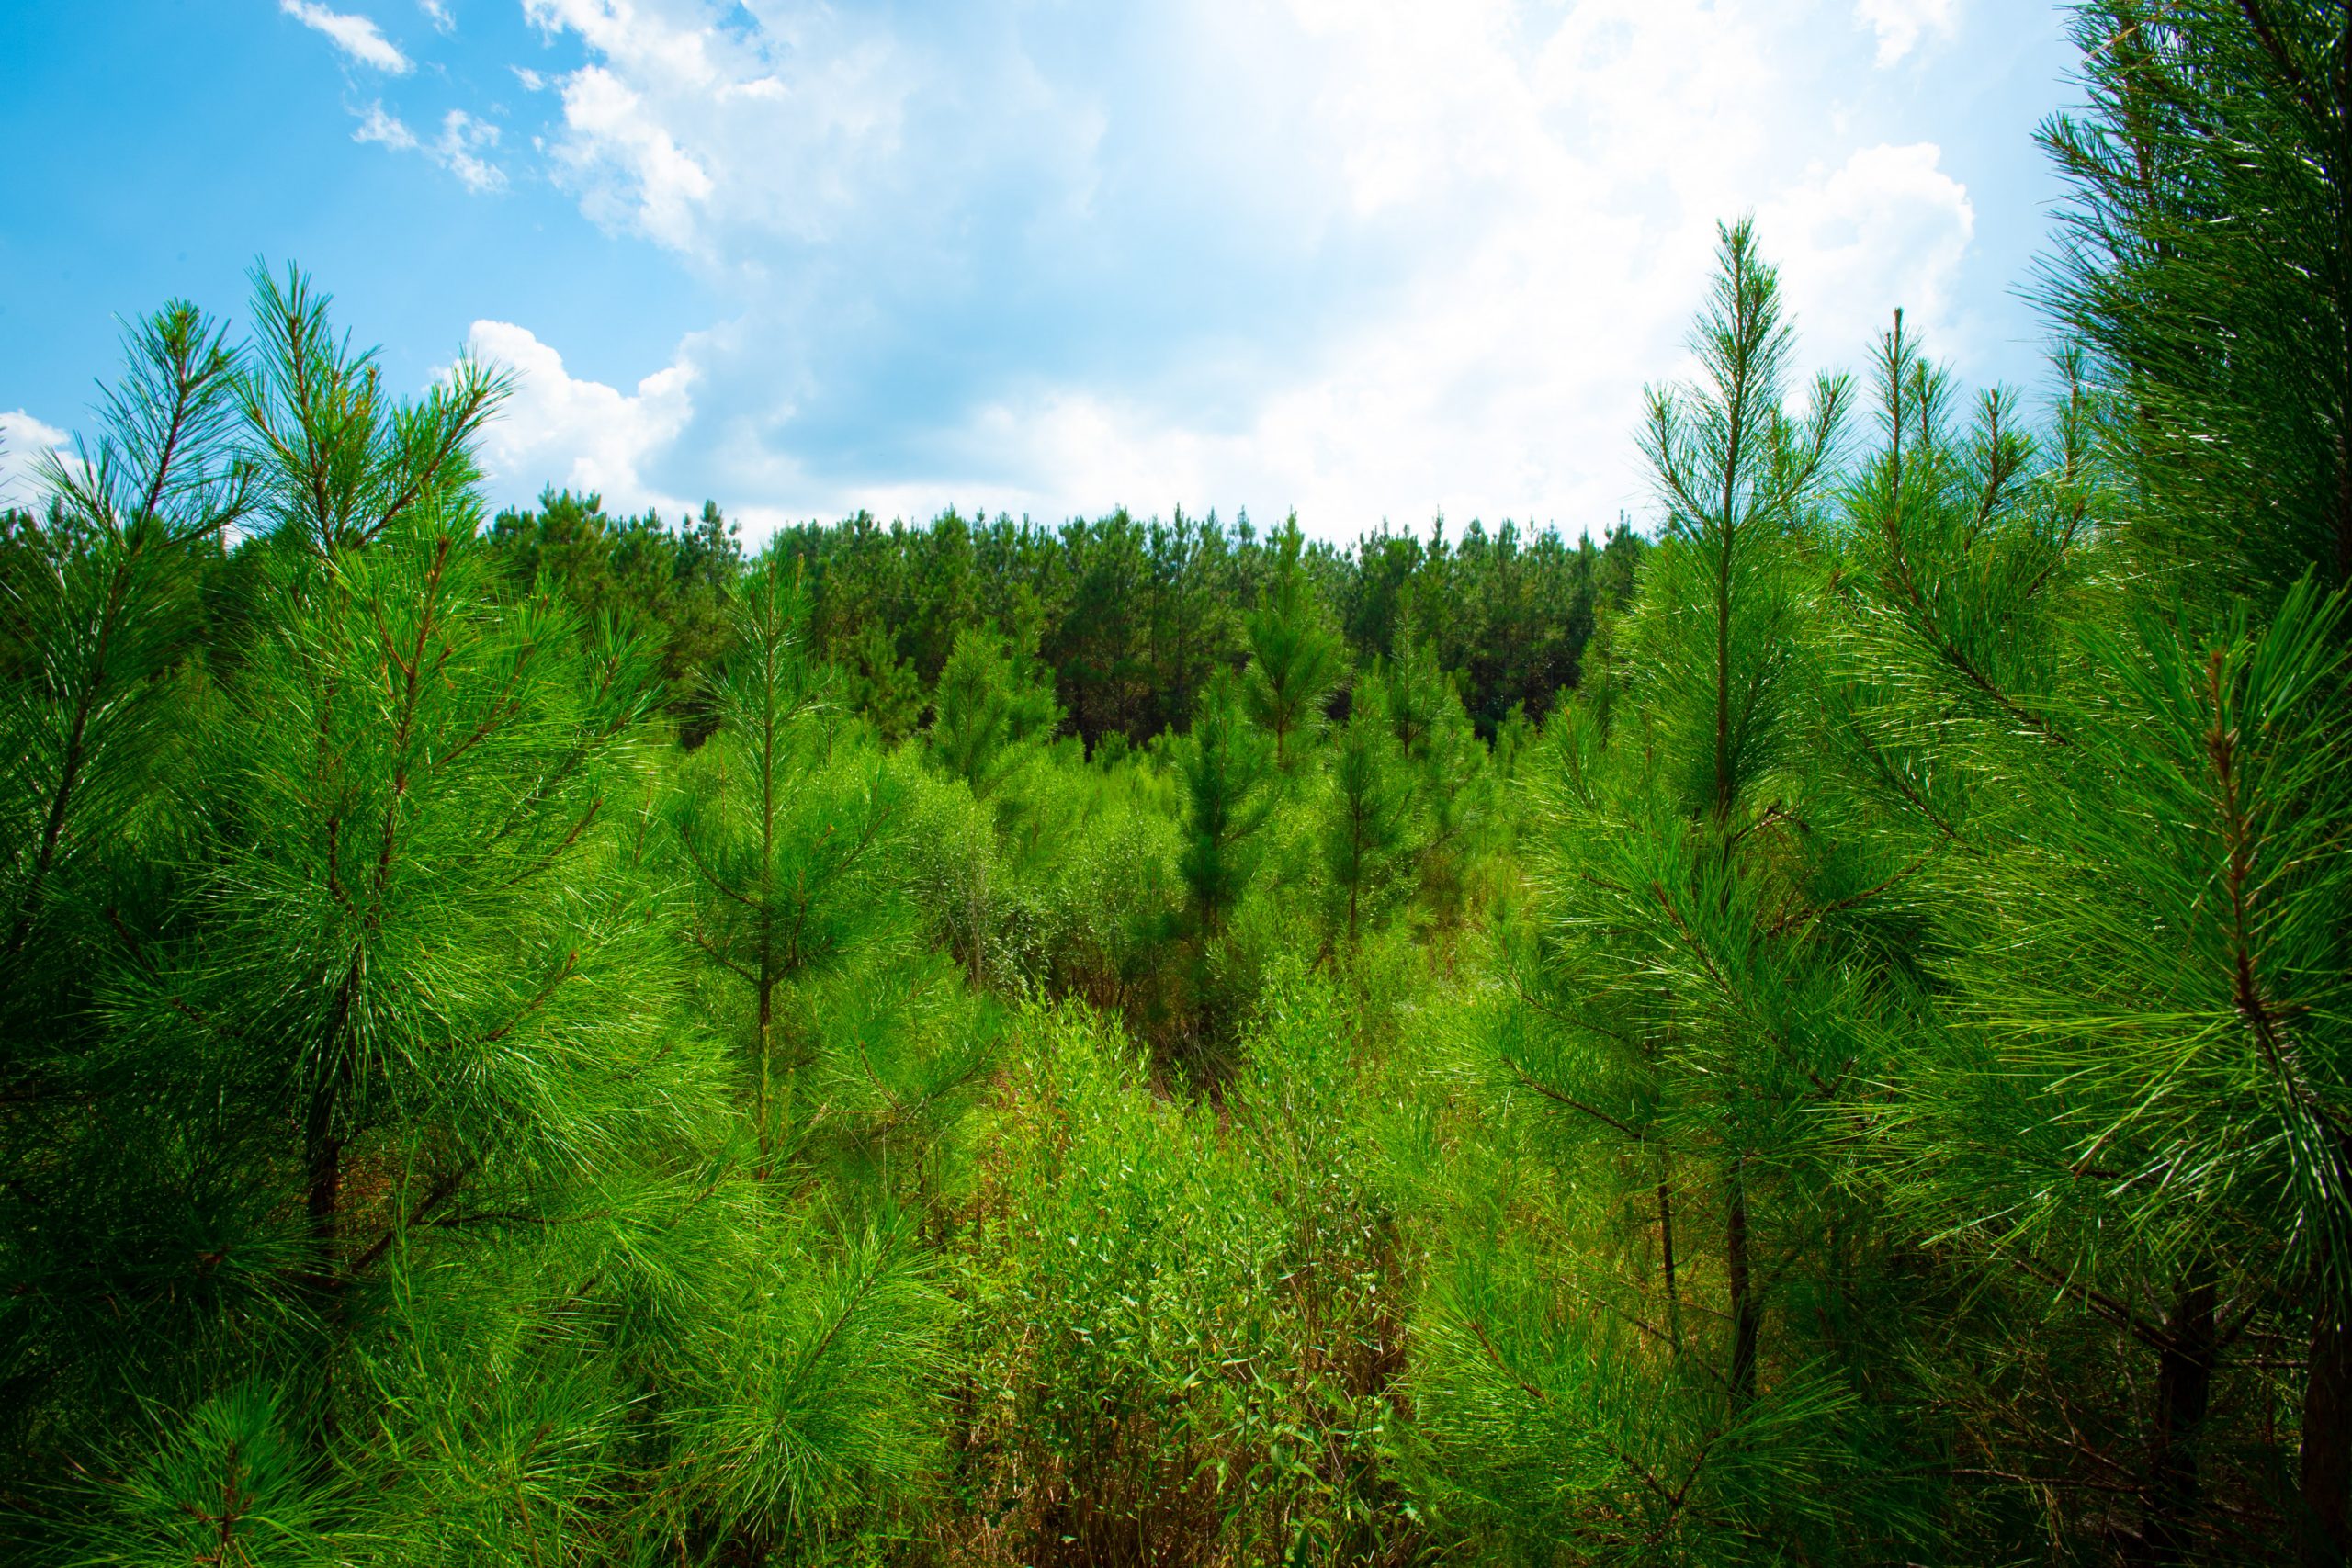
Growth rates for both softwood and hardwood species have been increasing since 2000 as shown in Figure 3 below. Softwood growth has increased by 18.5% since 2000 and hardwood by 1.4%. The improved softwood growth rate probably resulted from increased investment in the management of pine forests, the superior quality of seedlings and better management practice (ground preparation, weed control, fertilisation etc.). This is a very positive trend for the sequestration rate of carbon and also for providing landowners with the potential to increase revenue per hectare and encourage the retention and improved management of forests, rather than converting to other land uses. The Georgia catchment area is likely split between passive owners that do not actively manage, where growth rates are slower or decline and the incentive to convert land is greater, and owners that actively manage to improve growth and quality, increasing revenue and maintaining productive forest. There is likely to be a much greater differential in growth rate between these two management approaches than reflected by the trend in Figure 3, highlighting the importance of active management for carbon abatement.
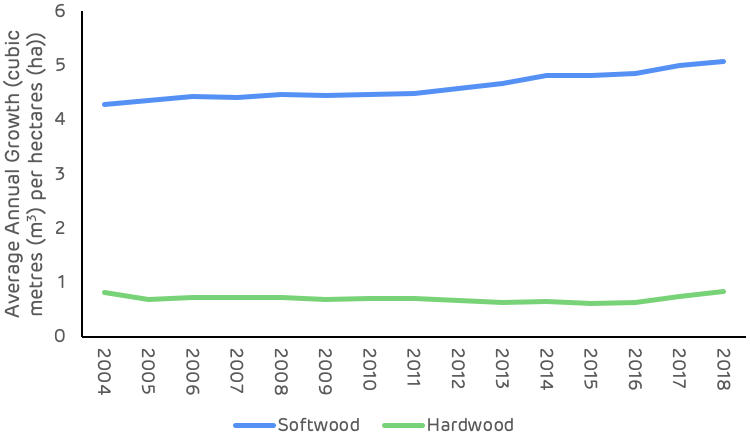
Figure 3: Average annual growth rate per hectare (USFS)
At a macro scale, the distribution of land use categories has remained relatively stable since 2000, with no apparent major shifts in land use. The timberland area around the seven mills has decreased by around 135 thousand hectares (ha) between 2000 and 2018 (2.3% of the total land area), whilst the area of arable and urban land increased by 98 thousand (1.7% of total area) and 158 thousand (2.7% of total area) ha respectively. In 2018, timberland represented 67% of total land area and all forest and woodland 80% of total area, down from 69% and 82% respectively in 2000 (Figure 1).
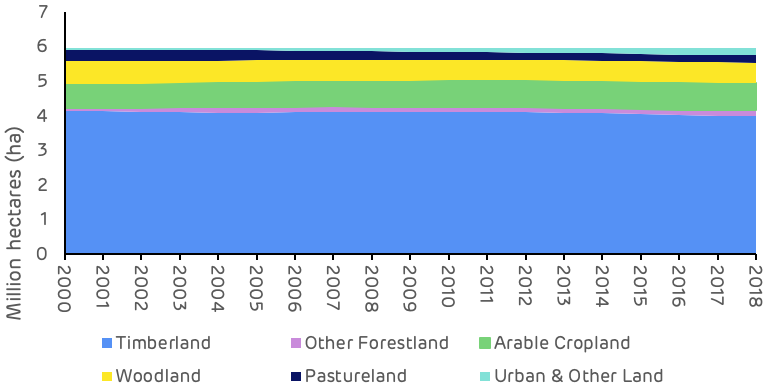
Figure 4: Change in land use category (USDA)
Looking at this change in land use more closely, the timberland area shows the most pronounced decline between 2010 and 2018, a drop of 117 thousand ha. The largest change in other land use categories over this period was an increase of 97 thousand ha in urban and other land, suggesting that a large proportion of the timberland area has been converted to urban areas.
The most significant change in agricultural land occurred prior to 2010, when the timberland area remained relatively stable, this change appears to have involved the transition of pastureland to arable crops. There may also have been some reclassification of forest and woodland types, with a decrease in the area of woodland and an increase in forestland during the period between 2000 and 2010 (Table 2).
Table 2: Timing of land use change in Georgia catchment area (USDA)These trends are also clear and apparent in Figure 3 below which shows the sharp decline in timberland area, albeit small in absolute area relative to the total catchment area size, and the steady increase in urban land. Georgia ranks 8th in the list of US States and territories by total population with 10.6 million and 17th by population density at 184 per square mile (mi2) compared to just 63 per mi2 in Mississippi where Drax’s Amite Bioenergy (ABE) pellet plant is located and 108 per mi2 in Louisiana where the Morehouse Bioenergy (MBE) and LaSalle Bioenergy (LBE) mills are located (US Census Bureau). This population pressure and increased development can lead to more forest loss and land use change.
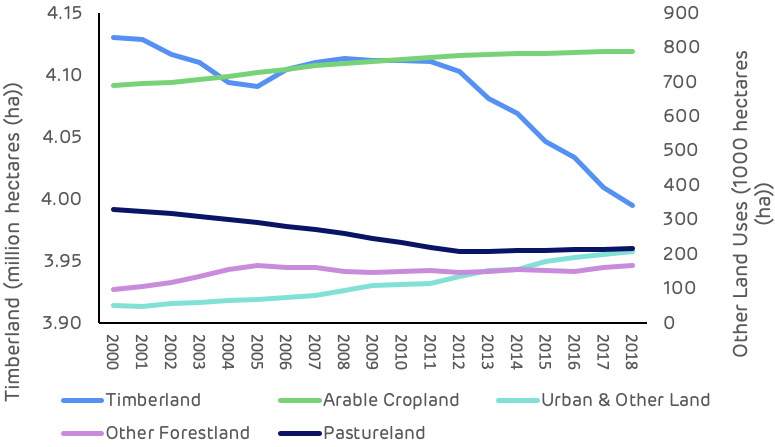
Figure 5: Trends in major land use categories (USDA)
Drax’s suppliers in the Georgia catchment area have made a commitment not to source wood from areas where land use change is taking place. This commitment is monitored and verified through the Sustainable Biomass Program (SBP) certification process that is maintained by each mill. Any land use change in the catchment area is likely to be a result of prevailing economic drivers in the region rather than due to actions being taken by the pellet producers.
Strong markets are essential for ensuring that forests are managed and restocked to optimum benefit, sawlog markets are particularly important as this is highest revenue stream for forest owners. Figure 6 shows the trend in market demand for each major product category since 2000 and demonstrates the recent increase in softwood sawlog demand as the US economy (particularly housing starts) recovered from the global recession at the end of the last decade. Softwood pulpwood demand increased through the 2000s but has remained relatively stable since 2011, with the exception of a peak during 2018 which resulted from an increase in volume generated by salvage operations after hurricane Michael.
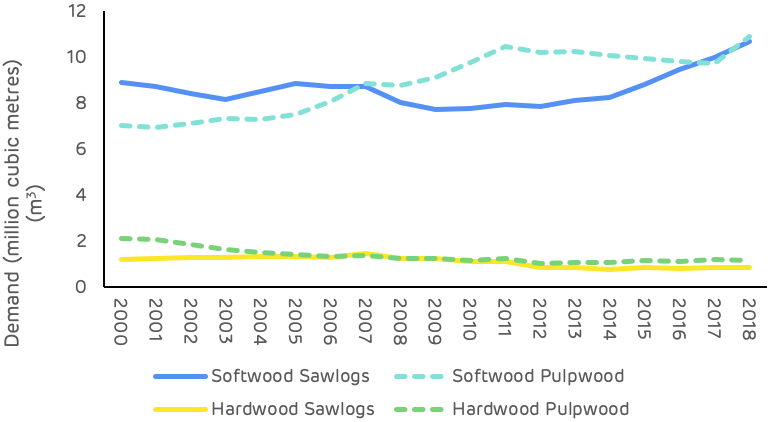
Figure 6: Demand for wood products (USFS, TMS)
The comparison of average annual growth and removals in the Georgia catchment area is much more tightly balance than in Drax’s other supply regions, as shown in Figure 7. Since 2000 the average annual surplus of growth has been around 3.6 million m3 with both demand and growth increasing in recent years.
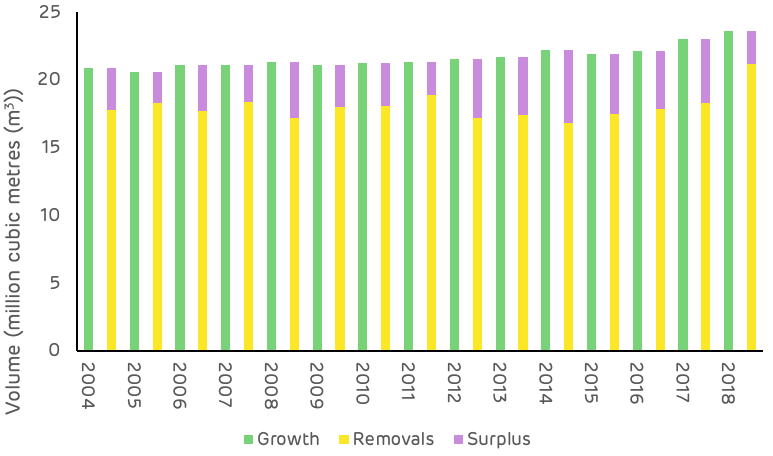
Figure 7: Average annual growth, removals and surplus (USFS)
As shown in Figures 2 & 3, growth rates are strong and inventory is increasing, this is not a problem in the Georgia area. The relatively small surplus, as compared to other catchment areas in the US South, is due to the higher concentration of wood fibre markets and the more intense forest industry activity in this region. As of July 2020, there were over 50 major wood-consuming mills operating within the Georgia catchment area and an additional 80+ mills operating within close proximity, overlapping the catchment area. Total pulpwood demand in 2019 was 12.9 million tons, of which approximately 87% was attributed to non‐bioenergy‐related sources (predominantly pulp/paper) and 13% was attributed to the bioenergy sector. Given the bio-energy sector’s low ranking position in the market (with the lowest ability to pay for fibre), combined with the relatively small scale in demand compared to the pulp and paper industry, the influence of biomass markets can be considered to be minimal in this region, particular when it comes to impacts on wood prices and forest management practice.
Pine sawtimber prices suffered a significant decline between 2000 and 2010, dropping almost $21 per ton as a result of the global financial crisis and the decline in demand due to the collapse in housing markets and construction (Table 3). Since 2010 pine sawtimber has remained relatively stable, with some minor fluctuations shown in Figure 8 below.
Table 3: Stumpage price trends (TMS)Pine pulpwood prices have been on a generally increasing trend since 2000, with a more significant increase since 2011. This increase does not reflect an increase in demand or total volume, which has remained relatively stable over this period, but a shifting of the geographic distribution of the market with some new mills opening and old mills closing, resulting in increased competition in some localised fibre baskets and leading to an overall increase in stumpage price.
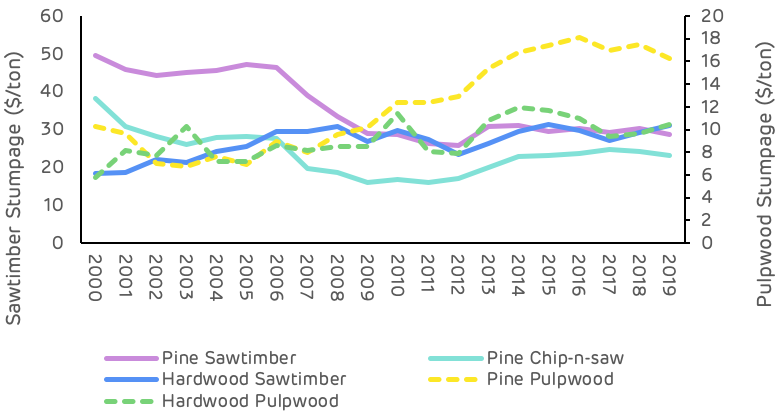
Figure 8: Stumpage price trends (TMS)
Figure 9 below shows that, with the exception of the hurricane salvage volume in 2018, pulpwood removals have declined or remained relatively stable since 2010, whereas pulpwood stumpage prices increased by 41% from 2010 to 2018.
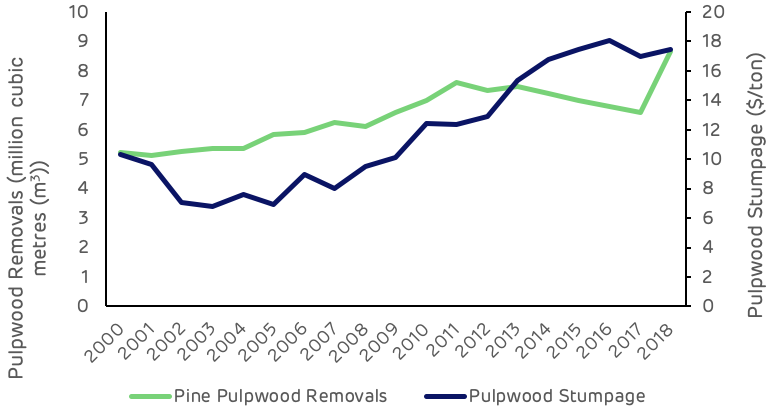
Figure 9: Pulpwood demand and stumpage price (USFS, TMS)
Comparing this stumpage price trend with other catchment areas of the US South (Figure 10), where Drax sources wood pellets, the Georgia area is on average 35% higher than the next highest area (Chesapeake) and 87% higher than the lowest cost area (Amite Bioenergy in Mississippi). This price differential is predominantly due to the scale of demand and availability of surplus low-grade fibre.
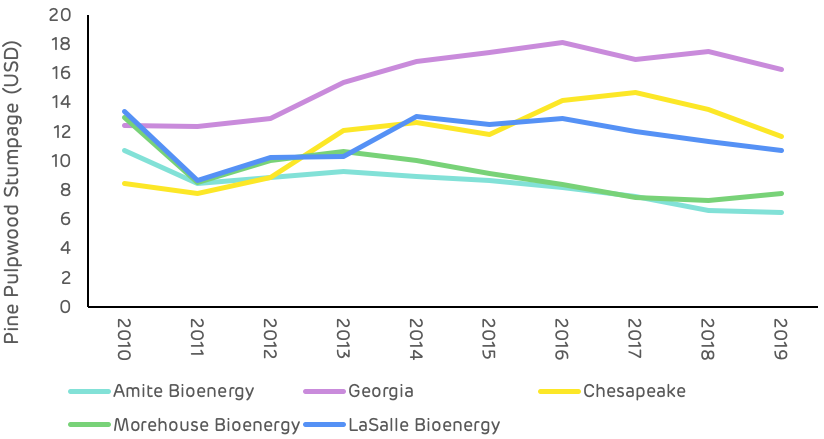
Figure 10: Comparison of pine pulpwood stumpage prices in Drax supply areas US South (TMS)
Deforestation?
No. US Forest Service (USFS) data shows a 108,130-hectare (-2.6%) decrease in total timberland in the Georgia catchment area since Georgia Biomass’ first full year of production in 2012. Specifically, this loss in total area of timberland coincided with a more than 21,000-hectare increase in cropland/pastureland and a more than 73,000-hectare increase in urban land and land classified as having other uses.
However, there is little evidence to suggest that increased wood demand from the bioenergy sector has caused this decrease in total timberland. Furthermore, pine timberland – the primary source of roundwood utilized by the bioenergy industry – has increased more than 17,000 hectares in the catchment area since 2016.
A change in management practices (rotation lengths, thinnings, conversion from hardwood to pine)?
No. Changes in management practices have occurred in the catchment area over the last two decades. However, there is little evidence to suggest that bioenergy demand, which accounts for roughly 10-14% of total pulpwood demand (and only 5-7% of total wood demand in the catchment area), has caused or is responsible for these changes.
Clearcuts and thinnings are the two major types of harvests that occur in this region, both of which are long-standing, widely used methods of harvesting timber. TimberMart-South (TMS) data shows that thinnings accounted for 67% of total reported harvest area in the southeast Georgia market from 2000-2010, but only 43% of total harvest area reported from 2012-2019. Specifically, this downward shift was initiated by the bursting of the US housing bubble in the mid-2000s and had been completed by the early 2010s. We’d like to note that this shift coincided with a nearly 50% decrease in pine sawtimber stumpage price from 2006-2012. This is important because the strength of pine sawtimber markets had been a driving force behind timber management decisions in this region in the early and mid-2000s.
Also, contributing to the decreased prevalence of thinnings was the strengthening of pine pulpwood markets in the mid-2000s, as pine pulpwood stumpage prices increased more than 40% in the Georgia catchment area from 2003-2008. So, with sawtimber markets continuing to weaken and pulpwood markets doing just the opposite, the data suggests that many landowners decided to alter their management approach (to take advantage of strong pulpwood markets) and focus on short pulpwood rotations that typically do not utilize thinnings.
Ultimately, the shift in management approach that occurred in this market can be linked to the weakening of one type of timber market and the strengthening of another. In the early and mid-2000s, timber management was focused on sawtimber production – a type of management that utilizes thinnings. However, for more than a decade now, this market has been driven to a large degree by the pulp/paper industry, with a significant portion of the timber management in this area focused on short pulpwood rotations.
Diversion from other markets?
No. Demand for softwood (pine) sawlogs increased an estimated 39% in the Georgia catchment area from 2011-2019. Also, increased bioenergy demand has caused no diversion from other pulpwood markets (i.e. pulp/paper), as pulpwood demand not attributed to bioenergy held steady and remained nearly unchanged from 2012-2017 before increasing in 2018 and 2019 due to the influx of salvage wood brought about by Hurricane Michael.
We’d like to make special note that increased demand for softwood sawlogs since 2011 has not resulted in a full pine sawtimber (PST) stumpage price recovery in this market. Reduced demand for softwood sawlogs in the late 2000s and early 2010s resulted in oversupply, and this oversupply has remained, despite increased demand the last 6-8 years. As a result, PST stumpage prices have held steady and averaged roughly $30 per ton in the catchment area since 2013 – down approximately 35% from the 2000-2006 average of more than $46 per ton, but up roughly 15% from the 2011-2012 average of approximately $26 per ton.
An unexpected or abnormal increase in wood prices?
No / Inconclusive. The delivered price of pine pulpwood (PPW) – the primary roundwood product consumed by both Georgia Biomass and Fram – increased 26% in the Georgia catchment area over the six years directly following the startup of Georgia Biomass, increasing from $29.16 per ton in 2011 to $36.63 per ton in 2017. And while this 26% increase in delivered PPW price coincided with a roughly 1.1 million metric ton increase in annual pine pulpwood demand from Georgia Biomass and Fram, total demand for pine pulpwood (from both bioenergy and other sources) actually decreased 7% over this period. Moreover, evidence suggest that this increase in PPW price is more closely linked to changes in wood supply, specifically, the 9% decrease in PPW inventory from 2011-2017.
However, there is evidence that links increased demand from the bioenergy sector to an increase in secondary residual (i.e. sawmill chips, sawdust, and shavings) prices. Specifically, the price of pine sawmill chips – a residual feedstock utilized by the bioenergy industry for wood pellet production – held steady and averaged approximately $26 per ton in the Georgia catchment area from 2008-2012. However, from 2012-2016, pine sawmill chip prices increased more than 15% (to $29.55 per ton in 2016). This increase in price coincided with annual pine residual feedstock purchases by Georgia Biomass and Fram increasing from roughly 325,000 metric tons to nearly 1.0 million metric tons over this period. However, note that pine sawmill chip prices have held steady and averaged roughly $29.50 per ton in the catchment area since 2016, despite further increases in pine secondary residual purchases by Georgia Biomass and Fram (to more than 1.2 million metric tons in 2019).
Ultimately, the data suggests that any excess supply of pine secondary residuals in the catchment area was absorbed by the bioenergy sector in the early and mid-2010s, and the additional demand/competition placed on this market led to increased residual prices. However, the plateauing of residual prices since 2015 along with the continued increase in secondary residual purchases by Georgia Biomass and Fram further suggest that an increasing percentage of secondary residual purchases by the bioenergy sector is sourced from outside the catchment area. Specifically, Fram confirmed this notion, noting that 35-40% of its secondary residual purchases come from outside the Georgia catchment area (from six different states in the US South).
A reduction in growing stock timber?
No. Total growing stock inventory in the catchment area increased 11% from 2011 through 2018, the latest available. Specifically, over this period, inventories of pine sawtimber and chip-n-saw increased 35% and 13%, respectively. However, pine pulpwood inventory decreased 11% from 2011-2018.
Note that the decrease in pine pulpwood inventory was not due to increased demand from bioenergy (or other sources) or increased harvesting above the sustainable yield capacity of the forest area – as annual growth of pine pulpwood has exceeded annual removals every year since 2011. Rather, this decrease can be linked to the 24% decline in pine sawtimber removals that occurred from 2005-2014 (due to the bursting of the US housing bubble and Great Recession that followed). In this region, timber is typically harvested via clearcut once it reaches maturity (i.e. sawtimber grade), after which the stand is reestablished, and the cycle repeated. However, with the reduced harvest levels during this period also came a reduction in newly reestablished timber stands – the source of pine pulpwood. So, with less replantings occurring during this period, inventories of pine pulpwood were not replenished to the same degree they had been previously, and therefore this catchment area saw a reduction in pine pulpwood inventory levels.
However, according to the US Forest Service, annual removals of pine sawtimber have increased 50% in the Georgia catchment area since 2014, which would suggest higher clearcut levels and increased stand reestablishment. TimberMart-South data also supports this assertion, as clearcut harvests have constituted approximately 60% of the total harvest area reported to TimberMart-South in this region since 2014, compared to 40% from 2005-2014. Ultimately, these increases in clearcut (and stand reestablishment) levels may not be reflected in increased pine pulpwood inventory levels in the short term – as it can take more than 10 years for a pine seedling to become merchantable and reach the minimum diameter requirements to be classified as pulpwood. However, adequate supply levels are expected to remain in the meantime. Furthermore, pine pulpwood inventory levels are expected to increase in the mid-to-long terms as a result of the increased harvest levels and stand reestablishment levels that have occurred in the catchment area since 2014.
A reduction in the sequestration rate of carbon?
No / Inconclusive. US Forest Service data shows the average annual growth rate of total growing stock timber has remained nearly unchanged (holding between 6.0% and 6.1%) in the catchment area since 2011, which would suggest that the sequestration rate of carbon has also changed very little in the catchment area the last 8-10 years. However, the 11% increase in total growing stock inventory since 2011 does indicate that total carbon storage levels have increased in the Georgia catchment area since Georgia Biomass commenced operations in this market.
An increase in harvesting above the sustainable yield capacity of the forest area?
No. Growth-to-removals (G:R) ratios, which compare annual timber growth to annual harvests, provides a measure of market demand relative to supply as well as a gauge of market sustainability. In 2018, the latest available, the G:R ratio for pine pulpwood, the predominant timber product utilized by the bioenergy sector, equaled 1.06 (a value greater than 1.0 indicates sustainable harvest levels). Note, however, that the pine pulpwood G:R ratio averaged 1.44 from 2012-2017. The significant drop in 2018 was due to a 31% increase in removals (due to Hurricane Michael) and is not reflective of the new norm. Specifically, pine pulpwood removals are projected to be more in line with pre-2018 levels in 2019 and 2020, and so too is the pine pulpwood G:R ratio.
Timber growing stock inventory
Neutral. According to USFS data, inventories of pine pulpwood decreased 11% in the catchment area from 2011-2018. However, that decrease was not due to increased demand from bioenergy. Typically, a reduction in inventory is linked to harvest levels above the sustainable yield capacity of the forest area, but in this case, annual growth of pine pulpwood exceeded annual removals every year during this period.
Ultimately, the decrease in pine pulpwood inventory from 2011-2018 can be linked to decreased pine sawtimber production beginning in the mid-2000s. Specifically, annual removals of pine sawtimber decreased 24% from 2005-2014, and the reduction in harvest levels during this period meant fewer new pine stands were reestablished, and that has led to the current reduction in pine pulpwood inventory. (Note that the decrease in pine sawtimber removals from 2005-2014 was mirrored by a 27% increase in pine sawtimber inventory over this same period). However, USFS data shows that annual removals of pine sawtimber have increased 50% in the Georgia catchment area since 2014, which suggests that pine pulpwood inventory levels will start to increase in the catchment area due to increased harvest levels and the subsequent increase in stand reestablishment levels.
Timber growth rates
Neutral. Timber growth rates have increased for both pine sawtimber and pine chip-n-saw but decreased slightly for pine pulpwood in the catchment area since 2011. Evidence suggests that this decrease in pine pulpwood growth rate is not due to increases in bioenergy demand, but rather linked to changes in diameter class distribution and indicative of a forest in a state of transition, where timber is moving up in product class (i.e. pine pulpwood is moving up in classification to pine chip-n-saw).
Forest area
Neutral. In the Georgia catchment area, total forest area (timberland) decreased more than 115,000 hectares (-2.8%) from 2011 through 2018. Note that this decrease coincided with a roughly 19,000-hectare increase in cropland and 93,000-hectare increase in urban land and land classified as having other uses.
Specifically, pine timberland, the primary source of roundwood utilized by the bioenergy industry, decreased over 34,000 hectares from 2011-2016. However, from 2016-2018, pine timberland stabilized and rather increased more than 17,000 hectares in the catchment area (or a net decrease of roughly 17,000 hectares from 2011-2018). Ultimately, there is little evidence that the decrease in pine timberland from 2011-2016 or increase since 2016 is linked to increased bioenergy demand. Rather, the overall decrease in pine timberland since 2011 appears to be more closely linked to the relative weakness of pine sawtimber markets in the Georgia catchment area and the lack of return from sawtimber.
Wood prices
Positive / Negative. Intuitively, an increase in demand should result in an increase in price, and this is what the data shows in the Georgia catchment area as it relates to increased biomass demand from Georgia Biomass and Fram and the prices of the various raw materials consumed by these mills. Specifically, the 1.4-million metric ton increase in softwood pulpwood demand attributed to Georgia Biomass and Fram coincided with a 20% increase in delivered pine pulpwood price and a 10-15% increase in pine chip prices from 2011-2015. Since 2015, biomass demand has held relatively steady, and, overall, so too have delivered pine pulpwood and pine chip prices. The apparent link between increased bioenergy demand and increased pine raw material prices is supported further by statistical analysis, as strong positive correlations were found between softwood biomass demand and both delivered pine pulpwood and pine chip prices. However, note that biomass demand alone is not responsible for these changes in prices, as softwood biomass demand accounts for only 10-15% of total softwood pulpwood demand in the catchment area. Rather, the prices of these raw materials are impacted to a larger degree by demand from other sources (i.e. pulp/paper), which accounts for 85-90% of total softwood pulpwood demand in the Georgia catchment area.
On the other hand, it’s also important to note that the increase in bioenergy-related wood demand has been a positive for forest landowners in the Georgia catchment area. Not only has bioenergy provided an additional outlet for pulpwood in this market, but the increase in pulpwood prices as a result of increased pulpwood demand has transferred through to landowners (improved compensation). Specifically, since 2015, pine pulpwood (PPW) stumpage price – the price paid to landowners – has averaged more than $17 per ton in the Georgia catchment area. This represents a 70% increase over the approximately $10 per ton averaged by PPW stumpage in the catchment area over the last five years prior to Georgia Biomass’ startup in 2Q 2011.
(Note: Pine pulpwood stumpage prices are notably higher in the Georgia catchment area due to a much tighter balance in supply and demand (in comparison to most other markets across the US South). For instance, in all other areas across the US South2, PPW stumpage prices have averaged less than $9 per ton since 2015, or roughly half that of prices in the Georgia catchment area).
Markets for solid wood products
Positive. In the Georgia catchment area, demand for softwood sawlogs used to produce lumber and other solid wood products increased an estimated 39% from 2011-2019, and by-products of the sawmilling process are sawmill residuals – materials utilized by Georgia Biomass and the Fram mills to produce wood pellets. With the increased production of softwood lumber, so too has come an increase in sawmill residuals, some of which have been purchased/consumed by Georgia Biomass and Fram. Not only have these pellet producers benefited from the greater availability of this by-product, but lumber producers have also benefited, as the Georgia Biomass and Fram mills have provided an additional outlet for these producers and their by-products.

In ecological terms, biomass refers to any type of organic matter. When it comes to energy, biomass is any organic matter that can be used to generate energy, for example wood, forest residues or plant materials.
Biomass used and combusted for energy can come in a number of different forms, ranging from compressed wood pellets – which are used in power stations that have upgraded from coal – to biogas and biofuels, a liquid fuel that can be used to replace fossil fuels in transport.
The term biomass also refers to any type of organic material used for energy in domestic settings, for example wood burned in wood stoves and wood pellets used in domestic biomass boilers.
Biomass is organic matter like wood, forest residues or plant material, that is used to generate energy.
Biomass can be produced from different sources including agricultural or forestry residues, dedicated energy crops or waste products such as uneaten food.
Drax Power Station uses compressed wood pellets sourced from sustainably managed working forests in the US, Canada, Europe and Brazil, and are largely made up of low-grade wood produced as a byproduct of the production and processing of higher value wood products, like lumber and furniture.
Biomass producers and users must meet a range of stringent measures for their biomass to be certified as sustainable and responsibly sourced.
Biomass grown through sustainable means is classified as a renewable source of energy because of the process of its growth. As biomass comes from organic, living matter, it grows naturally, absorbing carbon dioxide (CO2) from the atmosphere in the process.
It means when biomass is combusted as a source of energy – for example for heat or electricity production – the CO2 released is offset by the amount of CO2 it absorbed from the atmosphere while it was growing.
Biomass is a renewable, sustainable form of energy used around the world.
Biomass has been used as a source of energy for as long as humans have been creating fire. Early humans using wood, plants or animal dung to make fire were all creating biomass energy.
Today biomass in the form of wood and wood products remains a widely used energy source for many countries around the world – both for domestic consumption and at grid scale through power stations, where it’s often used to replace fossil fuels with much higher lifecycle carbon emissions.
Drax Power Station has been using compressed wood pellets (a form of biomass) since 2003, when it began research and development work co-firing it with coal. It fully converted its first full generating unit to run only on compressed wood pellets in 2013, lowering the carbon footprint of the electricity it produced by more than 80% across the renewable fuel’s lifecycle. Today the power station runs mostly on sustainable biomass.

RNS Number : 3978U
Drax Group PLC (Symbol: DRX)
| Six months ended 30 June | H1 2020 | H1 2019 |
|---|---|---|
| Key financial performance measures | ||
| Adjusted EBITDA (£ million) (1)(2) | 179 | 138 |
| Cash generated from operations (£ million) | 226 | 229 |
| Net debt (£ million) (3) | 792 | 924 |
| Interim dividend (pence per share) | 6.8 | 6.4 |
| Adjusted basic earnings per share (pence) (1) | 10.8 | 2 |
| Total financial performance measures | ||
| Coal obsolescence charges | -224 | - |
| Operating (loss) / profit (£ million) | -32 | 34 |
| (Loss) / profit before tax (£ million) | -61 | 4 |
| Basic (loss) / earnings per share (pence) | -14 | 1 |

Biomass storage dome with conveyor in the foreground, Drax Power Station, North Yorkshire [Click to view/download]
“With these robust half-year results, Drax is delivering for shareholders with an increased dividend while continuing to support our employees, communities and customers during the Covid-19 crisis.
Drax Group CEO Will Gardiner in the control room at Drax Power Station [Click to view/download]
“National Grid stated this week that the UK can’t reach net zero by 2050 without negative emissions from bioenergy with carbon capture and storage. BECCS delivers for the environment and also provides an opportunity to create jobs and clean economic growth in the North and around the country.”
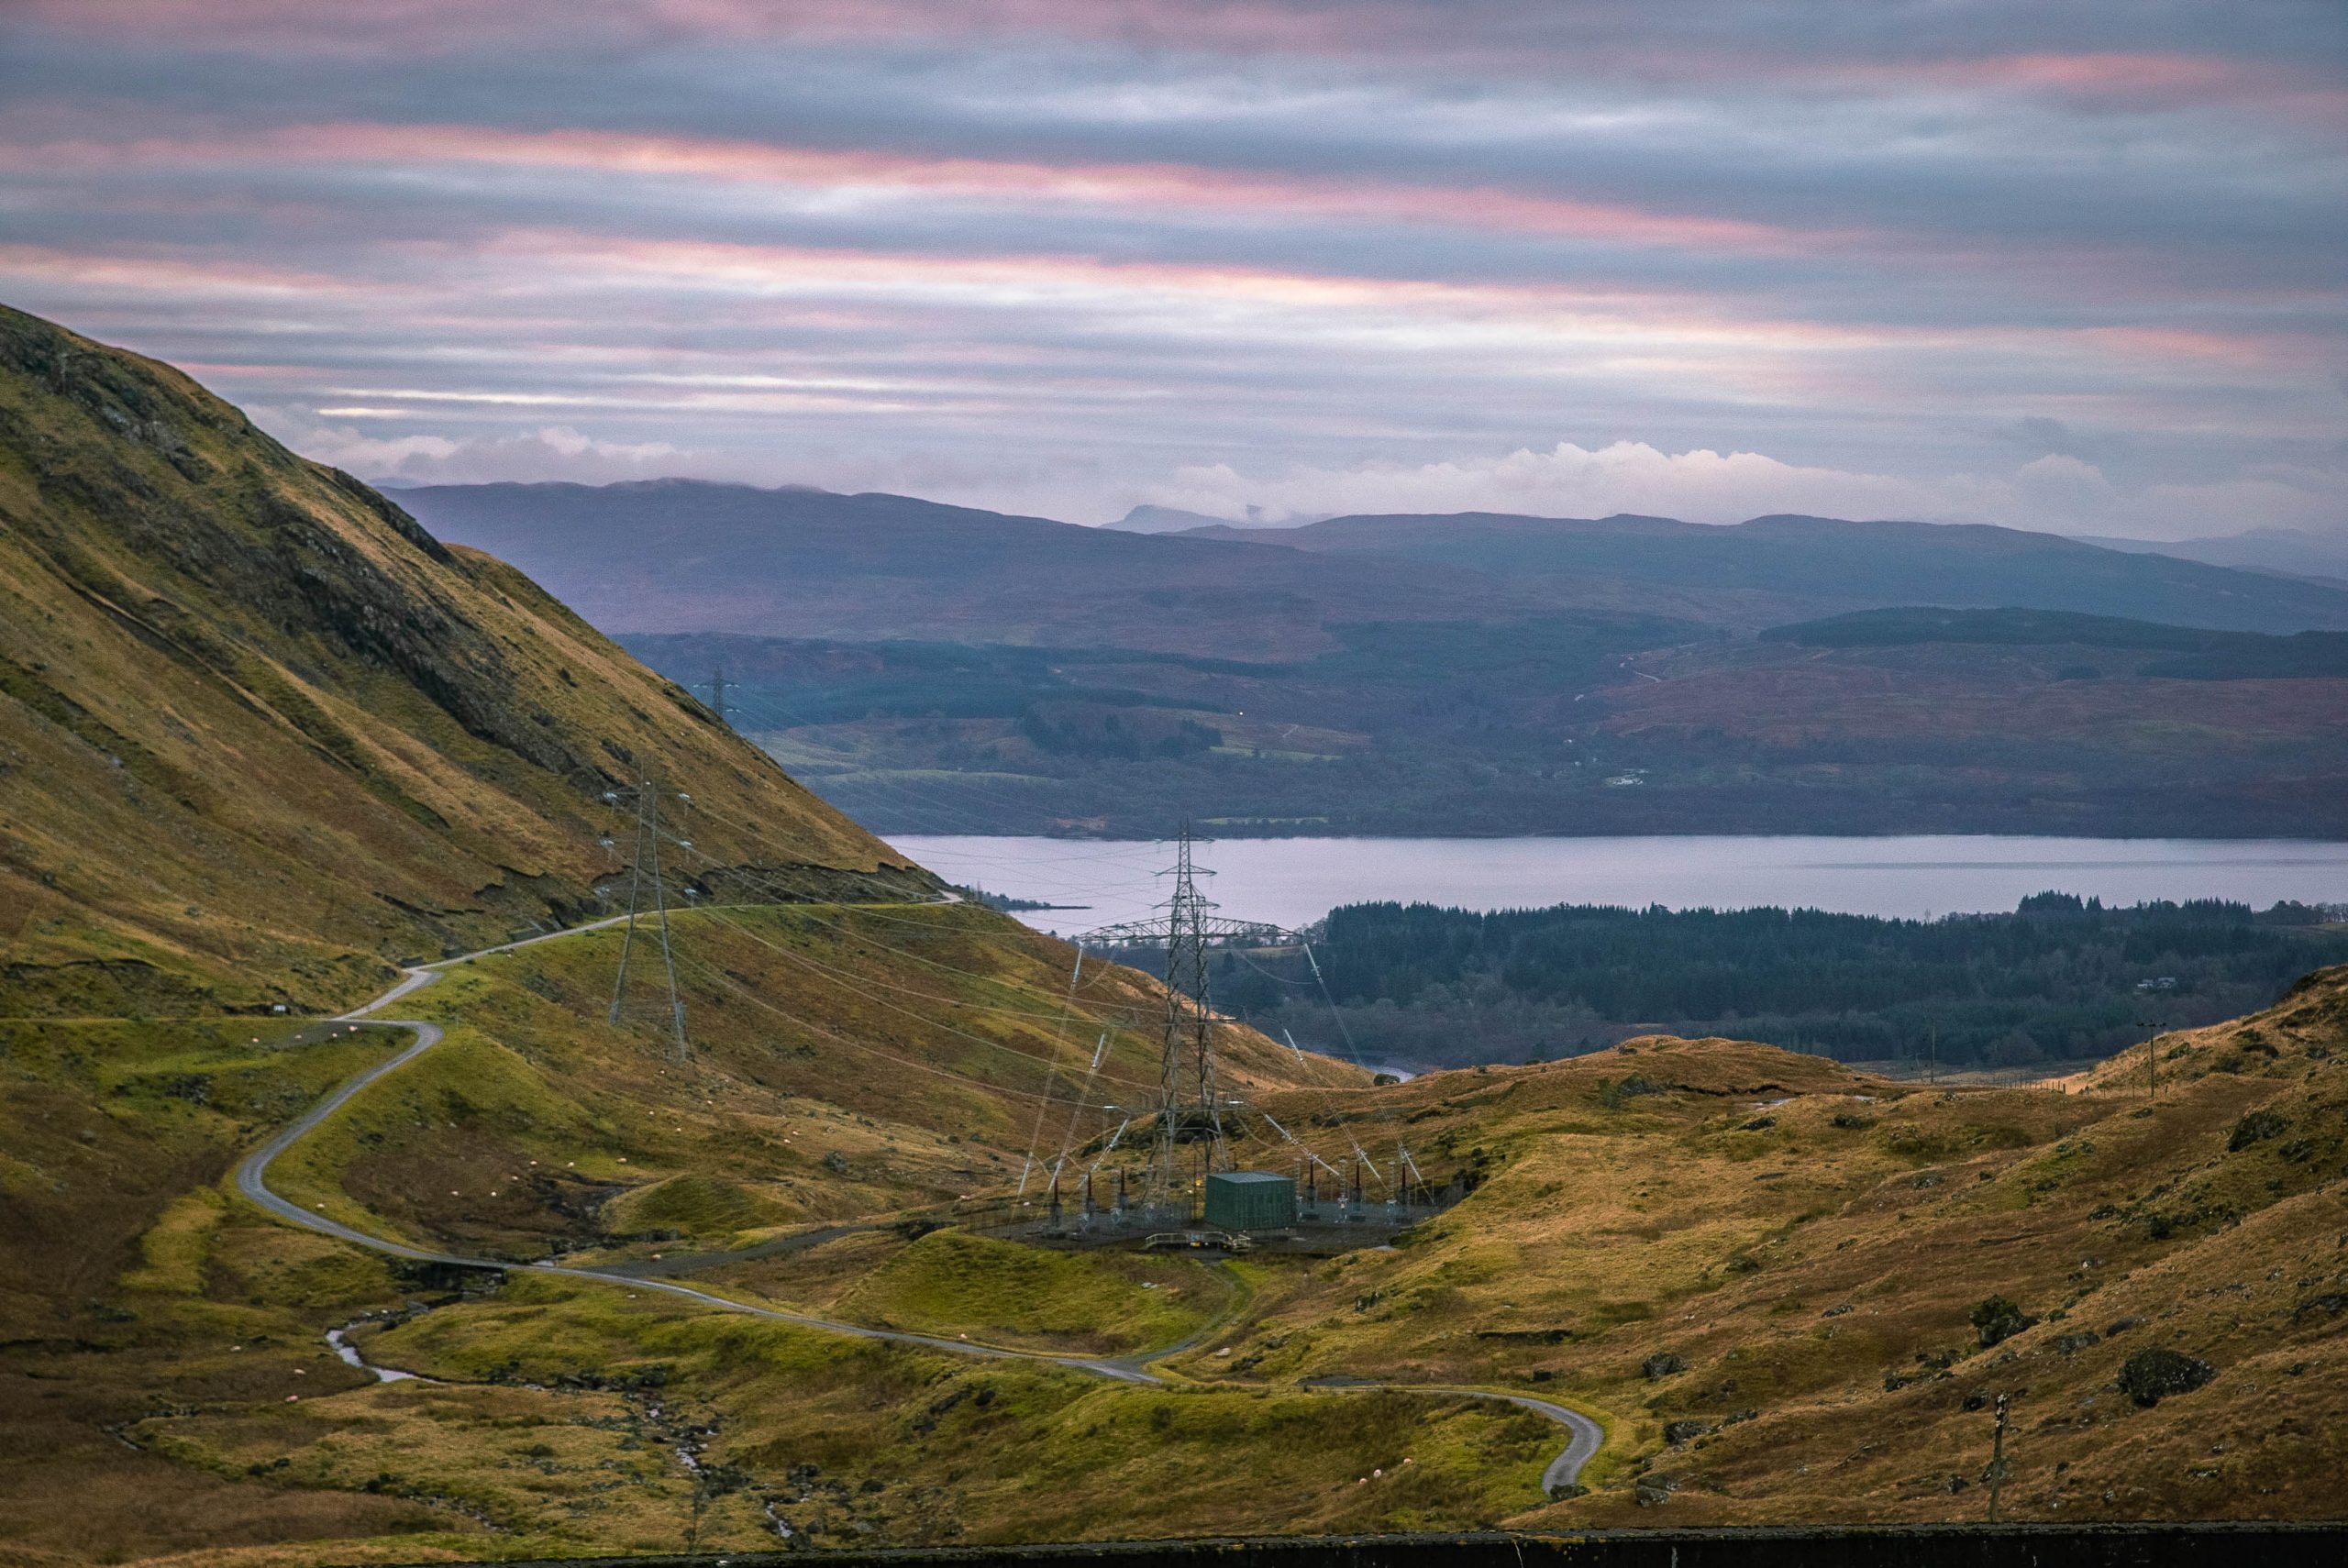
Power lines and pylon above Cruachan Power Station, viewed from Ben Cruachan above [Click to view/download]
View complete half year report
View analyst presentation
Listen to webcast
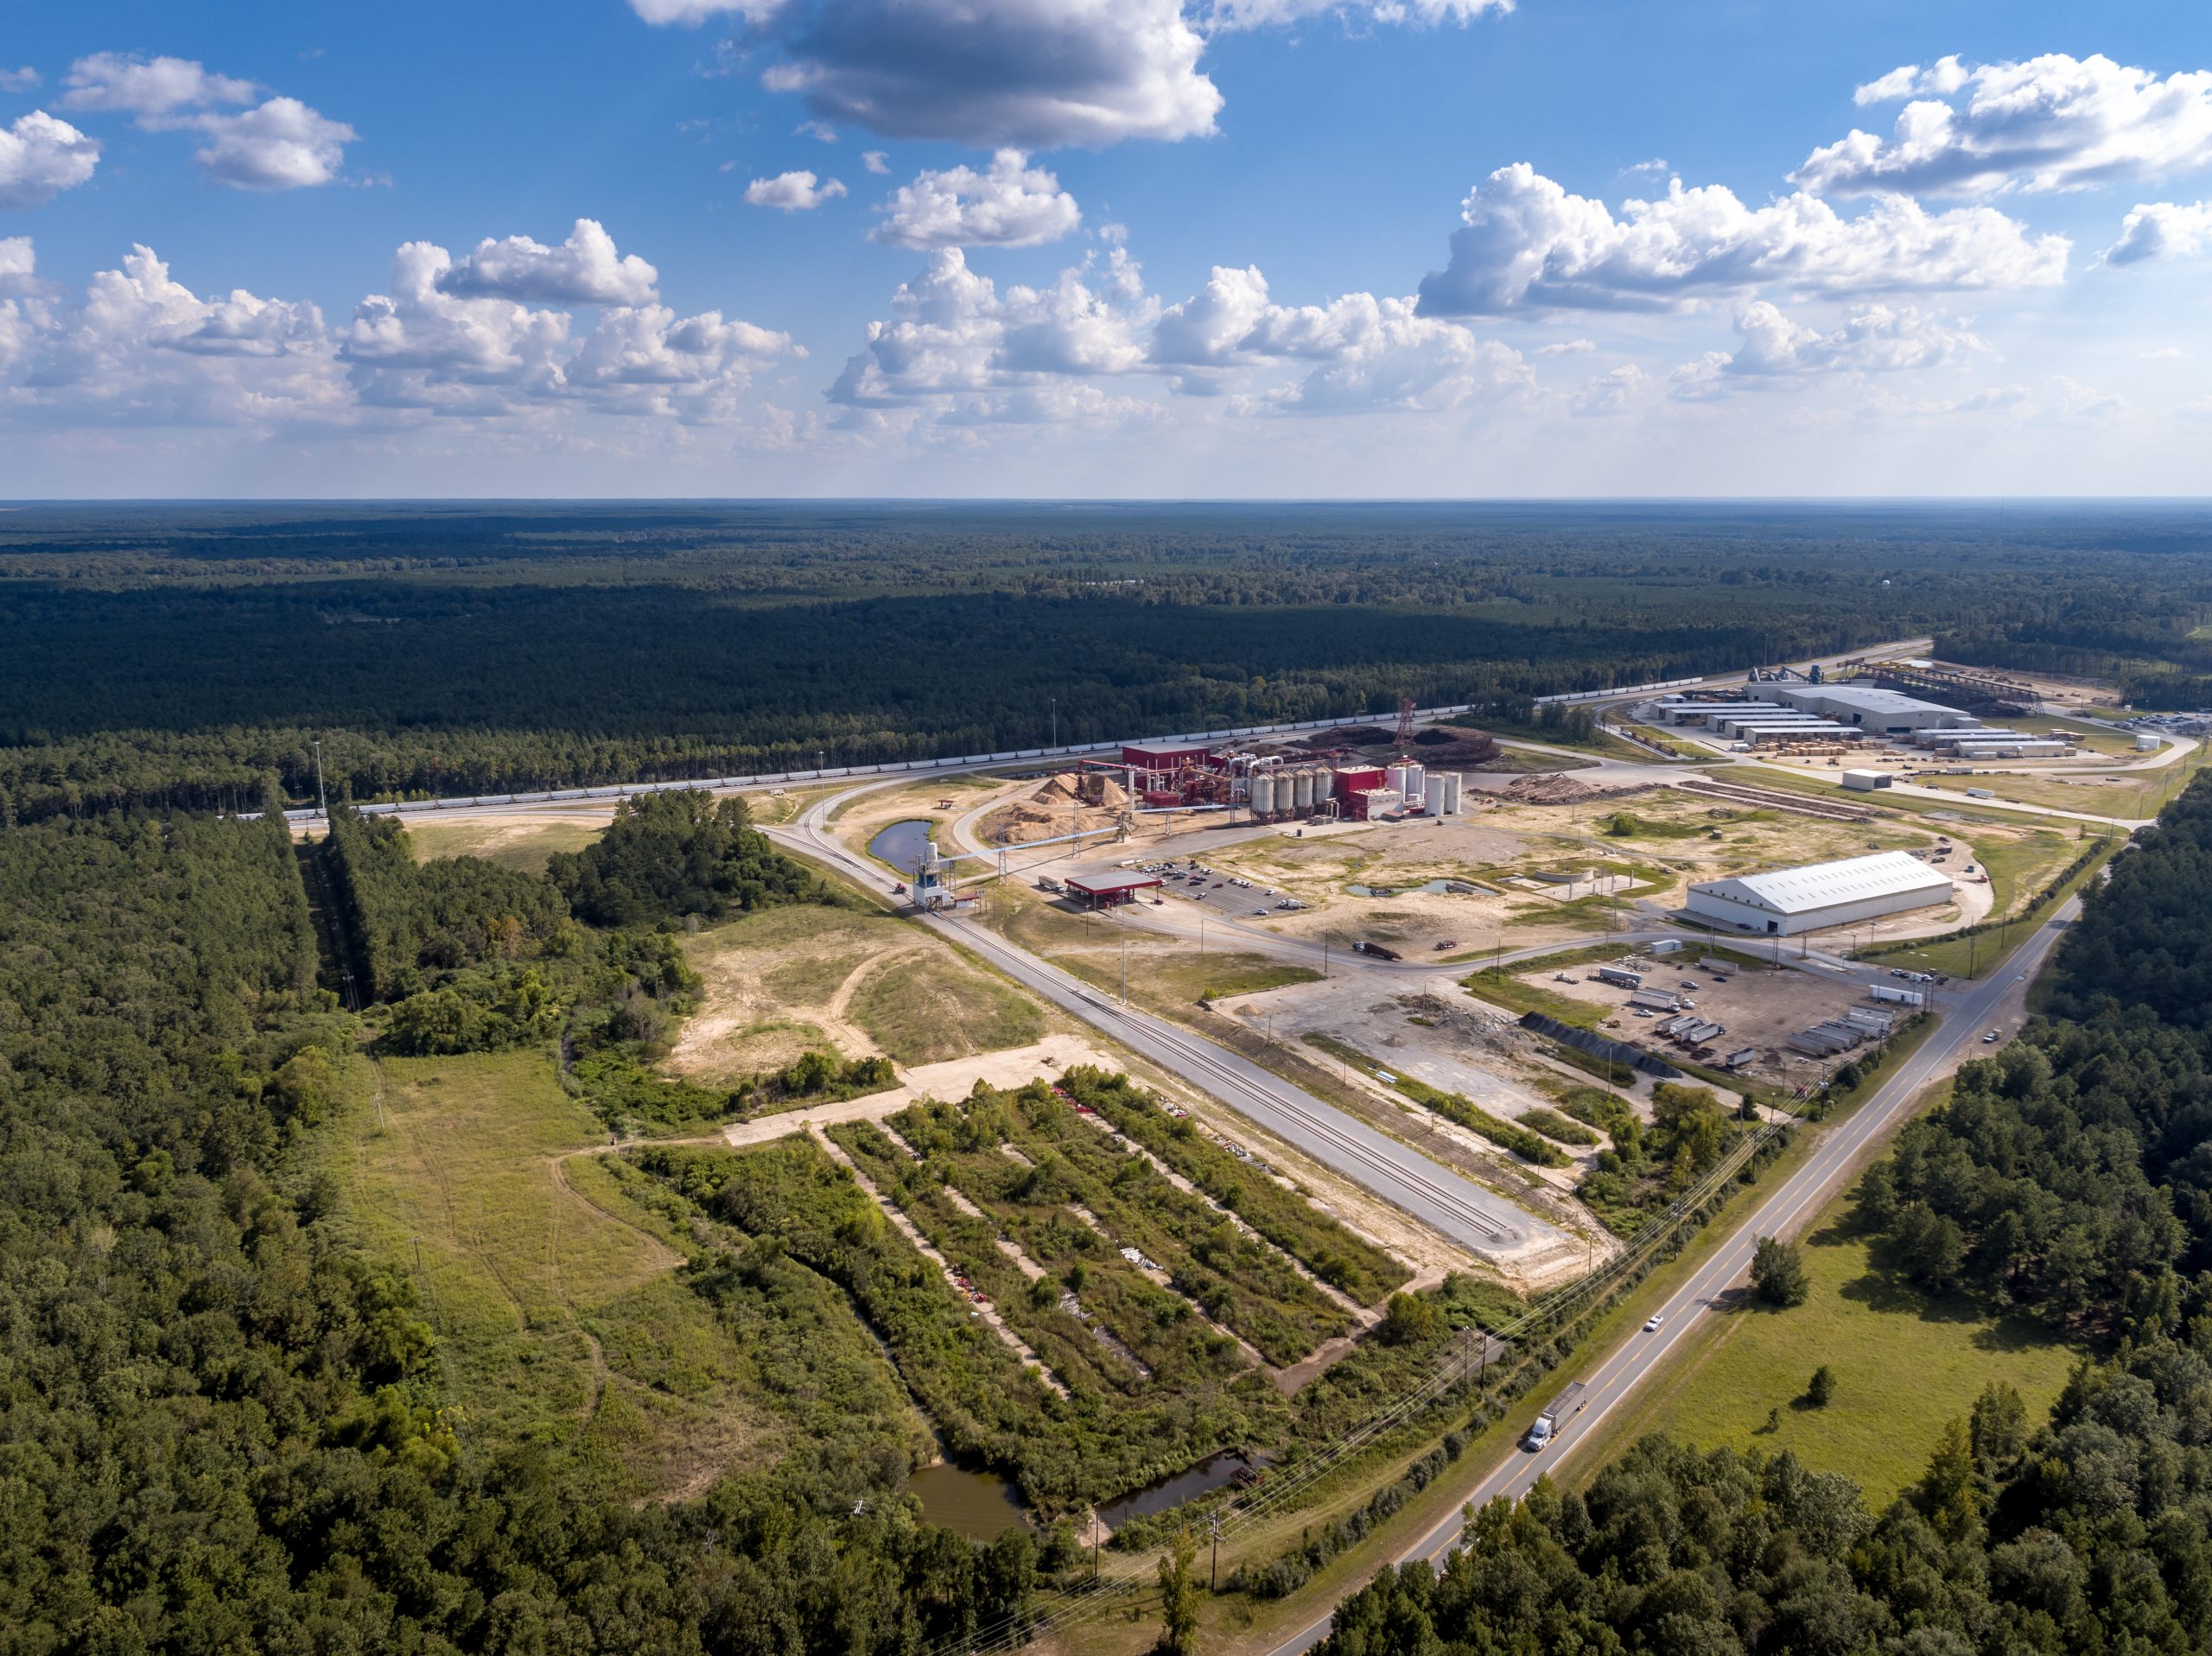
View/download main image. Caption: LaSalle BioEnergy (centre) and co-located sawmill (right), Louisiana