Electric vehicles are fast becoming mainstream. There are now well over 200,000 on Britain’s roads, and this number is growing by 30% per year. 1 in 40 cars sold in Britain is now electric, around one third of which are pure battery models, and two thirds are plug-in hybrid.[1]
This radical shift is just beginning though. Britain’s electric vehicle fleet is expected to expand ten-fold over the next five to ten years. In more optimistic scenarios, half of all vehicles on the road could be electric just fifteen years from now.[2]
While many see EVs as the cleanest way to drive, they are still the subject of much speculation. Recent criticisms range from a UK government report saying they won’t end air pollution[3] to a string of studies (often debunked) claiming they emit more CO2 than diesel equivalents.[4]
The arguments are simple: how can it be cleaner to swap a petrol car for electric if it is recharged using electricity from dirty coal or gas? Secondly, how can electric vehicles ‘repay’ the energy needed for mining lithium and to assemble the huge batteries that power them?
We review academic studies of battery manufacture and use data from Electric Insights to answer these questions. On average Britain’s EVs emit just one quarter the CO2 of conventional petrol and diesel vehicles. If the carbon emitted in making their battery is included, this rises to only half the CO2 of a conventional vehicle. Electric vehicles bought today could be emitting just a tenth that of a petrol car in five years’ time, as the electricity system is widely expected to continue moving towards low-carbon sources.
Manufacturing each kWh of battery emits a similar amount of carbon as burning through one full tank of petrol.[5] Electric vehicles typically have a battery capacity ranging from 30 kWh for small city hatchbacks up to 100 kWh for top-end models – manufacturing the latter emits as much carbon as three round-the-world flights. More CO2 is emitted in building the battery for premium EV model than from the recharging it over a 15-year lifetime.[6]
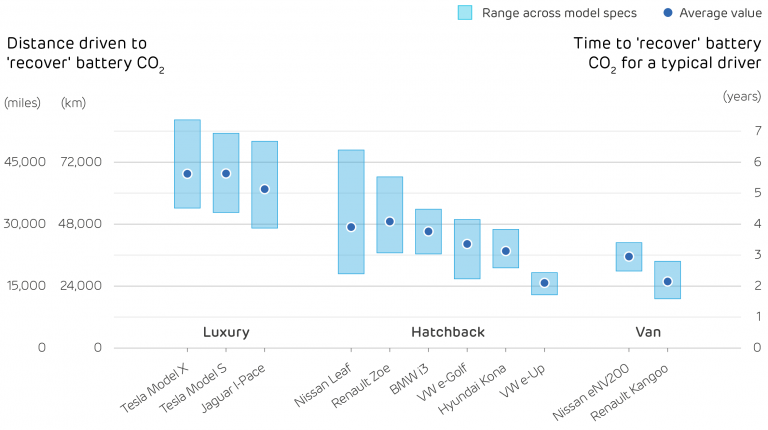
However, the most efficient EV models could need just two to three years of driving to save the amount of carbon emitted in producing their batteries. Smaller EVs with modest battery sizes are better for the environment; whereas the largest luxury EV models could need three times longer to pay back their carbon cost.
Hatchbacks
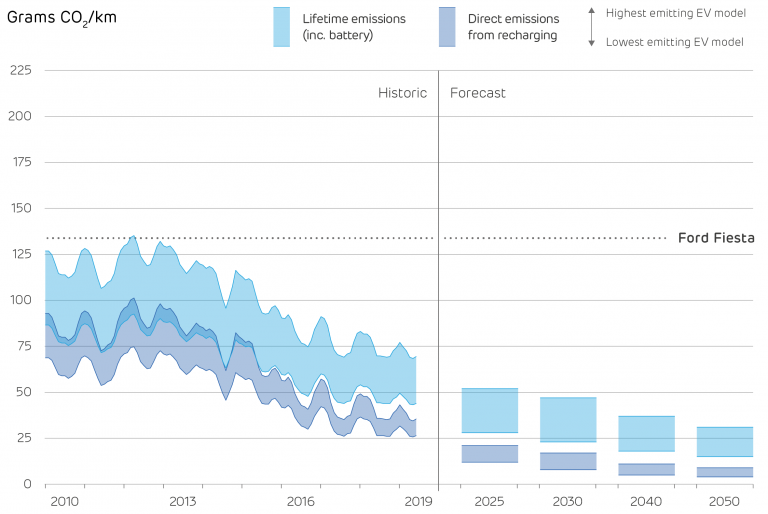
Small hatchbacks are the best-selling type of electric vehicles, led by the Nissan Leaf. They are also the cleanest to drive as they are small and light. Electric models currently emit around 33 grams of CO2 per km driven, which is one quarter that of the most popular conventional vehicle, a 2019 Ford Fiesta.
These electric models typically come with a 30-45 kWh battery, which pushes their lifetime emissions up around 60 g/km. This is still less than half the emissions of a petrol or diesel car. With the projected changes to the grid mix, this will fall to less than one third of a standard car in just five years’ time.
 EV models: Nissan Leaf, Renault Zoe, Volkswagen e-Golf and e-Up, Hyundai Kona and BMW i3
Battery size: 39 kWh on average (31–46 kWh central range)
Lifetime carbon content of the battery: 26 g/km driven on average (18–34 g/km central range)
Emissions with 2018/19 grid mix: 28–38 g/km from recharging, 45–72 g/km including battery
Emissions with 2025 grid mix: 12–20 g/km from recharging, 28–52 g/km including battery
Luxury
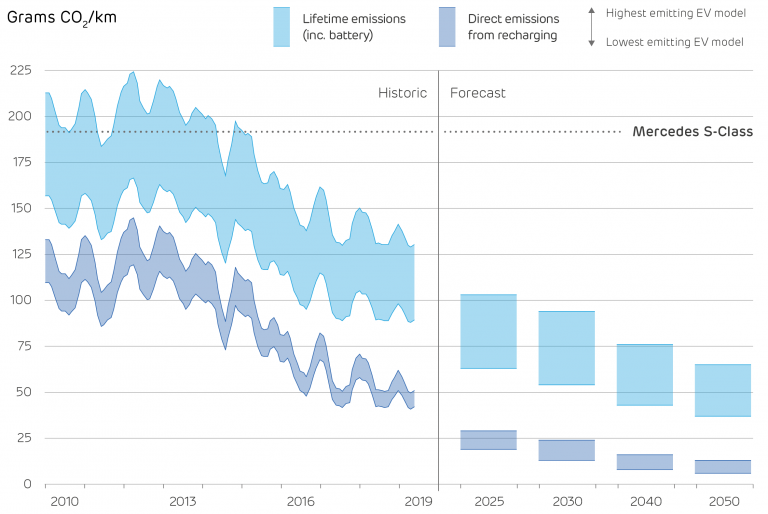
Luxury saloons and SUV models include the iconic Tesla Models S and X, and the new Jaguar i-Pace. These are much larger and need more energy to move, meaning they have higher emissions than hatchbacks, at 44-54 g/km. This is still just a quarter of the emissions from a comparable conventional car (a top of the range Mercedes S-Class).
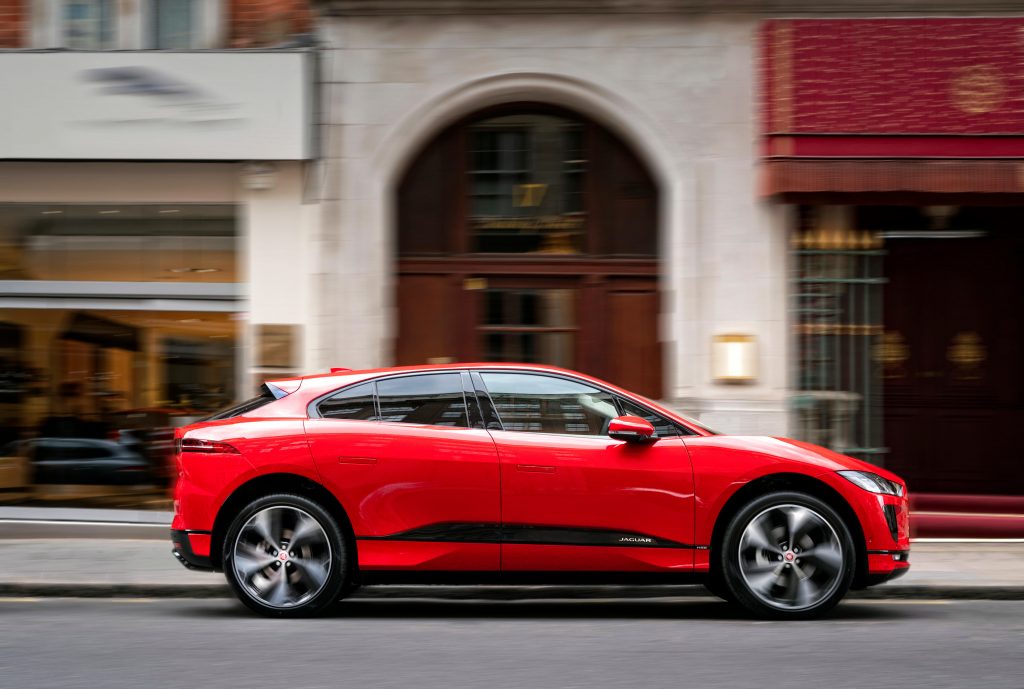
Jaguar I Pace EV
The lifetime emissions of these luxury EVs are notably higher though, pushed up by the enormous 90-100 kWh batteries they use to provide a driving range of over 250 miles. These batteries are responsible for more CO2 emissions than driving the car over its entire lifetime.
 Models considered: Jaguar i-Pace, Tesla Model S and Model X
Battery size: 97 kWh on average (90–100 kWh central range)
Lifetime carbon content of the battery: 63 g/km driven on average (47–80 g/km central range)
Emissions with 2018/19 grid mix: 44–54 g/km from recharging, 92–133 g/km including battery
Emissions with 2025 grid mix: 19–29 g/km from recharging, 63–103 g/km including battery
Vans
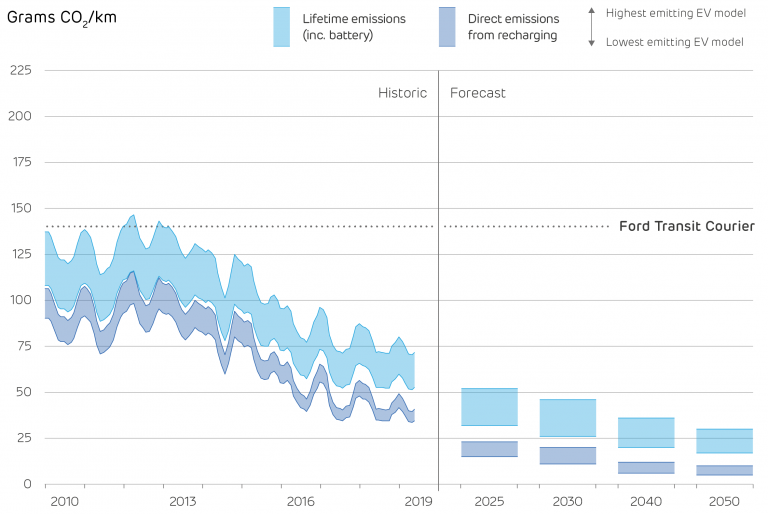
Electric vans are quickly taking off, with over 8,000 sold in Britain to date. Their performance is comparable to small hatchbacks, and they also currently emit around a quarter of the CO2 of the most popular conventional van, with around 40 g/km.
With their 30–40 kWh battery pack included, this rises to just below half the CO2 of a small Ford Transit.
 Models considered: Nissan e-NV200 and Renault Kangoo
Battery size: 37 kWh on average (33–40 kWh central range)
Lifetime carbon content of the battery: 24 g/km driven on average (18–31 g/km central range)
Emissions with 2018/19 grid mix: 37–43 g/km from recharging, 54–74 g/km including battery
Emissions with 2025 grid mix: 15–23 g/km from recharging, 32–52 g/km including battery
Payback time
A typical driver filling their car up once a month and driving around 7,500 miles per year will produce one and a half tonnes of CO2 per year in a modern petrol or diesel hatchback. An electric vehicle doing the same mileage would take 4 years to produce this amount.
With a conventional vehicle, there is no scope for reducing emissions over its lifetime, as petrol and diesel fuels cannot become carbon-free. On the contrary, National Grid expect the carbon content of Britain’s electricity to continue falling, so that an electric vehicle bought now will be emitting half as much CO2 in 2025 as it does today.
It is inconceivable that an electric vehicle in the UK could be more polluting than its conventional equivalent. This would require electricity to have a carbon intensity of around 850–950 g/kWh, values not seen since the 1960s.[7]
Electric vehicles can be thought of as having an upfront ‘carbon cost’ for manufacturing the battery, which can then be ‘repaid’ through lower emissions as they are driven. With Britain’s current grid electricity (producing 205 g/kWh), smaller electric cars and vans will take between 2 and 4 years to have saved the amount of CO2 than was emitted in making their batteries. For the larger luxury models, it will take more like 5–6 years of driving to pay back that carbon.
With each passing year as the electricity mix gets cleaner, this payback time will continue to fall, and the environmental credentials of electric vehicles will keep growing stronger.
About this study
The fuel economy and climate impact of vehicles are measured by the government through the amount of CO2 they release for every kilometre driven. The UK’s most popular car, the Ford Fiesta, emits around 120 g/km in its cleanest models and 160 g/km in the sportier versions.[9] Electric vehicles don’t emit any CO2 while driving, but the power system does when producing the electricity needed to recharge them.
Britain’s power system has changed dramatically over the last five years, with carbon emissions halving and the share of coal generation falling from 36% to just 3%. One kWh of electricity in Britain is now contains 204 grams[10] of CO2, less than the carbon released from burning one kWh of petrol. An electric vehicle can drive up to four times further on 1 kWh than a petrol or diesel car could, because electric motors are so much more efficient.
The charts above look at three categories of vehicle – small hatchbacks, luxury saloons and SUVs, and small commercial vans. Each chart shows how the carbon emissions from an electric vehicle have fallen over the past decade, and how they are expected to continue falling in the years to come. The charts consider changes to the electricity generation mix used for recharging,[11] and a gradual reduction in emissions from battery manufacture as the electricity mix changes in other countries.[12]
The range in direct emissions from recharging (the dark blue bands) covers the main EV models currently on sale in each segment, and variants on each model available. The top of each band (highest emissions) shows the least efficient EV model, the bottom of each band (lowest emissions) shows the most efficient. In the forecast, these bands also include the range of emissions factors for electricity production coming from National Grid’s scenarios.
There is a larger range in the estimated whole-lifecycle emissions (the lighter blue bands) due to the additional uncertainty in the emissions caused by manufacturing 1 kWh of battery capacity, and the range of battery sizes seen across EV models.
Studies have estimated a wide range of emissions, depending on the type of battery type, its design, where it is manufactured and how old the study is. Current estimates range from 40 up to 200 kg of CO2 emitted per kWh of battery capacity.[13] We take the average across eight studies and assume 75–125 kgCO2 per kWh. The true value may be less than this, as end-of-life batteries could be recycled,[14] or could be repurposed as a second-life home or grid storage batteries. It will also reduce in future as the electricity used to make batteries is decarbonised, or as more factories switch to 100% renewable energy (as has the US Tesla Gigafactory).
Read full Report (PDF) | Read full Report | Read press release


