Tag: wood pellets

What is biomass?

Illustration of a working forest supplying biomass

What is biomass?

In ecological terms, biomass refers to any type of organic matter. When it comes to energy, biomass is any organic matter that can be used to generate energy, for example wood, forest residues or plant materials.

How is biomass used?  

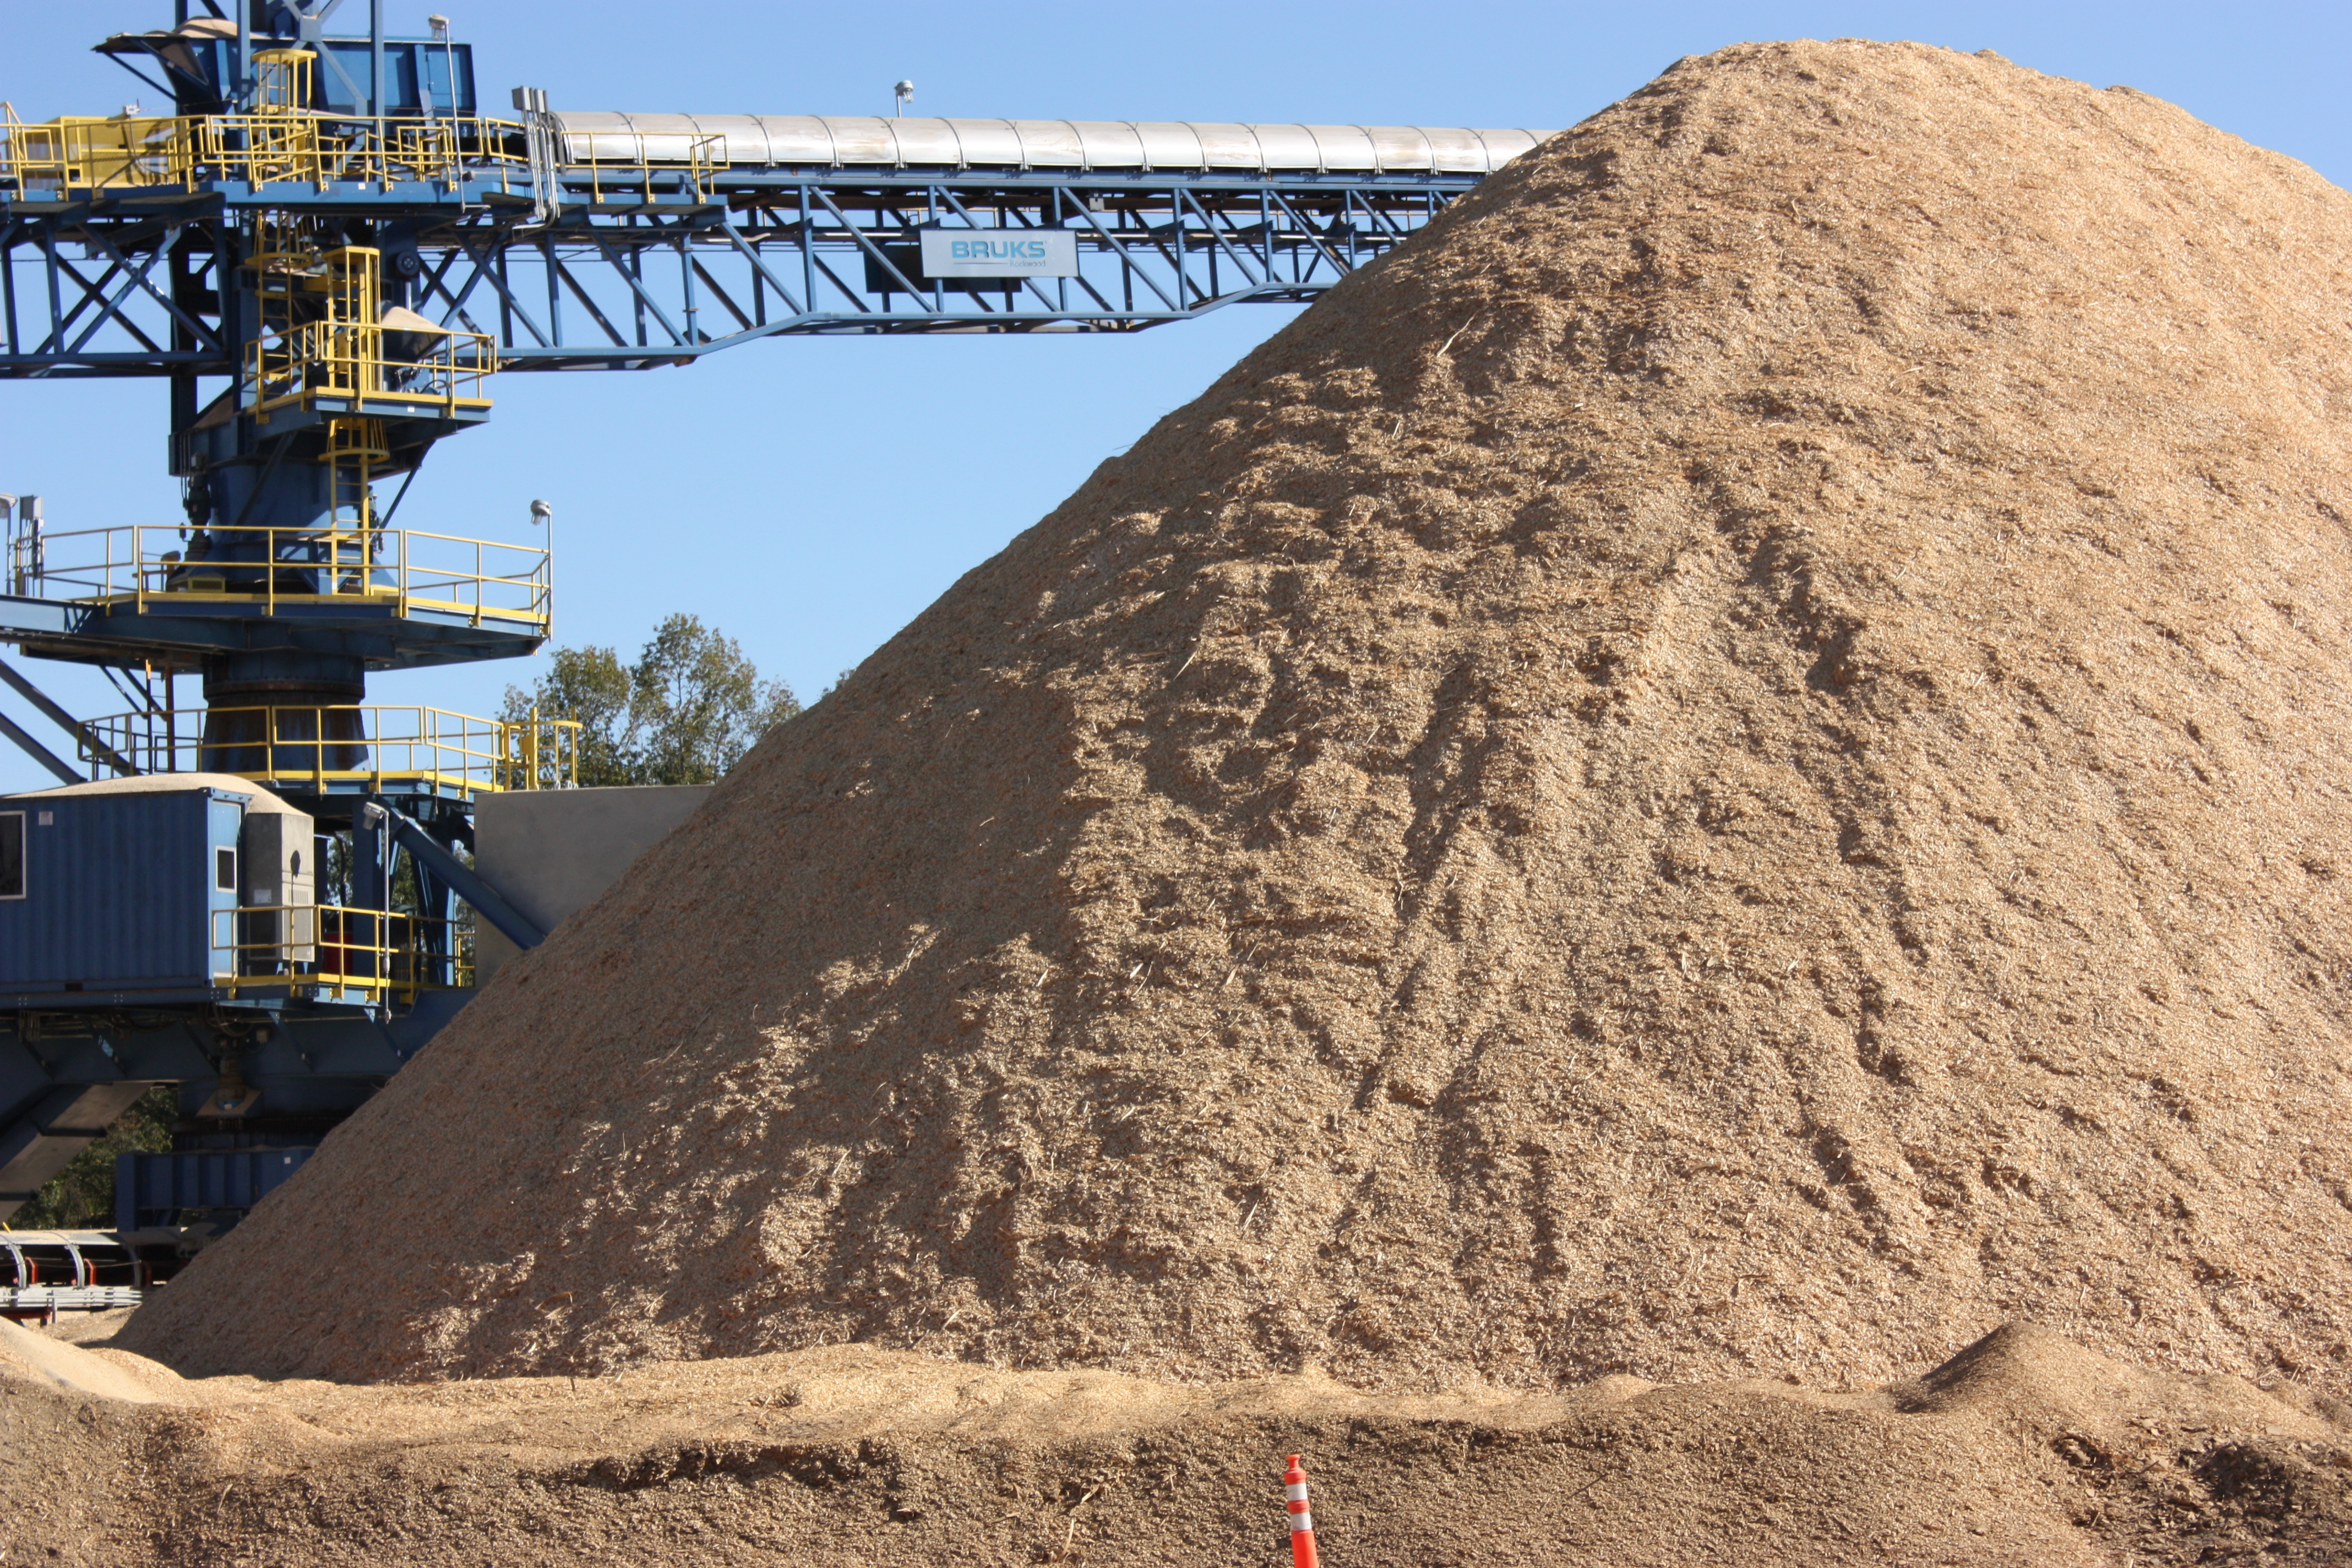
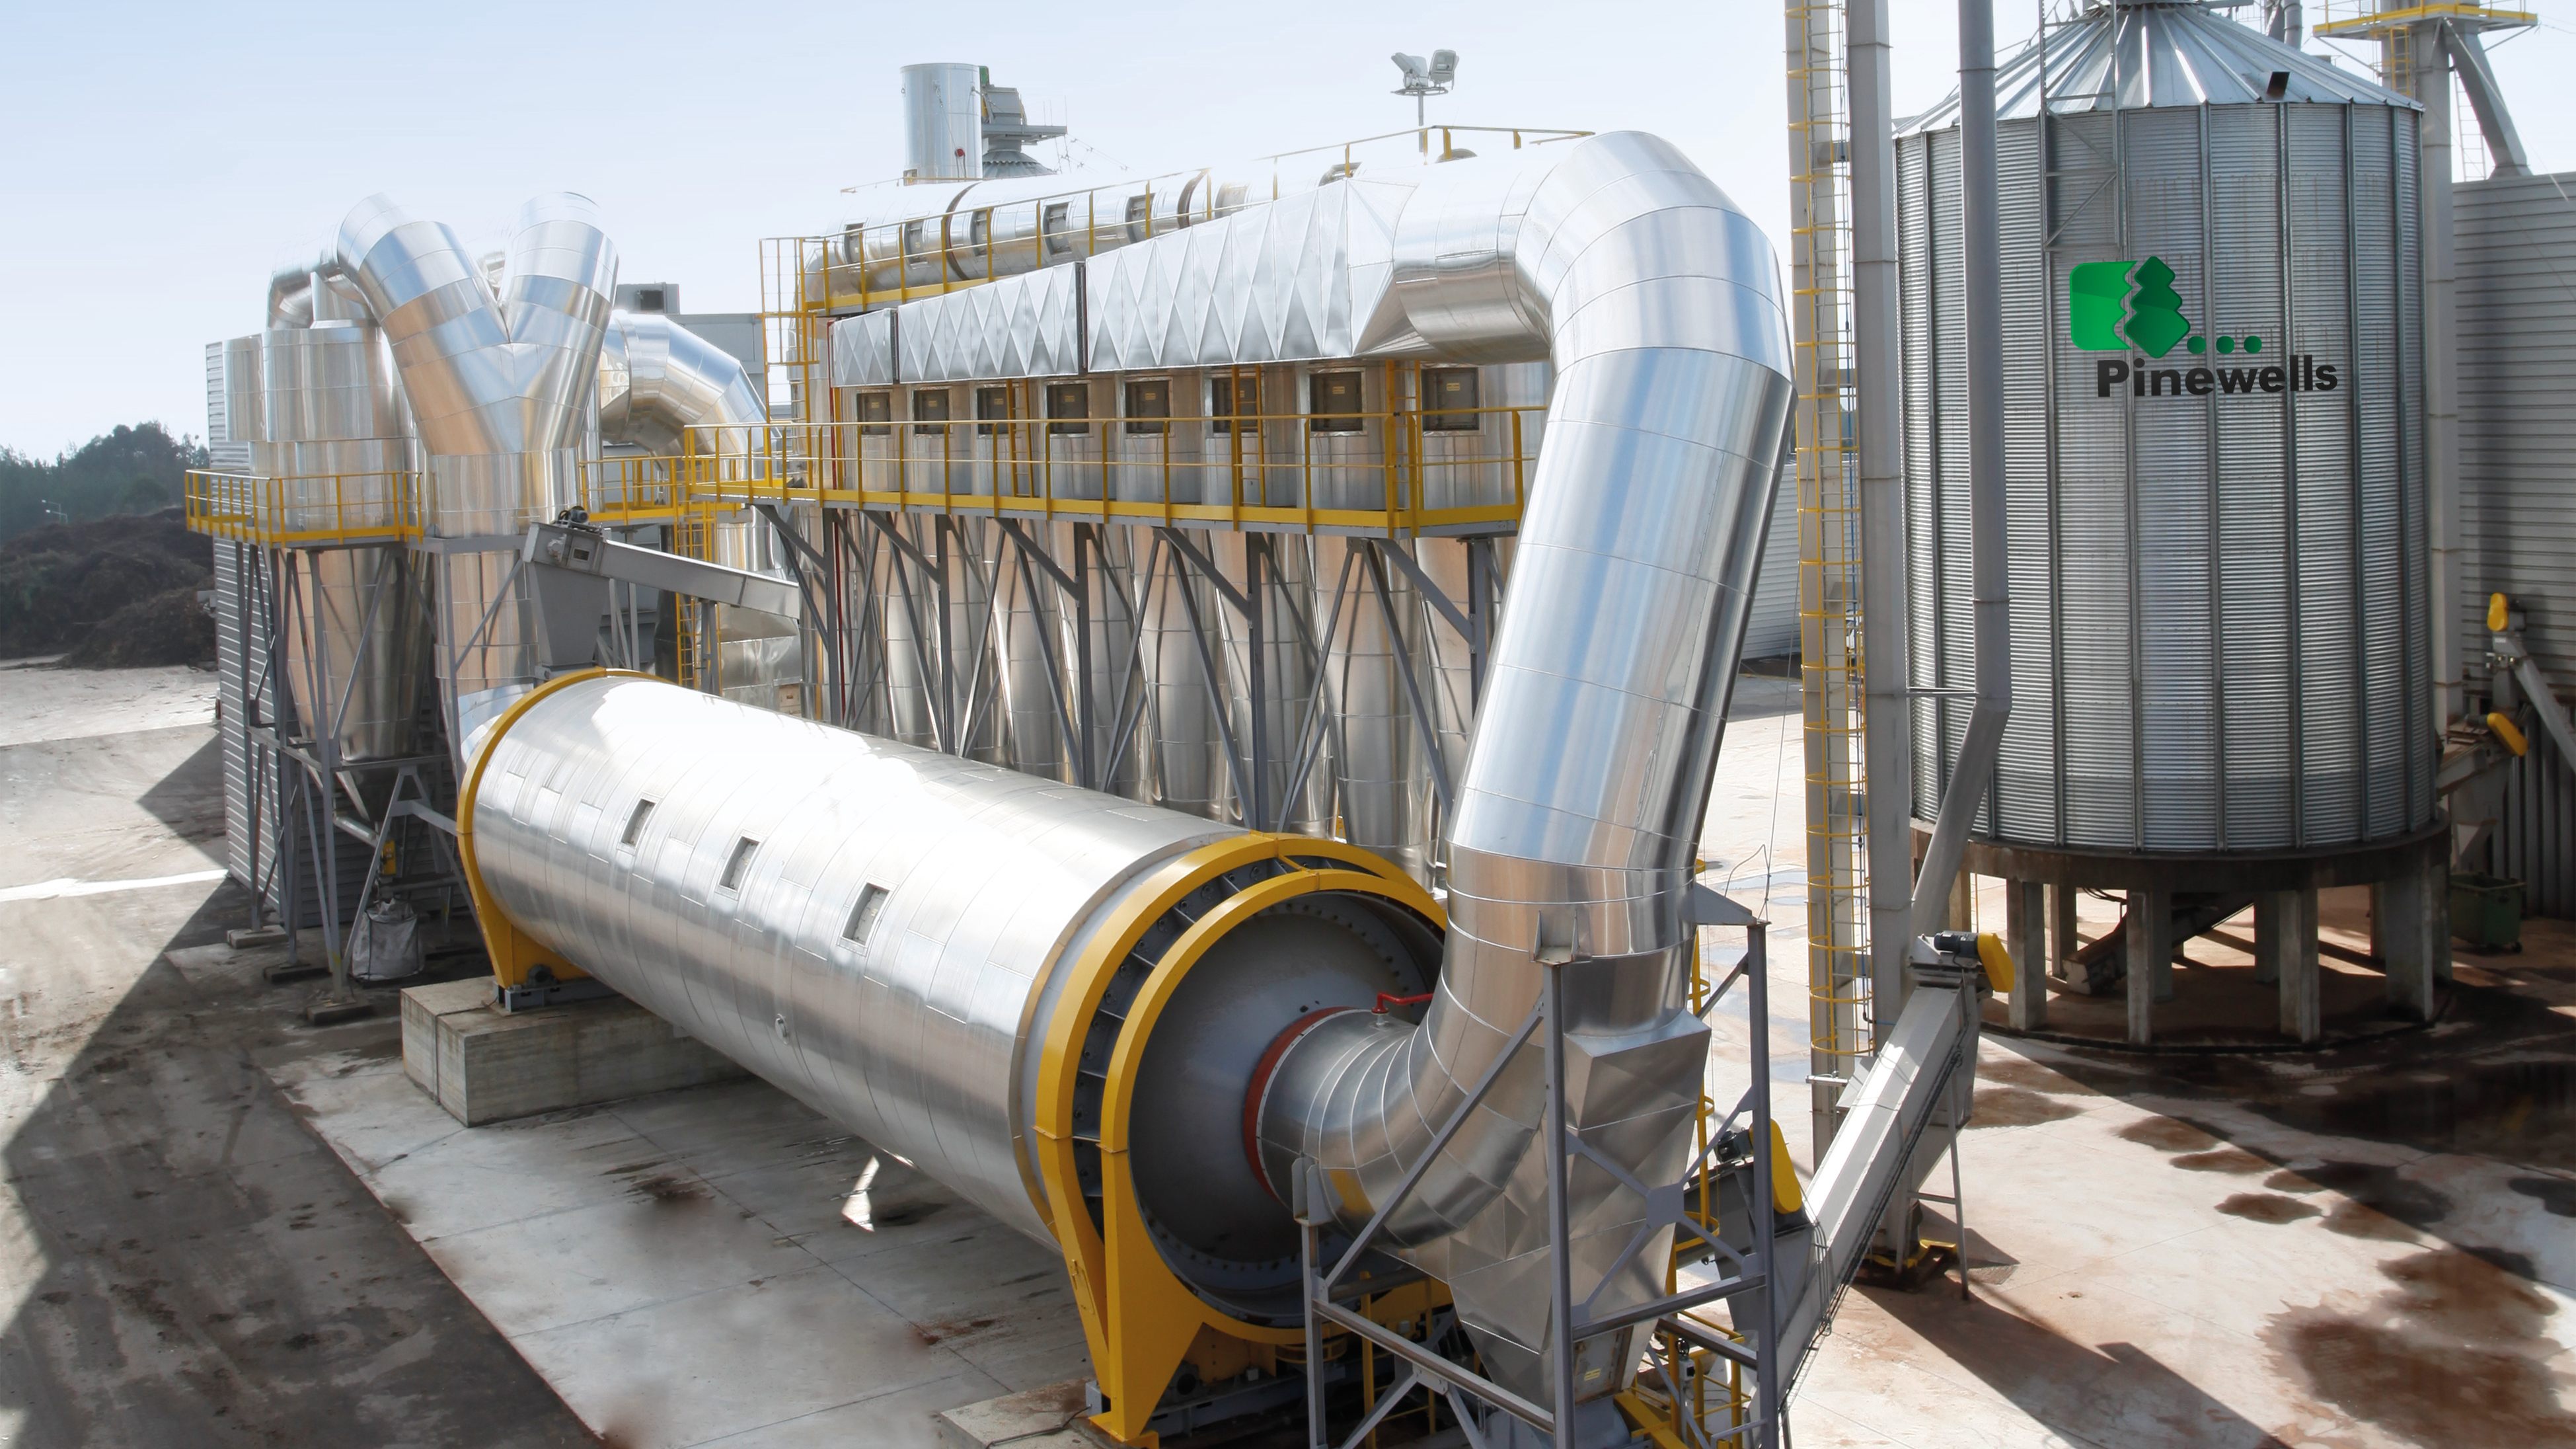
Biomass used and combusted for energy can come in a number of different forms, ranging from compressed wood pellets – which are used in power stations that have upgraded from coal – to biogas and biofuels, a liquid fuel that can be used to replace fossil fuels in transport.

The term biomass also refers to any type of organic material used for energy in domestic settings, for example wood burned in wood stoves and wood pellets used in domestic biomass boilers.

Biomass is organic matter like wood, forest residues or plant material, that is used to generate energy.

Where does biomass come from?

Biomass can be produced from different sources including agricultural or forestry residues, dedicated energy crops or waste products such as uneaten food.

Drax Power Station uses compressed wood pellets sourced from sustainably managed working forests in the US, Canada, Europe and Brazil, and are largely made up of low-grade wood produced as a byproduct of the production and processing of higher value wood products, like lumber and furniture.

Biomass producers and users must meet a range of stringent measures for their biomass to be certified as sustainable and responsibly sourced.

Key biomass facts

Is biomass renewable?

 Biomass grown through sustainable means is classified as a renewable source of energy because of the process of its growth. As biomass comes from organic, living matter, it grows naturally, absorbing carbon dioxide (CO2) from the atmosphere in the process.

It means when biomass is combusted as a source of energy – for example for heat or electricity production – the CO2 released is offset by the amount of CO2 it absorbed from the atmosphere while it was growing.

Fast facts

  • In 2019 biomass accounted for 6% of Great Britain’s electricity generation, more than 1/6 of the total generation of all renewable sources
  • There is about 550 gigatonnes of biomass carbon on Earth in total. Humans make up around 1/10,000th of that mass.
  • Modern biomass was first developed as an alternative for oil after its price spiked as a result of the 1973 Yom Kippur War
  • The International Energy Agency (IEA) estimates bioenergy accounts for roughly 1/10th of the world’s total energy supply

Biomass is a renewable, sustainable form of energy used around the world.

How long has biomass been used as a source of energy?

Biomass has been used as a source of energy for as long as humans have been creating fire. Early humans using wood, plants or animal dung to make fire were all creating biomass energy.

Today biomass in the form of wood and wood products remains a widely used energy source for many countries around the world – both for domestic consumption and at grid scale through power stations, where it’s often used to replace fossil fuels with much higher lifecycle carbon emissions.

Drax Power Station has been using compressed wood pellets (a form of biomass) since 2003, when it began research and development work co-firing it with coal. It fully converted its first full generating unit to run only on compressed wood pellets in 2013, lowering the carbon footprint of the electricity it produced by more than 80% across the renewable fuel’s lifecycle. Today the power station runs mostly on sustainable biomass.

Go deeper

Read next: What is reforestation and afforestation?

LaSalle catchment area analysis

LaSalle Bioenergy Pellet Plant

The wood supply catchment area for Drax’s LaSalle BioEnergy biomass pellet plant in mid-Louisiana is dominated by larger scale private forest owners that actively manage and invest in their forest for saw-timber production. Eighty-three per cent (83%) of the forest is in private ownership and 60% of this area is in corporate ownership.

The Drax Biomass pellet mill uses just 3.2% of the roundwood in the market and therefore has limited impact or influence on the overall trends. By contrast, the pulp and paper industry consumes 74% of the total pulpwood demand as the most dominant market for low grade fibre.

Forest in LaSalle catchment area

Forest in LaSalle catchment area

The catchment area has seen an increase in total timberland area of 71 thousand hectares (ha) since 2008, this is primarily due to planting of previously non-stocked land. Hardwood areas have remained stable but planted pine has increased, replacing some of the naturally regenerated mixed species areas. The data below shows that deforestation or conversion from pure hardwood to pine is not occurring.

Timberland area by management type

Timberland area by management type

The overall quantity of stored carbon, or the inventory of the standing wood in the forest, has increased by 7% or 32.6 million metric tonnes since 2008. This total is made up of a 49 million tonne increase in the quantity of pine and a 16 million tonne decline in the quantity of hardwood. Since the area of pure hardwood forest has remained stable, this decline is likely to be due to the conversion of mixed stands to pure pine in order to increase saw-timber production and to provide a better return on investment for corporate owners.

Historic area and timberland inventory

Historic area and timberland inventory

Forest in LaSalle catchment area

Forest in LaSalle catchment area

The growth-to-drain ratio and the surplus of unharvested pine growth has been increasing year-on-year from two million tonnes in 2008 to over five million tonnes in 2016.

This suggests that the LaSalle BioEnergy plant (which almost exclusively utilises pine feedstocks) has not had a negative impact on the growth-to-drain ratio and the surplus of available biomass.

The latest data (2016) indicates that the ratio for pine pulpwood is 1.54 and for pine saw-timber 1.24 and that this has been increasing each year for both categories.

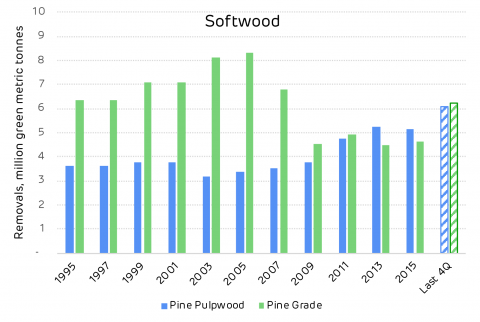
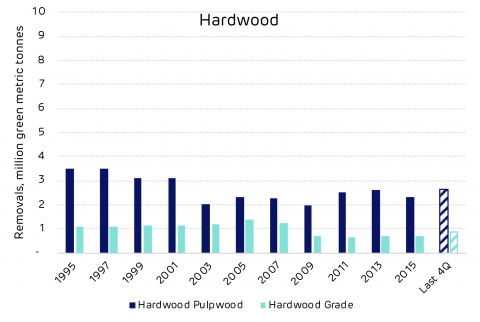
Historic growth and removals by species

Historic growth and removals by species

Stumpage prices for all product categories declined between 2010 and 2011. This was followed by a peak around 2015-16 with the recovery in demand post-recession and prices then stabilised from 2016 to 2019. The data indicates that there has been no adverse impact to pine pulpwood prices as a result of biomass demand. In fact, pine pulpwood prices are now nearly 20% lower than in 2014 as shown on the chart below.

LaSalle BioEnergy market historic stumpage prices, USD$:tonne

LaSalle BioEnergy market historic stumpage prices, USD$:tonne

The character of the pine timberland is one of a maturing resource, increasing in the average size of each tree. The chart below chart shows a significant increase in the quantity of timber in the mid-range size classes, indicating a build-up of future resources for harvesting for both thinning and final felling for sawtimber production.

With balanced market demand, the supply of fibre in this catchment area should remain plentiful and sustainable in the medium term.

Historic pine inventory by DBH (diameter at breast height) class

Historic pine inventory by DBH (diameter at breast height) class

Forisk summary of the impact of LaSalle BioEnergy on key trends and metrics in this catchment area

Is there any evidence that bioenergy demand has caused …

Deforestation

No

Change in forest management practices

No

Diversion from other markets

Possibly. Bioenergy plants compete with pulp/paper and oriented strand board (OSB) mills for pulpwood and residual feedstocks. There is no evidence that these facilities reduced production as a result of bioenergy markets, however.

Increase in wood prices

No. There is no evidence that bioenergy demand increased stumpage prices in the market.

Reduction in growing stock of timber

No

Reduction in sequestration of carbon / growth rate

No

Increase in harvesting above the sustainable yield

No 

The impact of bioenergy on forest markets in the LaSalle catchment is …

Growing stock

Neutral

Growth rates

Neutral

Forest area

Neutral

Wood prices

Neutral

Markets for solid wood

Neutral to Positive. Access to viable residual markets benefits users of solid wood (i.e. lumber producers).

Forest in LaSalle catchment area

Forest in LaSalle catchment area

Read the full report: LaSalle, Louisiana Catchment Area Analysis. Read how a $15m rail link from LaSalle BioEnergy to the Port of Greater Baton Rouge helps Drax reduce supply chain emissions and biomass costs here. Take a 360 immersive experience and video tour of LaSalle BioEnergy.

This is part of a series of catchment area analyses around the forest biomass pellet plants supplying Drax Power Station with renewable fuel. Others in the series include: Georgia MillChesapeakeEstonia, Latvia and Drax’s own, other two mills Morehouse Bioenergy and Amite Bioenergy.

Latvia catchment area analysis

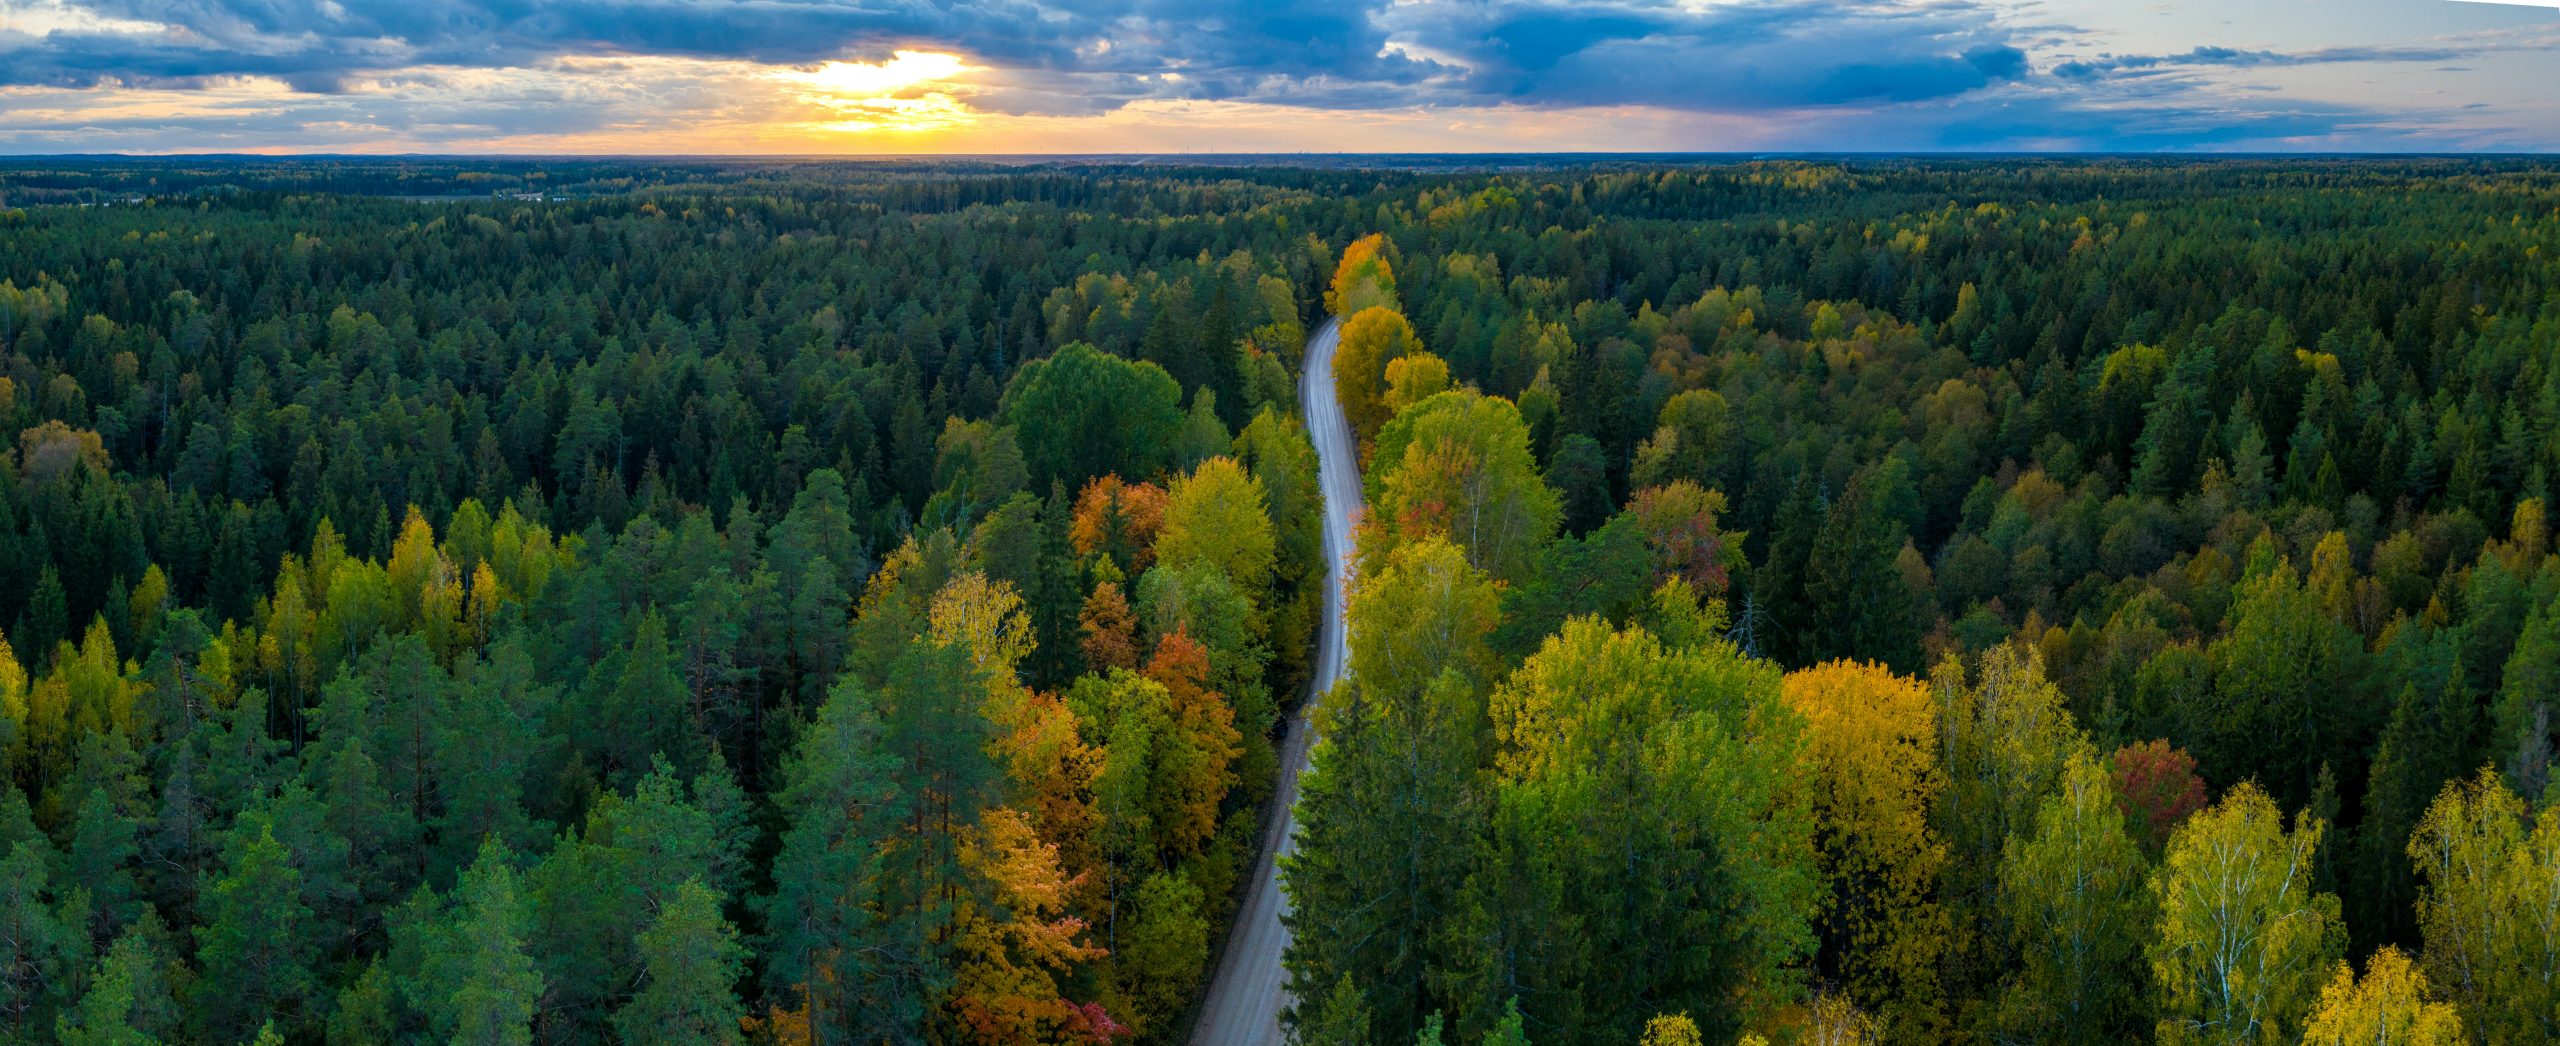
Panorama view of Latvian forest and road from above

Latvia is a heavily forested small country (about half the size of England), with 52% forest cover totalling 3.54 million ha (2.7 times bigger than the forest area in England and 11% bigger than the entire UK).

In its catchment area analysis report of the Baltic country, consultancy Indufor found:

  • Best management practice is driven by the State-owned sector with an increasing proportion of corporate owners improving management standards in the private sector
  • Markets are dominated by domestic saw-timber demand and pulpwood exports to neighbouring Scandinavia
  • Fuelwood, pellets and biomass are substantial and critical markets for low-grade fibre

Increasing forest area, carbon stored and no deforestation

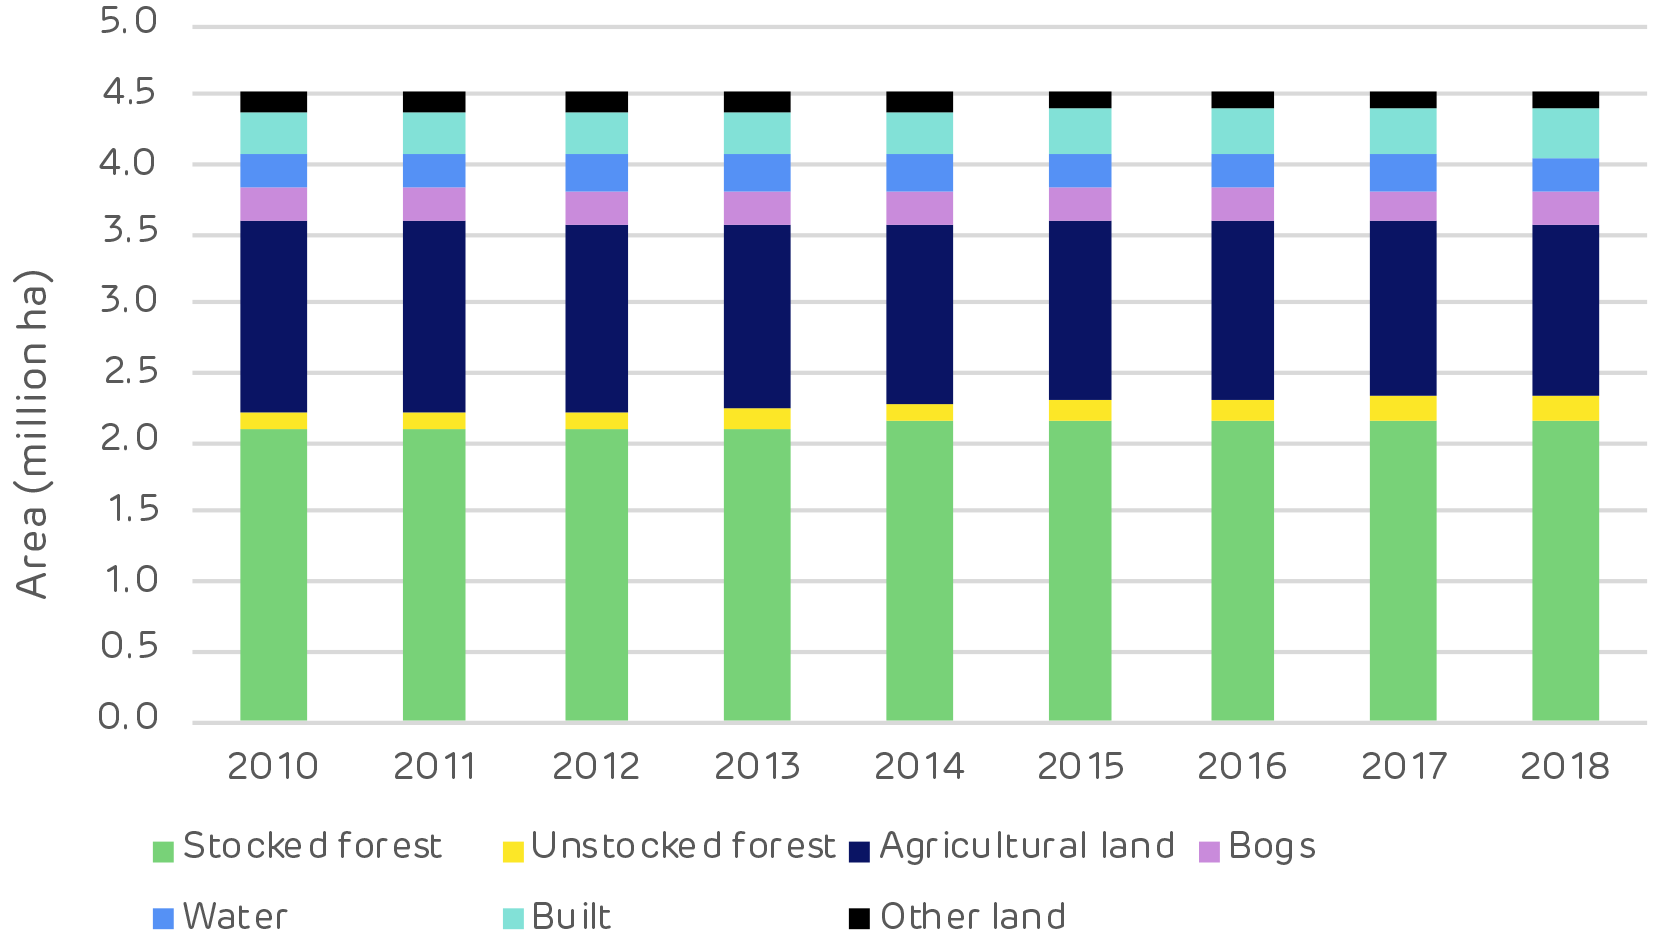
There has been an increase of around 400,000 hectares (ha) of forest in Latvia since 2000. This is due to natural afforestation of abandoned agricultural lands and also to an improvement in forest inventory analysis in 2009 which provided a more accurate assessment of land use and forestry data. Since 2010, the forest area has increased by 55,000 ha. There is no evidence of deforestation.
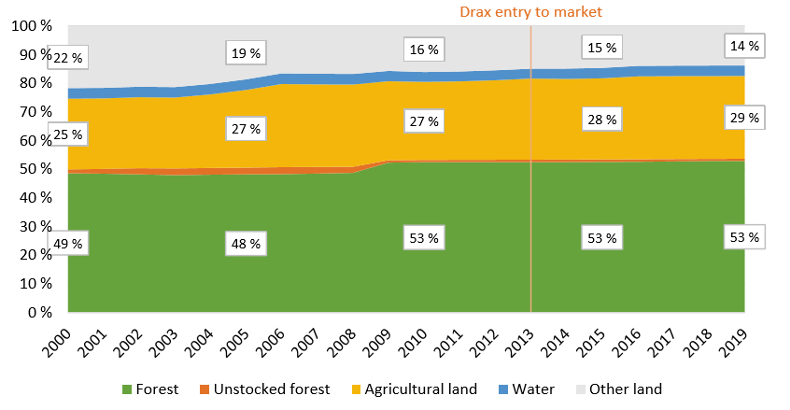
Primary land use Latvia

Primary land use Latvia

There has also been a substantial increase in forest carbon or growing stock. This increased by 106 million cubic metres (m3) since 2000 (75% hardwood) and by 33 million m3 since 2010 (57% hardwood).
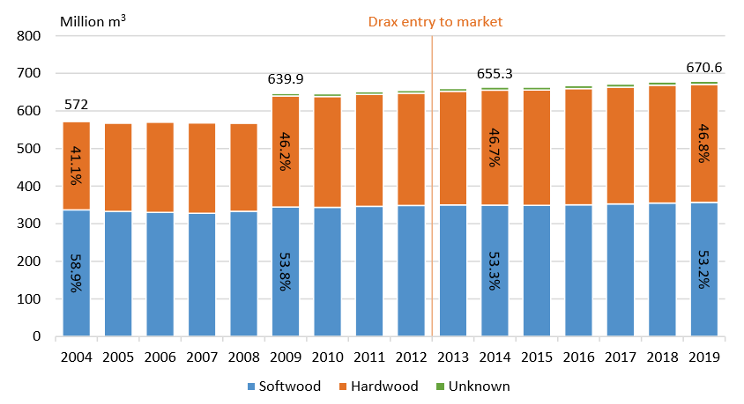
Increase in forest carbon

Increase in forest carbon

Limited hardwood markets

A proportion of the increase in hardwood volume in 2009 was due to the improvement of forest inventory calculations but also due to increased natural regeneration on unutilised land. The hardwood forest in Latvia and the Baltic region is quite different to that of the US South. In the Baltics there is prolific hardwood regeneration (birch, alder and aspen) which grows quite rapidly.

There are limited markets for structural timber, therefore hardwoods produce a lot of low-grade wood fibre. There are no domestic pulp markets in Latvia and only limited markets for panel board. Therefore, much of the low-grade wood fibre can only be used for firewood and biomass. The chart below shows a minor change in species composition from planted pine to naturally regenerated spruce and aspen – the most prolific regenerators in this region.
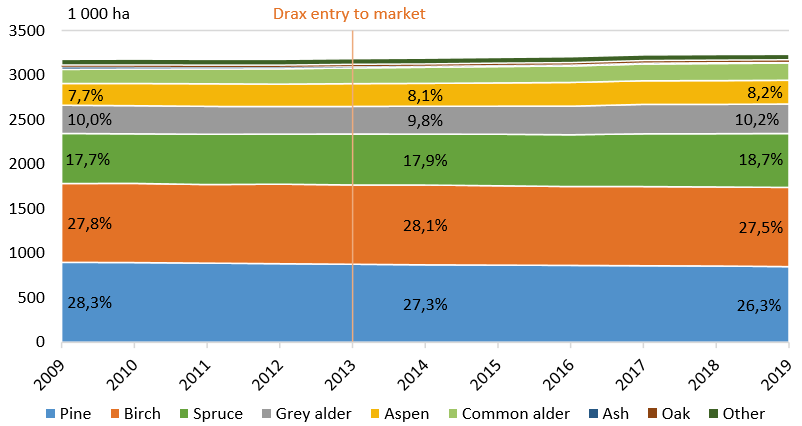
Varied species mix

Varied species mix

Planting and regeneration

State owned forests have a higher proportion of planted forest areas compared to the private sector where natural regeneration is preferred due to lower costs. Planting allows the owner to control the species mix, quality and growth. Whereas regeneration can be more of a lottery for both quality and species mix. As more corporate owners emerge, planting with improved stock may increase.
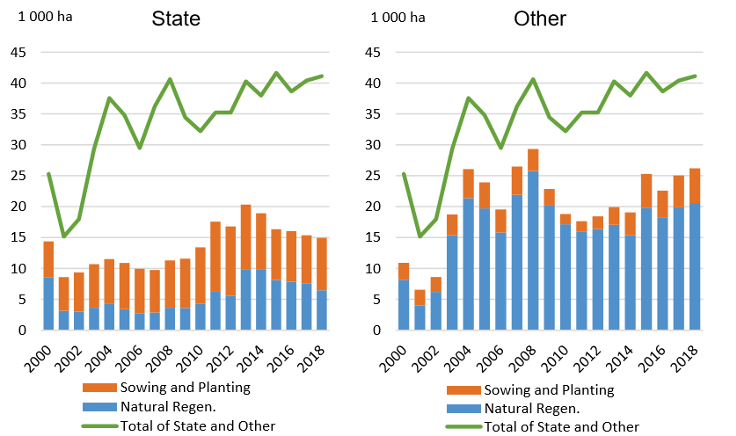
Restocking practice by ownership category

Restocking practice by ownership category

How the financial crisis impacted Latvian forests

Harvesting levels have been consistently below net annual increment since 2000. There have been some fluctuations in the annual allowable cut in State forests, particularly following the global financial crisis in 2008.

Harvesting in the private sector declined due to falling prices and sawnwood production dropped by 42% in 2009 compared to 2006. During that period, State-owned forest increased harvesting in order to support the industry in the absence of strong markets and private sector supply.

Post-recession, the harvesting balance returned and demand for wood products increased. The current surplus of growth compared to removals is around 5.5 million m3 p.a. or a growth drain ratio of 1.6.
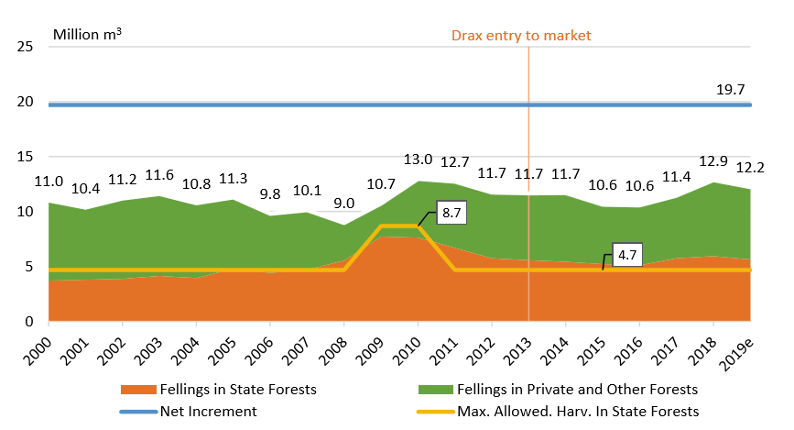
Surplus of growth compared to removals

Surplus of growth compared to removals

Biomass and pulp prices

Increasing wood pellet exports have had limited impact on wood prices. The feedstock for this market (fuelwood & forest chip) has limited competition and therefore remains fairly stable.

Pulpwood markets are driven by export demand to Scandinavia and can be volatile as this market fluctuates. 2018 saw a substantial spike in pulpwood prices due to increased export demand as a response to a global increase in pulp and paper prices boosting Scandinavian production. This had a minor knock on effect on the domestic fuelwood markets.
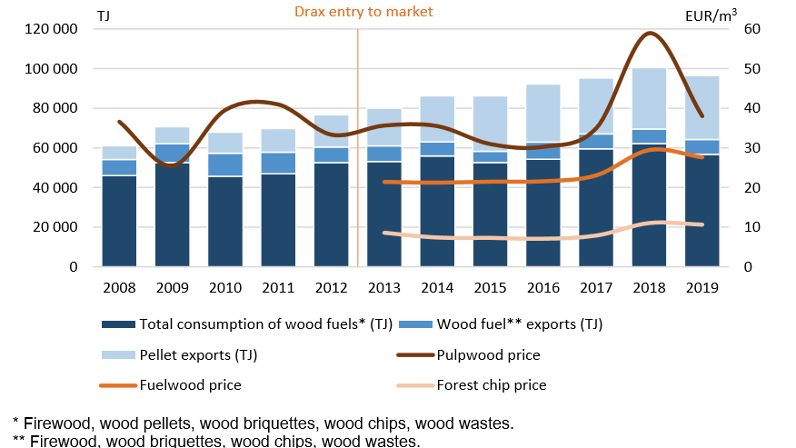
Variation of low-grade wood prices with changing demand

Variation of low-grade wood prices with changing demand

An important part of this analysis is to look for evidence to evaluate Drax’s performance against its new forest commitments, some of which relate directly to these trends and data sets.

Pine forest in Latvia

Pine forest in Latvia

Below, the consultant summarises the evidence of biomass impacts against key metrics in the forest industry of Latvia.

Is there any evidence that wood-based bioenergy demand has caused changes in …

Forest area / forest cover

No impact. Both forest area and forest cover have increased during the last two decades. The main driver of the growing forest area has been the natural regeneration of agricultural lands that were left uncultivated during the Soviet regime.

Forest growing stock

No impact. Forest growing stock has steadily increased throughout the observation period.

The main driver for harvesting level is the roundwood demand from sawmills, panel mills and export. Wood-based bioenergy demand may increase thinnings and residue collection, but it is not as significant a driver for total harvests as the aforementioned. Exported pellets have accounted for approximately 10-14% of the total volume of annual harvests in recent years, depending on the assumed average dry densities of the harvested wood and pellets.

Harvesting levels

No impact / slight increasing impact. The national felling volume is only about 65% of the national forest increment. The total harvesting area has been declining, while the total harvested volume has increased in the past 20 years. This can be explained by the diminished share of thinnings and increased share of clear-cuts. A decline in both area and volume of fellings can be seen between 2002–2008 and 2010–2016.

The main drivers of harvesting levels are sawmill industry, panel industry and export demand. However, wood demand for energy purposes can still improve the overall income for the forest owner and therefore increase the total harvesting levels in private forests

Harvesting residue collection

Increasing impact. Most of the collected residues originate from clear-cuts in state forests. Most produced harvesting residues are left in situ, and they are not over-exploited.

Collection of wood residues from harvesting operations has been increasing for the last 15 years as a result of increased capacities and demand from heat and CHP plants. Latvia is increasingly relying on woody biomass for energy generation.

Forest growth / carbon sequestration potential

No apparent impact. The total forest area and growing stock have grown in the last decade.

According to Latvia’s National Forestry Accounting Plan 2021–2025, the forests are decreasing their GHG sequestration capacity. Even a low sequestration rate increases carbon storage, which explains the increases in forest growing stock and area. The decrease in GHG sequestration capacity is due to forest ageing, emissions from soils and the increased share of broadleaved forests, which have lower carbon accumulation capacity than conifers.

Removal of harvesting residues decreases carbon sequestration since the residues are an input to the soil carbon pool. However, the majority of the harvesting residues’ carbon is released to the atmosphere when the biomass decays, so the ultimate impact of harvesting residue collection is minimal if the collection is done on a sustainable level. The sustainability of the collection is determined by how the soil nutrient balance is impacted by collection. This is not accounting for the substitution effect that the harvesting residues may have, by, e.g. reducing the need to burn fossil fuels.
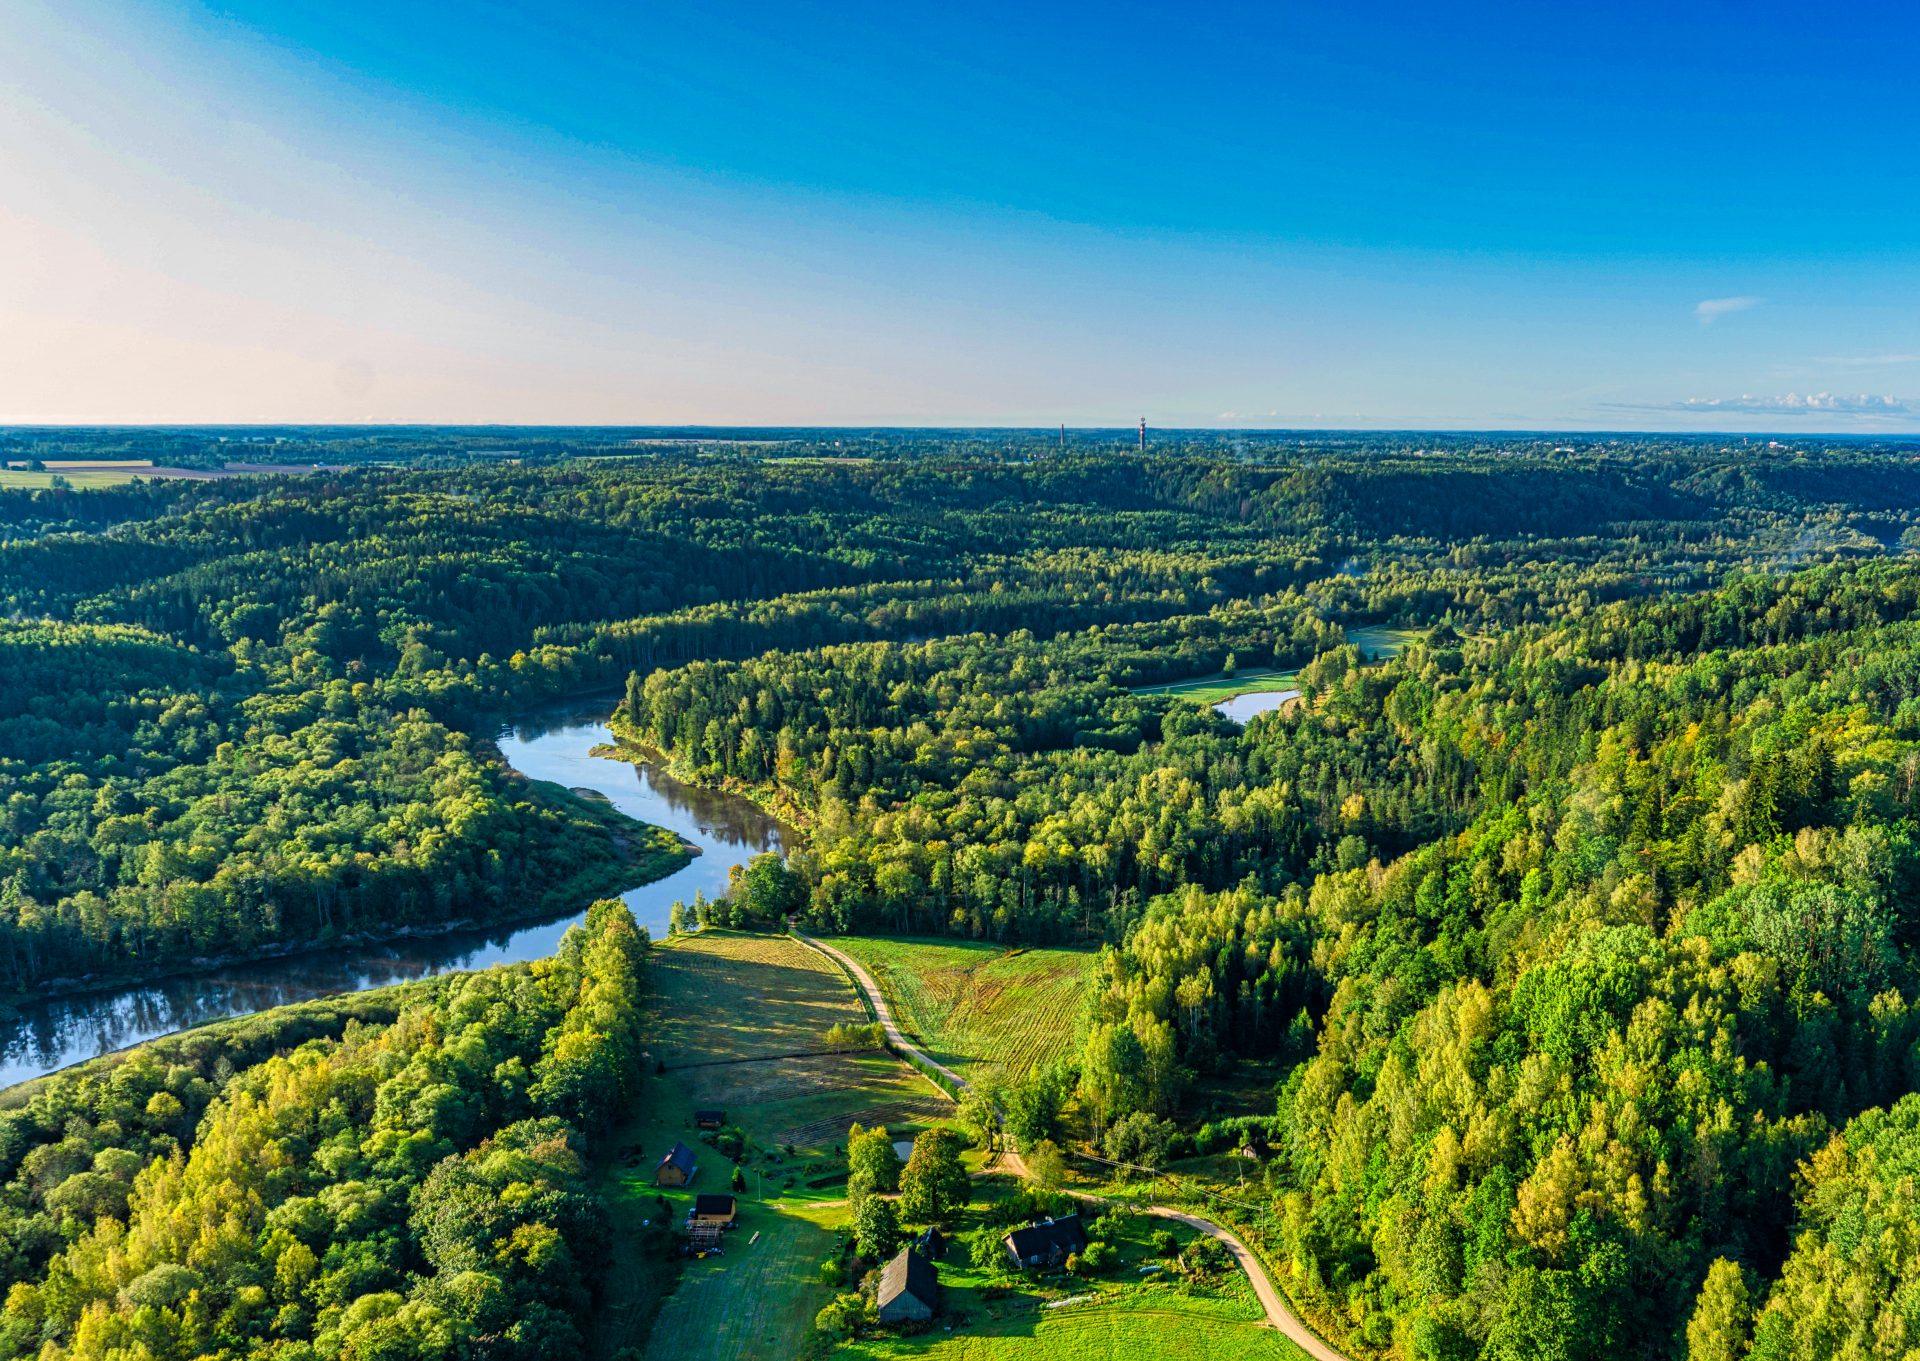
Aerial sight of warm, colorful autumn morning sunrise at forest covered picturesque river valley. Clear blue sky and high contrast shadows with magnificent reflections, breathtaking

Is there any evidence that wood-based bioenergy demand has caused changes to forest management practices …

Rotation lengths

No impact. The Law on Forests regulates minimum forest age and diameter for clear-cuts. The LVM and large-scale forest owners often conduct clear-cuts at minimum diameter, whereas smallholders tend to wait until roundwood prices are high. Due to the regulation, an increase of wood-based bioenergy demand has not shortened rotations.

Thinnings

Increasing impact in naturally afforested former agricultural lands. No impacts on thinnings overall. The total harvested area has been declining, while the total harvested volume has increased in the past 20 years. This can be explained by the diminished share of thinnings, due to existing forest age structure, and increased share of clear-cuts. Most of the harvesting residues are collected from clear-cuts.

There is an increased demand for small diameter wood and harvesting/processing residues overall.

The increased demand for small-diameter hardwood has increased harvesting in previously unmanaged afforested agricultural lands, which usually overgrow with broadleaved trees. These kinds of lands are usually otherwise not significant for forest management.

Conversion from hardwood to softwood

No impact. No indication of hardwood conversion to softwood was found. Instead, pine forests are decreasing due to the favouring of natural regeneration, which usually results in spruce or broadleaved forests in nutrient-rich and/or wet soils.

Is there any evidence that wood-based bioenergy demand has impacted solid wood products markets …

Diversion from other wood product markets

No apparent impact. Production of sawnwood and wood-based panels have increased or remained steady, i.e. no evidence of diversion.

Several interviews confirmed that sawlogs are not processed for other products besides sawnwood and wood-based panels.

Wood prices

No apparent impact. Prices of all wood assortments increased in 2017–2018, most notably the prices of pulpwood. This was due to difficult harvesting conditions and increased demand for pulpwood in Finland and Sweden, because of high market pulp prices. Pulpwood prices returned to pre-surge levels in 2019. Fuelwood prices also increased temporarily, but at a much more moderate rate. The main driver for fuelwood price increases was the surge of pulpwood prices.

Read the full report Catchment Area Analysis in Latvia. A 2017 interview with Raul Kirjanen, CEO of Graanul Invest, a wood pellet supplier of Drax operating in Latvia, can be read here. Read how Drax and Graanul work with NGOs when concerns are raised within our supply chain here.

This is part of a series of catchment area analyses around the forest biomass pellet plants supplying Drax Power Station with renewable fuel. Others in the series include: Georgia Mill, ChesapeakeEstoniaMorehouse Bioenergy and Amite Bioenergy.

Changing forest structure in Virginia and North Carolina

Photos: Roanoke Rapids area near the North Carolina, Virginia border, courtesy of Enviva.

Forest owners have responded to the recovery in pine saw-timber markets, since the global financial crisis of 2008, by planting more forest and investing more in the management of their land. The same period has witnessed increased demand from the biomass sector which has replaced declining need for wood from pulp and paper markets.

The area of timberland (actively managed productive forest) has increase by around 89,000 hectares (ha) since 2010. This change is due to three important factors: new planting on agricultural land; the planting of low-grade self-seeded areas with more productive improved pine; and the re-classification by the US Forest Service (USFS) of some areas of naturally regenerated pine from woodland to timberland.

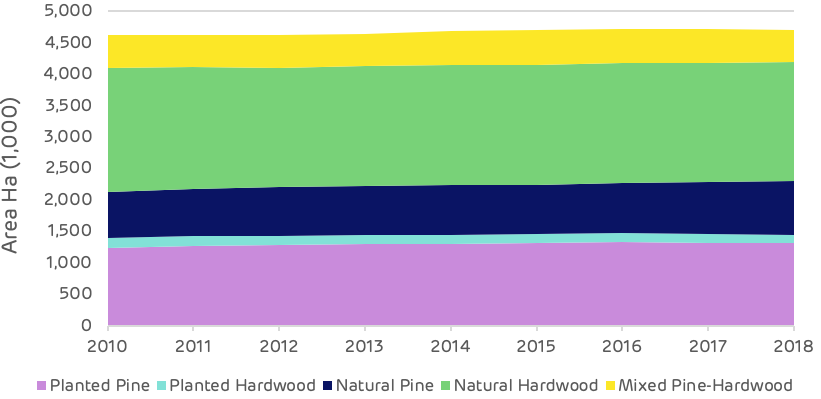
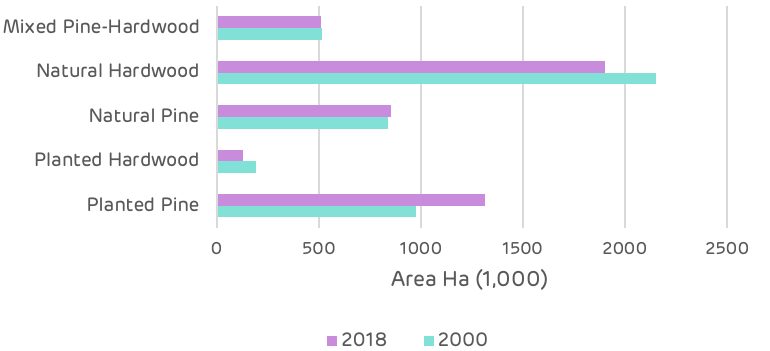
The 2018 data shows that pine forest makes up 46% of the timberland area, of which 61% is planted and the remainder naturally regenerated. Hardwoods cover 43% of the timberland area, with 93% of this naturally regenerated. The remaining area is mixed stands.

Composition of timberland area

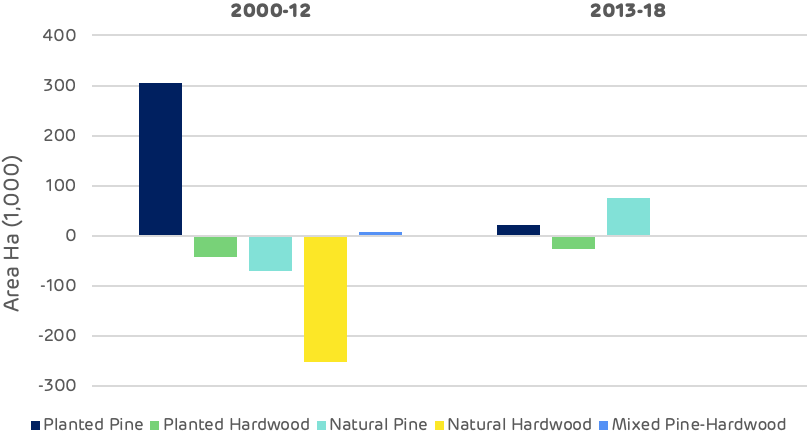
Since 2000 there have been some significant changes in the composition of the timberland area with a transition from hardwood to softwood. Pine has increased from 39% of the total area in 2000 to 46% in 2018 and hardwood has decreased from 50% to 43% over the same period.

All pine areas have increased since 2000 with naturally regenerated pine increasing by 13,000 ha and planted pine by 340,000 ha since 2000. Mixed stands have declined by 6,500 ha as some of these sites have been replanted with improved pine to increase growth and saw-timber production.

The biggest change has been in the hardwood areas where there has been a decline of around 314,000 ha, despite the total area of timberland increasing by 31,000 ha.

Change in forest type

This change has been driven by private forest owners (representing 91% of the total timberland area), seeking to gain a better return on investment from their forest land.

Hardwood markets have declined since the 2008 recession and demand for hardwood saw-timber has not recovered. Demand for pine saw-timber has rebounded and is now as strong as pre-crisis.

Pine also offers much faster growth rates and higher total volumes in a much shorter time frame (typically 25-35 years compared to 75-80 years for hardwoods).

The decision to change species is similar to a farmer changing their agricultural crops based on market demand and prices for each product. Where forests are managed for revenue generation then it is reasonable to optimise the land and crop for this objective. This can be a significant positive, from a carbon perspective more carbon is sequestered in a shorter time frame and more carbon is stored in long term wood products, if the quantity if saw-timber is increased.

Increased revenue generation also helps to maintain the forest area (rather than conversion to urban development, agriculture or other uses).

A potential negative is the change in habitat from a pure hardwood stand to a pure pine stand, each providing a different ecosystem and supporting a different range of flora and fauna. There is no conclusive evidence that one forest type is better or worse than the other; there is a great deal of variety of each type.

Some hardwood forests are rich in species and biodiversity, others can be unremarkable. The key is not to endanger or risk losing any species or sensitive habitat and to ensure that any conversion only occurs where there is no loss of biodiversity and no negative impact to the ecosystem.

It is not clear whether all of the lost hardwood stands have been directly converted to pine forests, some hardwood stands may have been lost to other land uses (urban and other land has increased by 400,000 ha). Some may have been directly converted to pine by forest owners encouraged by the increase in pine saw-timber demand and prices.

Whatever the primary driver of this change it is clearly not being driven by the biomass sector.

Change in forest type – timing

The chart above demonstrates that the biggest change, loss of hardwood and increase in planted pine, occurred between 2000 and 2012, prior to the operation of the pellet mills. Since 2012, there has been no significant loss of natural hardwood and only a small decline in planted hardwood.

Read the full report: Catchment Area Analysis of Forest Management and Market Trends: Enviva Pellets Ahoskie, Enviva Pellets Northampton, Enviva Pellets Southampton (UK metric version). Explore Enviva’s supply chain via Track & Trace. This is part of a series of catchment area analyses around the forest biomass pellet plants supplying Drax Power Station with renewable fuel. The series includes: Estonia, Morehouse Bioenergy, Amite Bioenergy, and the Drax forestry team’s review of the Chesapeake report on Enviva’s area of operations.

Chesapeake catchment area analysis

Photos: Roanoke Rapids area near the North Carolina, Virginia border, courtesy of Enviva.

Increased timberland, increased carbon stored in the forest, robust prices and new markets benefiting forest owners and forest workers, are among the findings of a report by Hood Consulting.

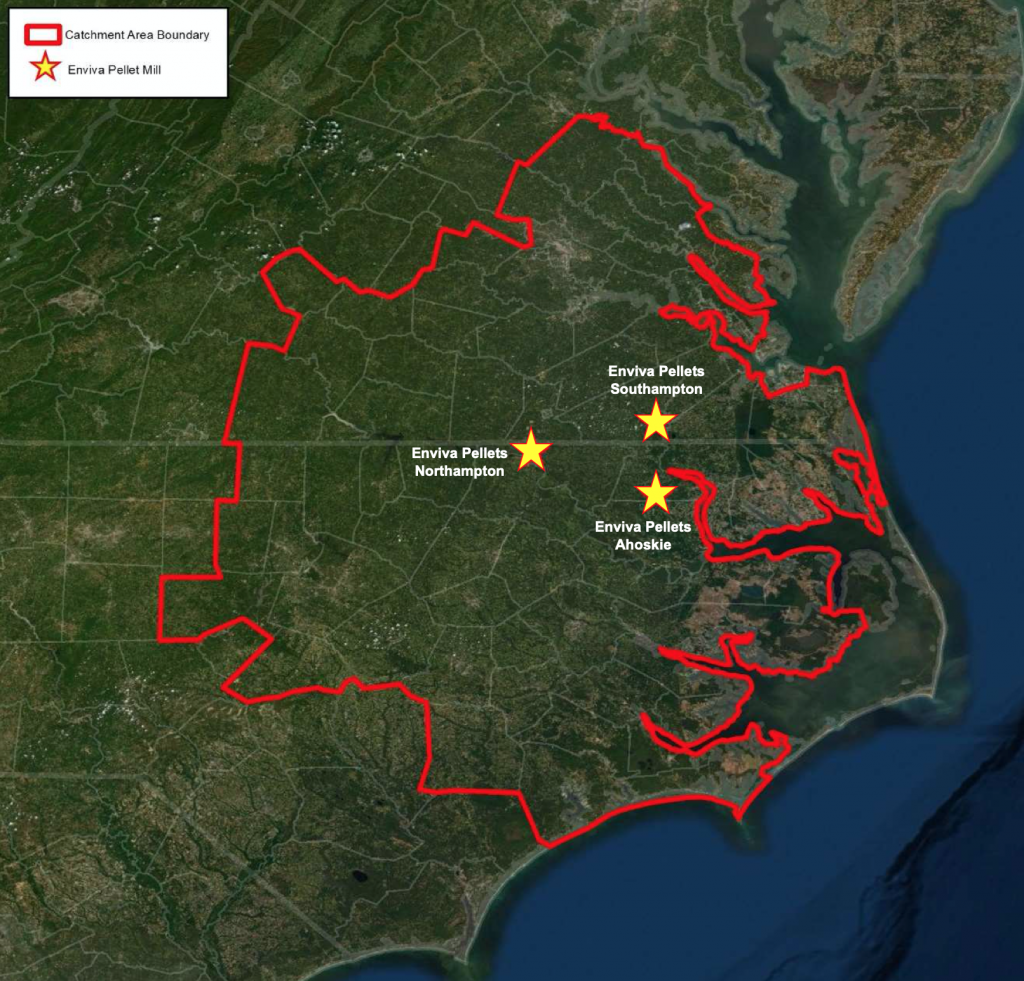
This fourth in a series of catchment area analyses for Drax looks at the area surrounding three pellet plants operated by Enviva: Ahoskie, Northampton and Southampton.

Enviva catchment area in Virginia and North Carolina

Forests and woodlands represent 68% of the total area at just over 5.4 million hectares (ha) with 87% of this area classified as timberland. The area of timberland (actively managed productive forest) has increased by around 89,000 ha since 2010 and there have been some significant changes in forest type.

The overall area of forest has increased and there is no evidence of deforestation occurring.

Land use by area

Since 2000, the total volume of standing timber in the catchment area has increased by 170 million cubic metres (m3). Sixty five percent of this increase has occurred since 2012, indicating a growing/maturing forest resource and an expanding forest area. Most of the increase in volume has been in the saw-timber categories for both pine and hardwood, although the hardwood pulpwood size class has also increased by nearly 10 million m3 since 2012 following a small decline between 2000 and 2012.

Timber inventory by product category

The increased demand from the three Enviva pellet mills, beginning operation in 2012 in the Chesapeake region, appears to have had no negative impact of the accumulation of forest carbon in the growing stock of the region. Since this time, all categories of timber product have increased.

Timber inventory by product category – pre and post-Enviva

This increase in inventory is also reflected in the comparison of average annual growth to removals. The surplus of un-cut growth has increased substantially since 2010 from 4.7 million m3 per year  to 15.9 million m3 p.a. Over this period annual growth has increased by 35.5% whereas removals have decreased by 8.6%.

Annual growth vs. removals and surplus volume

Demand for timber products has fluctuated since 2000. The global financial crisis in 2008-09 impacted all product categories, but particularly pine and hardwood saw-timber where there was a combined drop of over five million tonnes in 2010 compared to 2000. This was a loss of over 20% of total annual demand in the catchment area. Pine saw-timber has now recovered to pre-crisis levels, but hardwood demand has remained low. Hardwood pulpwood demand also declined around this time, with the closure and decline of existing pulp mills in the catchment area. Demand had fallen by one million tonnes p.a. by 2011 prior to the Enviva pellet mills opening. From 2012 the new biomass demand enabled the hardwood pulpwood market to recover to pre-crisis levels with demand in 2018 at almost exactly the same level as in 2000.

Annual demand by product category

This fluctuation in demand is reflected in the average annual stumpage price data shown on the chart below, this is the value that the forest owner gets for each product. The trends are generally as expected, with the exception of the hardwood saw-timber price, which has increased substantially despite a decrease in demand. This is due to supply chain issues, reduced capacity of loggers and access to land.

Average annual stumpage prices

Detailed below is an edited version of the consultant’s review and analysis of key issues in the catchment area.

The full version can be found in the main report.

Is there any evidence that bioenergy demand has caused the following?

Deforestation

No. US Forest Service (USFS) data shows the opposite. The total area of timberland in the Enviva Chesapeake catchment area has increased an estimated 82,818 hectares (+1.8%) since Enviva Pellets Ahoskie commenced full production in 2012.

A change in management practices (rotation lengths, thinnings, conversion from hardwood to pine)?

No / Inconclusive. Changes in management practices have occurred in the catchment area since 2012, but there is little evidence to suggest that bioenergy demand has caused these changes. Conversion of hardwood and mixed pine-hardwood timberland to planted pine timberland has occurred in the catchment area.

Diversion from other markets

No / Inconclusive. Since 2012, pulpwood demand not attributed to bioenergy has decreased 19%; however, this decrease is largely attributed to decreased demand from the pulp/paper sector. Also, demand for softwood and hardwood sawlogs have increased an estimated 14% and 7%, respectively, since 2012.

An unexpected increase in wood prices

No / Inconclusive. The increase in hardwood biomass demand coincided with price increases of 10-24% for delivered hardwood pulpwood. These price increases were likely linked to a combination of both supply chain issues (shortage of local loggers following pulp/paper mill closures in the region) and elevated prices offered by Enviva to ensure guaranteed wood supply for the first several years of operation, as prices for delivered hardwood pulpwood and hardwood chips proceeded to decline 16% and 9%, respectively, from 2014 to2017 once the market stabilised.

Since 2014, prices for pine products have held flat even though softwood raw material purchases (demand) by Enviva have more than doubled. In this catchment area, changes in pine pulpwood and pine chip prices are largely driven by demand attributed to the pulp/paper sector.

A reduction in growing stock timber

No. Total growing stock inventory in the catchment area increased 19% from 2012 through 2018. Over this period, inventories increased as follows for each of the five major timber products: +33% for pine sawtimber, +23% for pine chip-n-saw, +14% for pine pulpwood, +12% for hardwood sawtimber, and +14% for hardwood pulpwood.

The increase in timber inventory can be linked to a combination of increased forest area (additional hectares = additional inventory) and annual harvest levels below the sustainable yield capacity of the catchment area forest (i.e. annual growth has continued to exceed annual removals, resulting in increased inventory levels).

A reduction in the sequestration rate of carbon

No. US Forest Service data shows the average annual growth rate of growing stock timber has increased slightly since 2012. Increased timber growth rates/carbon sequestration rates can be linked to a combination of changes in species composition and silvicultural practices.

Softwood (pine) grows at a much quicker rate compared to hardwood species, and in the Enviva Chesapeake catchment area, pine timberland area increased from 43.6% of total timberland area in 2011 to 46.0% in 2018. Also, improvements in silviculture have continued to enhance growth and overall productivity. Together, these factors help explain how average per hectare volume growth increased from 5.9 m3 in 2011 to 7.7 m3 in 2018.

An increase in harvesting above the sustainable yield capacity of the forest area

No. In 2018, the latest available, growth-to-removals ratio for pine and hardwood pulpwood, the timber products utilised by bioenergy, equalled 2.49 and 2.76, respectively (a value greater than 1.0 indicates sustainable harvest levels). Even with the increased harvesting required to satisfy bioenergy demand, harvest levels remain well below the sustainable yield capacity of the catchment forest area.

What has been the impact of bioenergy demand on?

Timber growing stock inventory

Neutral. Total wood demand increased an estimated 14% from 2012-2018, and much of that increase can be attributed to increased demand from bioenergy. In this catchment area, inventories are so substantial that increases in demand from bioenergy, as well as from other sources, have not been great enough to offset annual timber growth. Total growing stock inventory has continued to increase – an average of 2.9% per year since Enviva first entered this market in 2012.

Timber growth rates

Neutral. Timber growth rates have increased for pine sawtimber, pine chip-n-saw, pine pulpwood, and hardwood pulpwood since 2012; hardwood sawtimber growth rates have declined slightly. Evidence suggests these overall increases in growth rates are linked to changes in age class distribution (i.e. a younger forest), not due to changes in bioenergy demand

Forest area

Positive / Neutral. Total forest (timberland) area in the catchment area increased nearly 83,000 hectares (+1.8%) from 2012 through 2018, the latest available. Our analysis of biomass demand and forest area found a strong positive correlation between these two variables but also a moderately strong correlation between softwood sawlog demand and forest area.

Wood prices

Neutral / Negative. The additional wood demand placed on this market by Enviva from 2012-2014 coincided with a 19% increase in delivered pine pulpwood price and a 24% increase in delivered hardwood pulpwood price. Pine and hardwood chip prices also increased 10-11% over this period. Analysis found evidence that increases in hardwood pulpwood and hardwood chip prices can be linked to increases in total hardwood pulpwood demand. However, given that hardwood bioenergy demand has accounted for over 75% of total hardwood pulpwood demand in the catchment area since 2014, it is reasonable to conclude that hardwood pulpwood demand attributed to bioenergy has had some level of impact on delivered hardwood pulpwood and hardwood chip prices.

Markets for solid wood products

Positive. In the Enviva Chesapeake catchment area, demand for softwood and hardwood sawlogs used to produce lumber and other solid wood products increased 15% and 9%, respectively, from 2012-2018. A by-product of the sawmilling process are sawmill residuals – a material utilied by Enviva’s three mills to produce wood pellets. With the increased production of both softwood and hardwood lumber, so too has come an increase in sawmill residuals, some of which has been purchased/consumed by Enviva.

Not only has Enviva benefited from the greater availability of this by-product, but lumber producers have also benefited, as Enviva’s three mills have provided an additional outlet for these producers and their by-products.

Forest landowners

Positive. Increased demand attributed to bioenergy has been a positive for forest landowners in the Chesapeake catchment area. Not only has bioenergy provided an additional outlet for pulpwood (particularly hardwood pulpwood), but the increase in pulpwood prices as a result of an overall increase in both softwood and hardwood pulpwood demand has transferred through to landowners (improved compensation).

Specifically, since 2013 (the first year all three Enviva pellet mills were operating), hardwood pulpwood stumpage price – the price paid to landowners – has averaged roughly $5.60 per ton in the Chesapeake catchment area. This represents a 47% increase over the approximately $3.80 per ton averaged by hardwood pulpwood stumpage in the catchment area over the 10 years prior (2003-2012). Similarly, pine pulpwood stumpage price has averaged $12.95 per ton in the catchment area since 2013, up 67% from the 2003-2012 average of $7.75 per ton.

Read the full report: Catchment Area Analysis of Forest Management and Market Trends: Enviva Pellets Ahoskie, Enviva Pellets Northampton, Enviva Pellets Southampton (UK metric version). Read the Drax forestry team’s blog ‘Changing forest structure in Virginia and North Carolina. Explore Enviva’s supply chain via Track & Trace. This is part of a series of catchment area analyses around the forest biomass pellet plants supplying Drax Power Station with renewable fuel. Others in the series include: Georgia Mill, Estonia, Latvia, Morehouse Bioenergy and Amite Bioenergy.

Estonia catchment area analysis

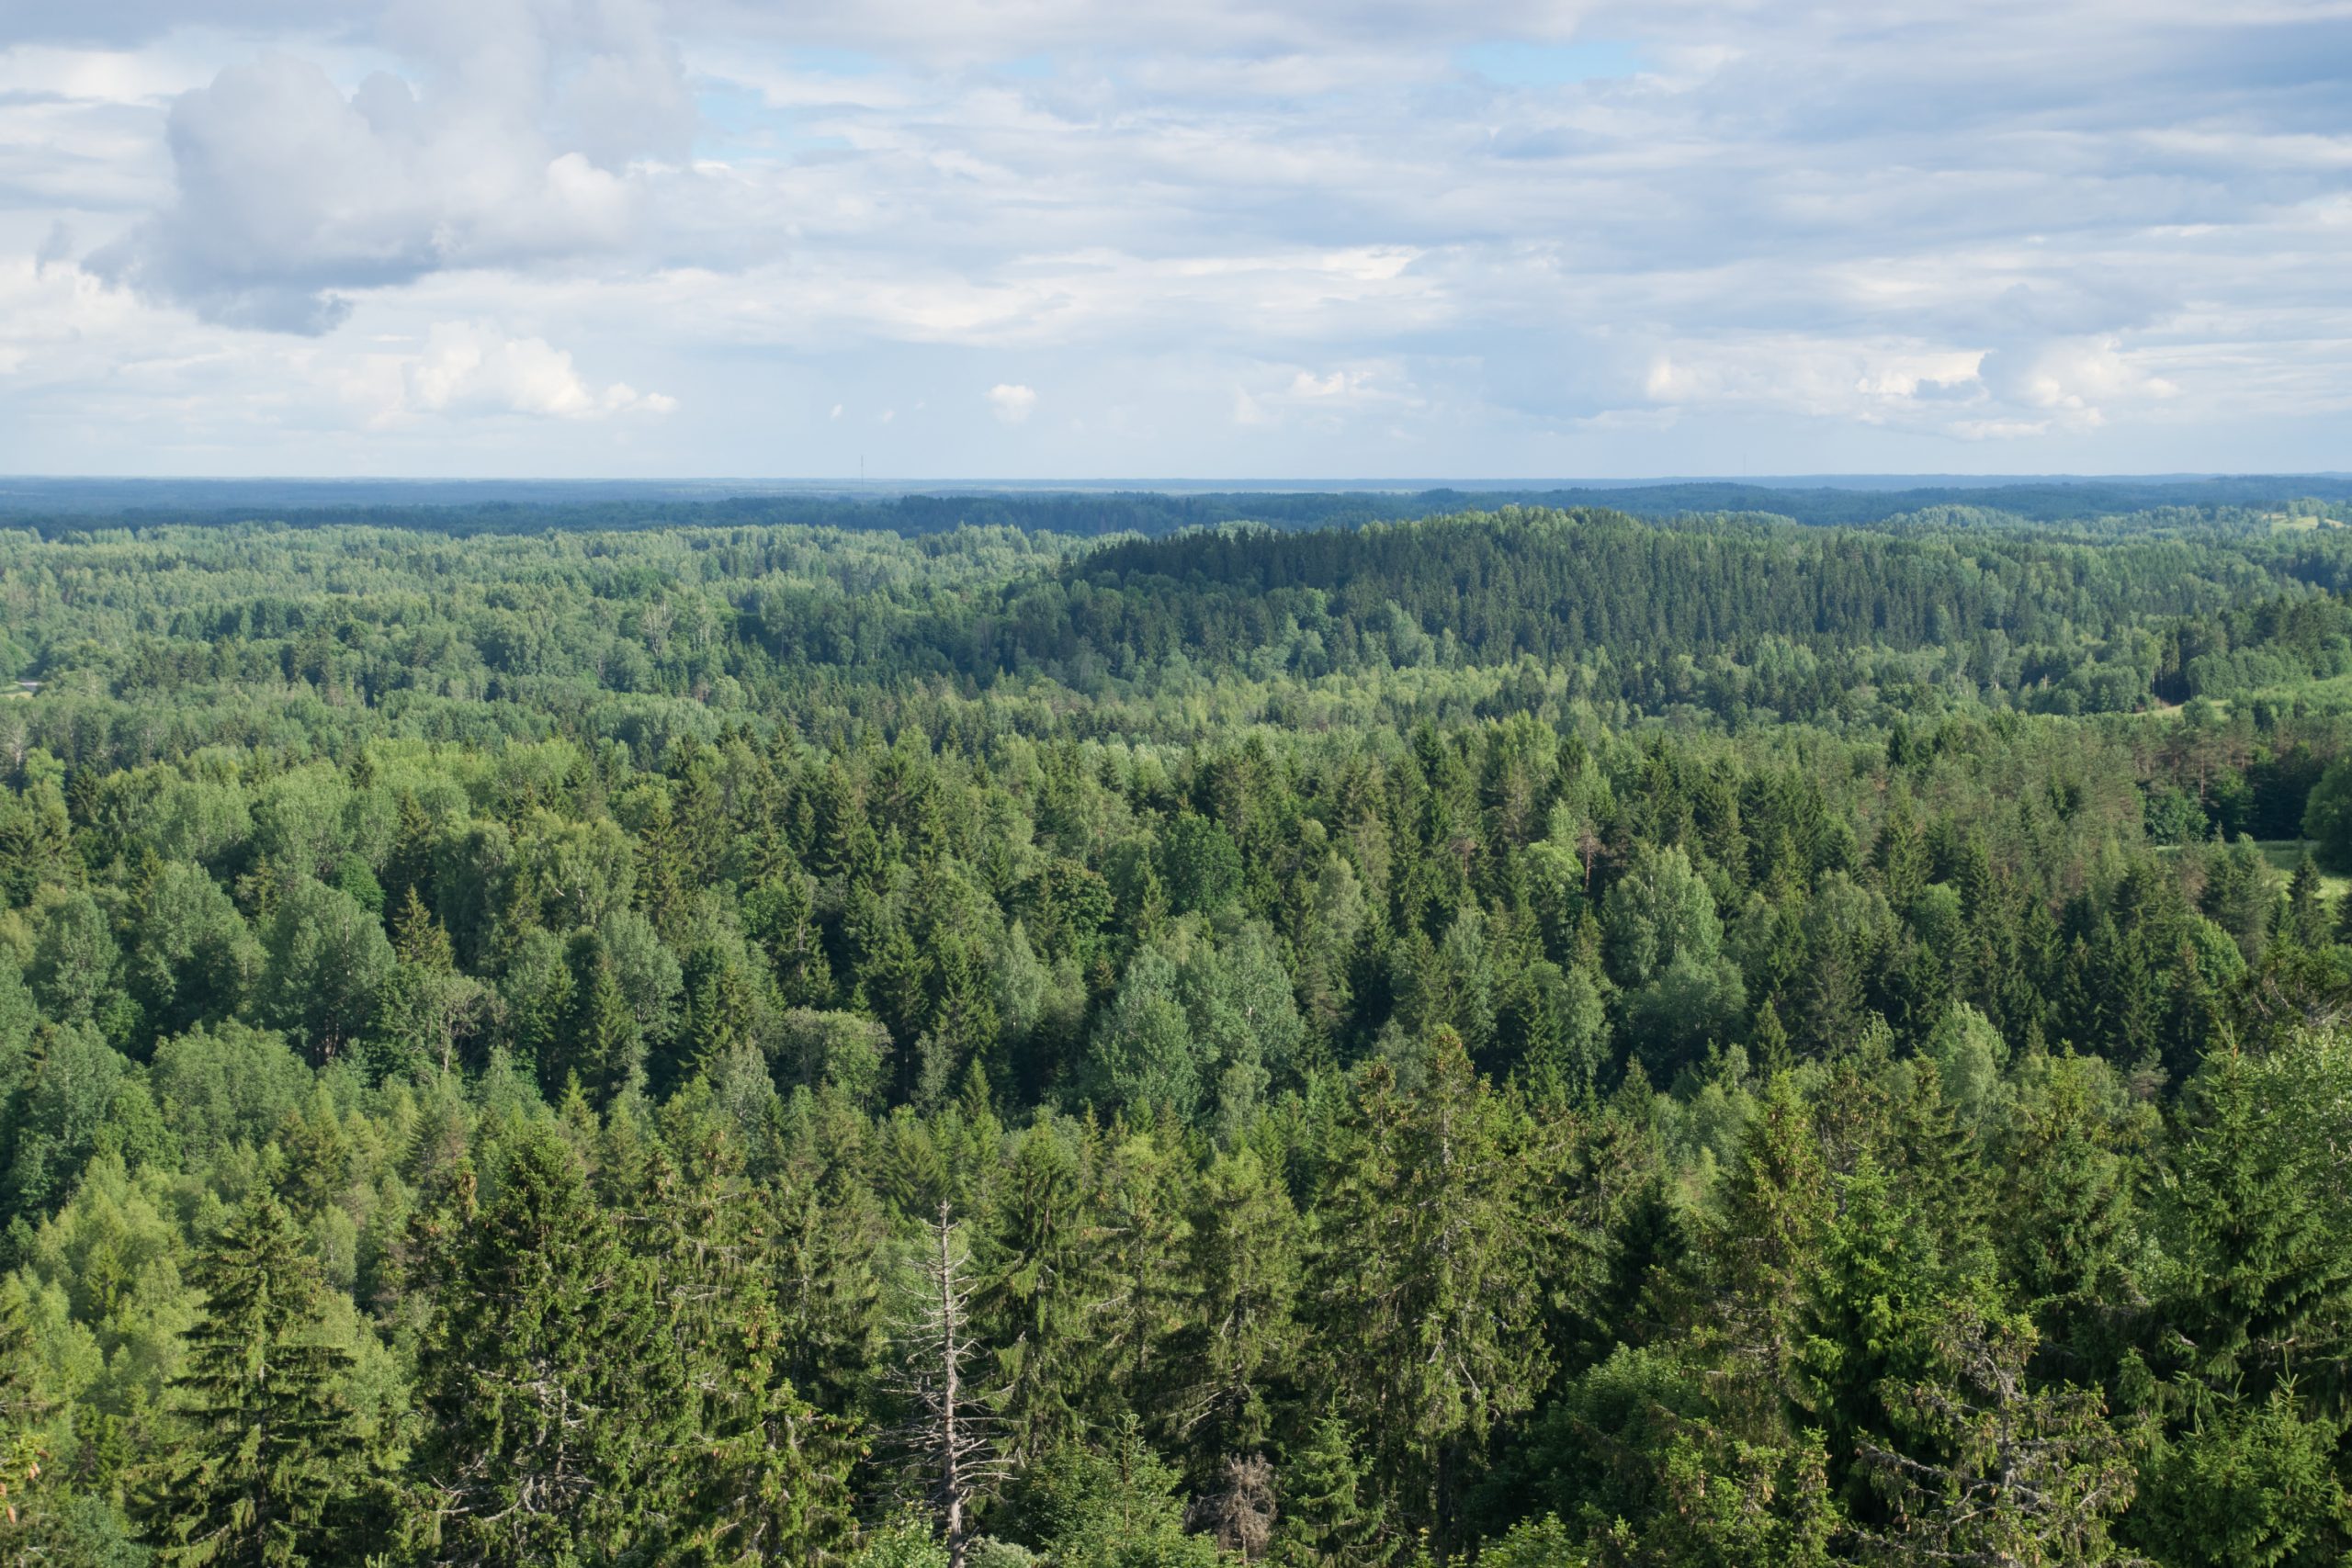
View from Suur Munamagi over forest landscape in South Estonia.

Estonia is a heavily forested country with a mature forest resource that has been neglected over many years due to political and ownership changes. Management of state and corporate owned forests is now good, but some small privately-owned areas of forest are still poorly managed.

Despite this, both the forest area and the growing stock have been increasing, largely due to new planting and the maturing age class of existing forest.

Forest area has increased from 49% to 52% of the total land, increasing by more than 118 thousand hectares since 2010.

Land use in Estonia

Land use in Estonia [click to view/download]

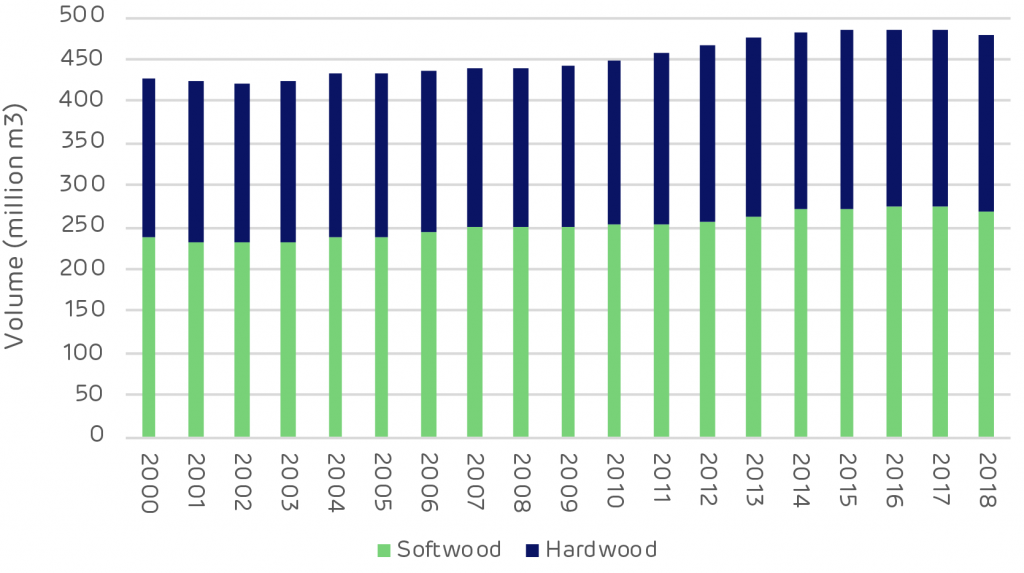
Over the same period the growing stock increased by 52 million m3, with 60% of this growth in softwood and 40% in hardwood species. The data shows a slight decline in 2018 but this is due to a sampling error and the growing stock is thought to have been maintained at 2017 levels (this should be rectified in the 2019 data when available).

Change in forest growing stock – Estonia

Change in forest growing stock – Estonia [click to view/download]

The forests of Estonia have been going through a period of restitution since the 1990s. Land that had been taken into state ownership during Soviet rule has been given back to private owners. This process was complex and lengthy and limited active management in the forest during this time.

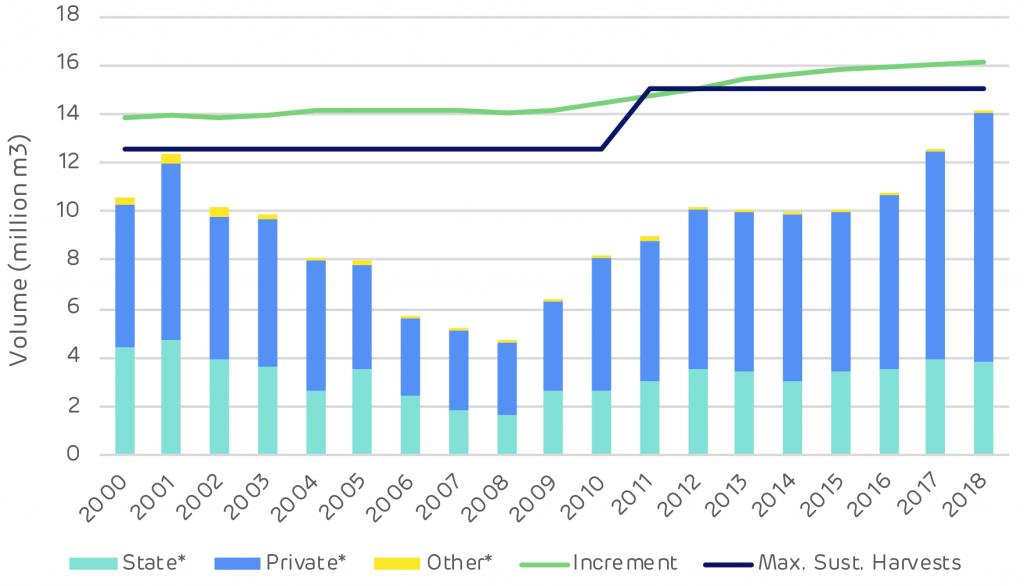
Since 2008, harvesting and management has increased. Private and corporate forest owners have been harvesting forest that had been mature and ready for clear felling. The longer-term harvesting trend has been considerably lower than annual growth (increment) and the maximum sustainable harvesting level, as shown on the chart below.

Annual increment and harvesting levels

Annual increment and harvesting levels [click to view/download]

In 2018 harvesting reached an all time high at just over 14 million m3 and just under the maximum threshold. It is expected to remain at this level as more forest matures and enters the cycle of harvest and regeneration.

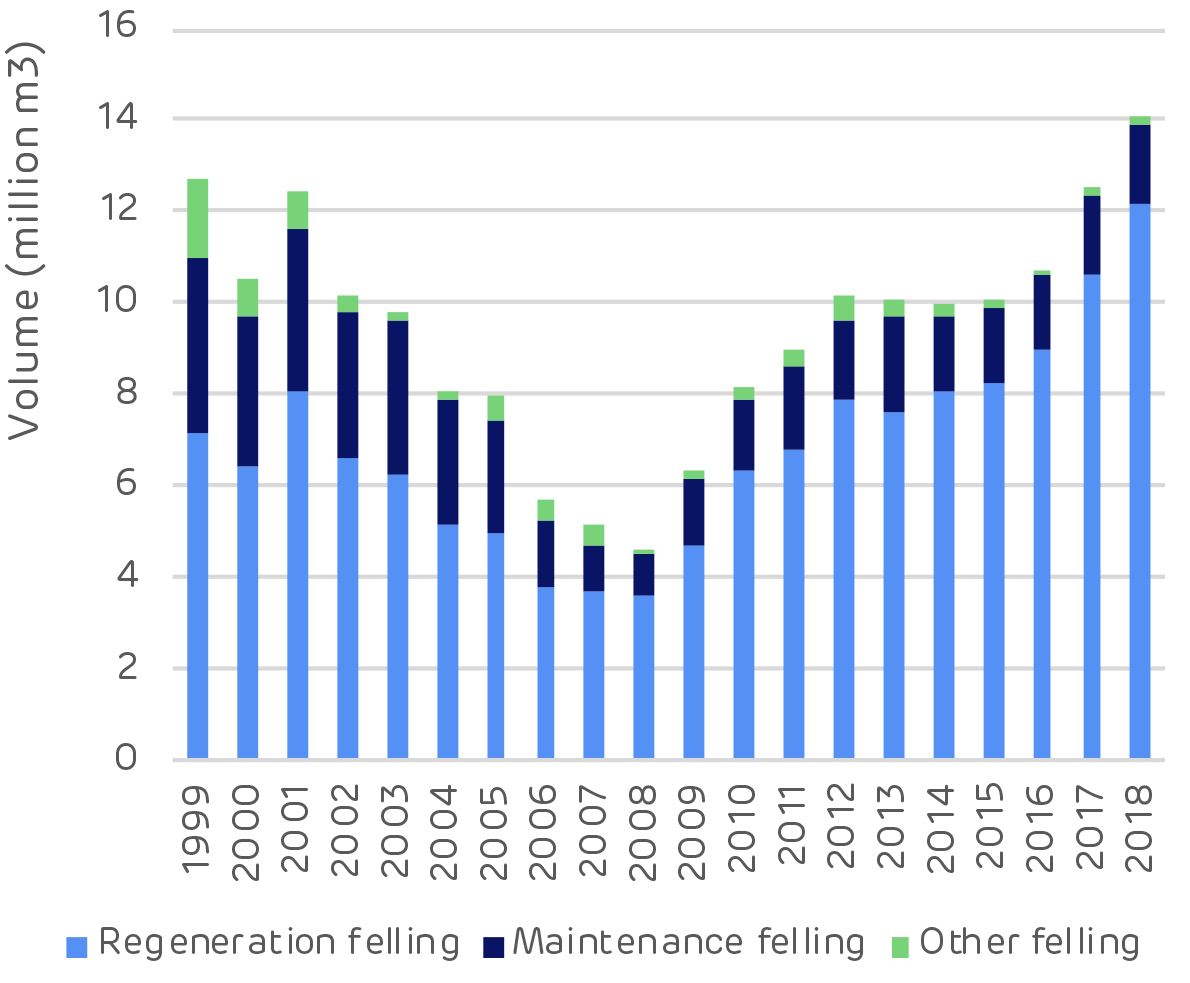
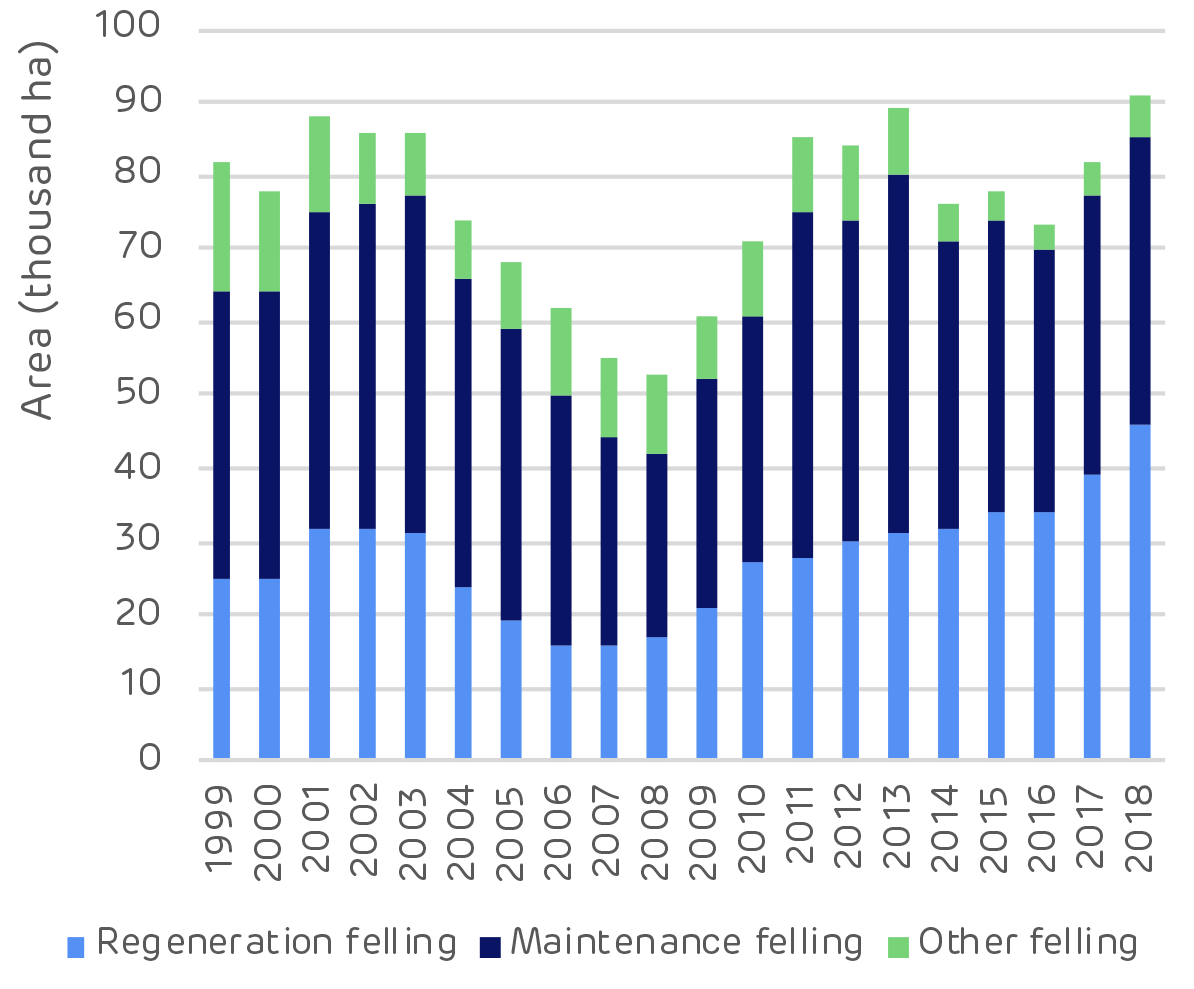
Clear cutting (regeneration felling) is the largest operation by volume but thinning (maintenance felling) is the largest by area.

This indicates a forest landscape in balance, with widespread thinning to produce more sawlog trees and a large volume of clear cuts in the mature stands to make way for the next generation of forests.

Reforestation in Estonia. * Note: Since 2014 it has not been compulsory for private and other forest owners to submit reforestation data. [Click to view/download]

Reforestation in Estonia. * Note: Since 2014 it has not been compulsory for private and other forest owners to submit reforestation data. [Click to view/download]

Planting of seedlings is the most common form of regeneration. However, some native hardwood species are strong pioneers and naturally regenerate among the spruce and pine stands. This has led to a change in the species composition of some forests with an increase in hardwoods, although this is relatively small scale and only prevalent among some small private owners that do not invest in clearing unwanted regeneration.

Species mix in Estonian forests [Click to view/download]

Species mix in Estonian forests [Click to view/download]

Markets and prices for forest products

Sunrise and fog over forest landscape in Estonia

Sunrise and fog over forest landscape in Estonia

Pulpwood markets are limited in Estonia and this material has been historically exported to neighbouring Finland and Sweden. Export demand has had a significant impact on prices as can be seen in a spike in 2018 when demand was at its strongest.

The forest industry has been dominated by sawmills and panel board mills. Demand and production in this sector has been increasing and this has kept prices high. There is a substantial differential between sawlog and pulpwood pricing.

Comparison of sawlog and pulpwood prices [click to view/download]

Comparison of sawlog and pulpwood prices [click to view/download]

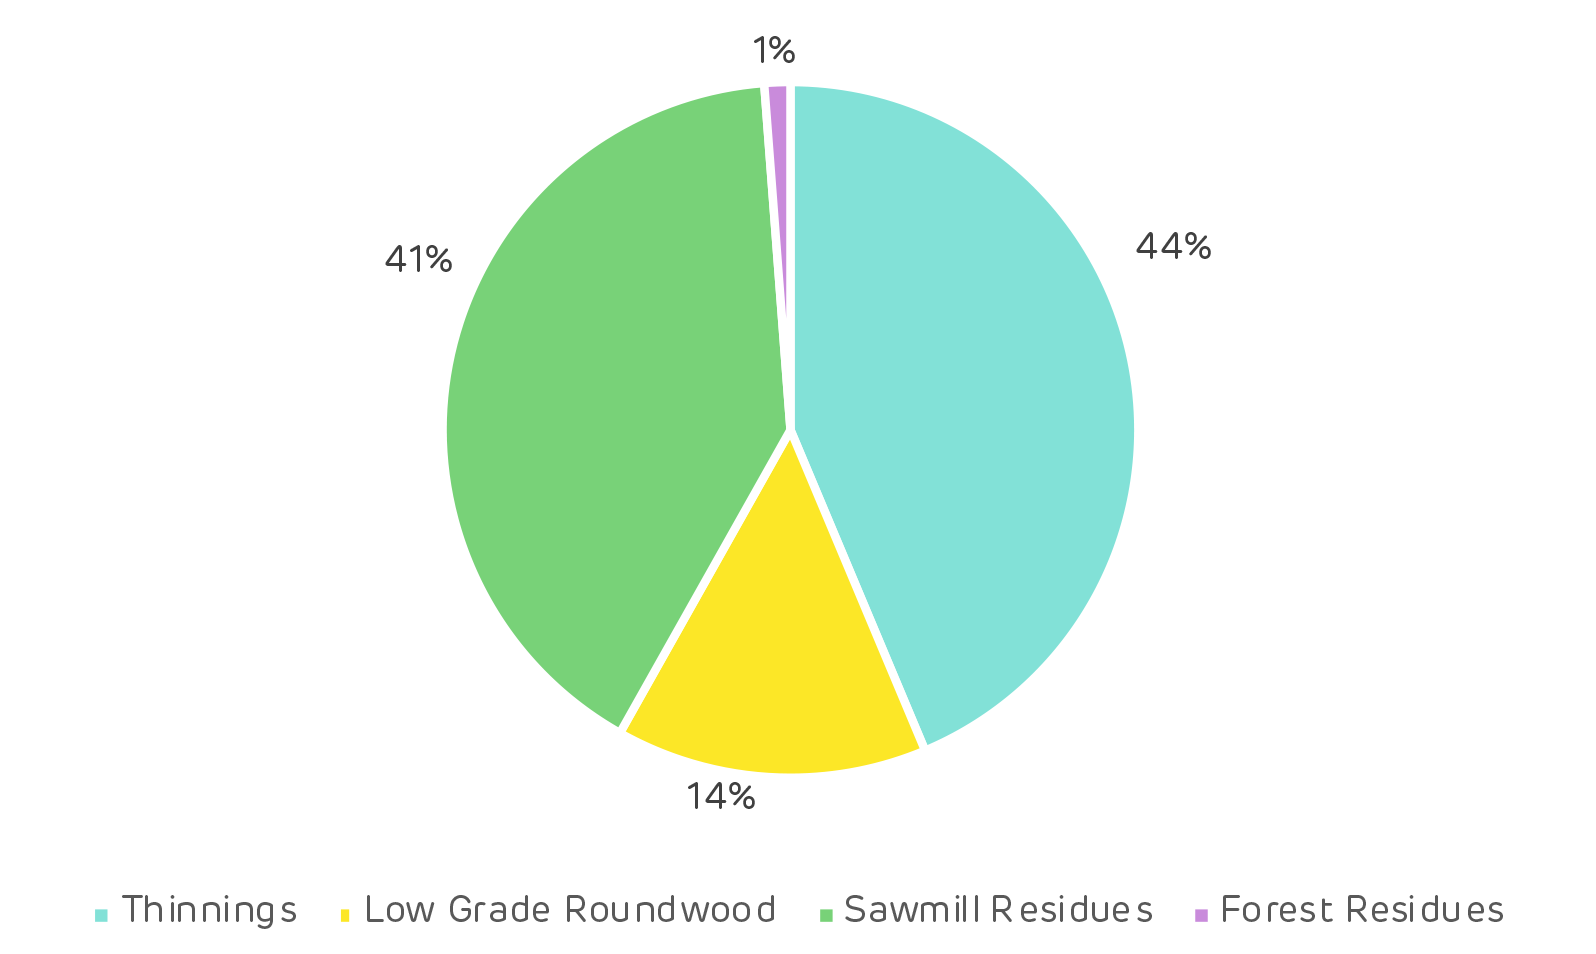
The pellet industry developed due to the abundance of low-grade fibre available domestically. This included sawmill and forest residues, as well as low grade roundwood from thinnings and clear cuts. Drax’s suppliers use a combination of these feedstock sources as shown below.

Drax feedstocks from Estonia 2018 [click to view download]

Sunrise through forest in Estonia

Sunrise through forest in Estonia

Summary of key questions addressed in the analysis:

Impacts of wood-based bioenergy demand to forest resources:

Forest area / forest cover

No negative impact. Regardless of increasing domestic biomass utilisation for energy and exports, forest area has increased due to afforestation programmes. Forest cover is not as high as forest area, due to temporarily un-stocked area after clear-cut. Despite this, forest cover has continuously increased from 2010–2018.

Growing stock

No negative impact. The total forest growing stock has been increasing for the last two decades. In 2018 the growth slowed or halted (official statistics show a decrease, but this is due to sampling error). In 2018 there was record-high wood demand from Finland, which was driven by high global pulp prices motivating maximal pulp production. This increased harvests to a previously unseen level.

Harvesting levels

Slight increasing impact. During 2004–2011, harvesting levels in Estonia were less than half of the estimated maximum sustainable level. This resulted in an increase in the maximum sustainable harvesting level for the 2011–2020 period. In 2018, the harvesting volumes were at the maximum sustainable level. The main drivers increasing the harvesting volumes have been increased sawmill capacity and production, high demand for pulpwood in Finland and Sweden and improved demand for energy wood. This was a temporary peak and demand has already slowed. Softwood lumber prices have decreased significantly in Europe due to an abundance of wood supply from Central Europe, which has been created by widespread bark beetle and other forest damages. Global pulp prices have also decreased to below 2017 prices.

Forest growth / carbon sequestration potential

Ambivalent impact. The annual increment has grown throughout the 2000–2018 period. Increased fuelwood price has enabled forest management in some of the alder forests that were completely unutilised in the past. Thinnings, both commercial and pre-commercial, accelerate long-term volume growth in forests, leading to increased carbon sequestration. Removal of harvesting residues decreases carbon sequestration since the residues are input to the soil carbon pool. However, the majority of the harvesting residues’ carbon is released to the atmosphere when the biomass decays, so the ultimate impact of harvesting residue collection is minimal if the collection is done on a sustainable level. The sustainability of the collection is determined by how the soil nutrient balance is impacted by collection. This is not accounting for the substitution effect that the harvesting residues may have, by e.g. reducing the need to burn fossil fuels. Utilisation of sawmill by-products does not directly impact forests’ carbon sequestration potential, but it can increase harvesting through improved sawmill overall profitability.

Impacts of wood-based bioenergy demand to forest management practices:

Rotation lengths

Neutral. Forest law regulates minimum forest age for clear-cuts. According to interviews, Riigimetsa Majandamise Keskus (RMK – the Estonian state forest company), often conducts the final felling at the minimum age. Due to the regulation, an increase of wood-based bioenergy demand has not shortened rotations at least in state-managed forests. In forests that are older than the minimum final felling age, sawlog price is a more important driver for final-felling decisions than wood-based bioenergy demand.

Thinning

Increasing impact. The increase of bioenergy demand has increased the demand for small-diameter hardwood, which in turn has increased thinnings in previously unmanaged forest stands. This will increase the availability of good quality sawlogs and will also accelerate the carbon sequestration (tonnes/ha/year) of the forests. However, the total forest carbon stock (tonnes/ha) will be reduced; in unmanaged (e.g. no thinnings) mature stands, the carbon stock is larger than in managed stands of similar age. The carbon stock of a thinned stand will remain below that of an unthinned stand regardless of post-thinning accelerated growth.

Conversion from hardwood to softwood

Neutral. No indication of hardwood conversion to softwood was found.

Impacts of wood-based bioenergy demand to solid wood product (SWP) markets:

Diversion from other wood product markets

Neutral. Production of sawnwood, wood-based panels, pulp and paper products have increased or remained steady, i.e. no evidence of diversion.

Wood prices

Slight increasing impact. During 2017–2018, the price of all roundwood assortments increased notably. The increase was strongest in pulpwood assortments, especially those that are not further processed domestically but are exported to mainly Finland and Sweden. Finnish demand for pulpwood was at a very high level in 2018. This was a temporary trend, however, and prices and demand have since decreased. The price increase for fuelwood was less dramatic, no sharp increases are observed. According to interviews, pellet production was the most important driver of fuelwood prices.

Read the full report: Catchment Area Analysis in Estonia. A 2017 interview with Raul Kirjanen, CEO of Graanul Invest, a wood pellet supplier of Drax operating in Estonia, can be read here. Read how Drax and Graanul work with NGOs when concerns are raised within our supply chain here.

Read more about how bioenergy has no negative impact on Estonia’s forest resources here.

This is part of a series of catchment area analyses around the forest biomass pellet plants supplying Drax Power Station with renewable fuel. Others in the series include: Georgia Mill, Latvia, Chesapeake and Drax’s own, other three mills LaSalle BionergyMorehouse Bioenergy and Amite Bioenergy.

Morehouse catchment area analysis

Working forest in southern Arkansas within the Morehouse catchment area

The forest area around the Drax Morehouse BioEnergy plant has a long history of active management for timber production. 96% of the forest owners are private and around half of these are corporate investors seeking a financial return from forest management. The pulp and paper (p&p) sector dominates the market for low grade roundwood with over 75% of the total demand. The wood pellet markets use only 6% of the roundwood, of which 4% is used by Morehouse.

Given the small scale of demand in the pellet sector, the extent of influence is limited. However, the new pellet markets have had a positive impact, replacing some of the declining demand in the p&p sector and providing a market for thinnings for some forest owners and a new off-take for sawmill residues.

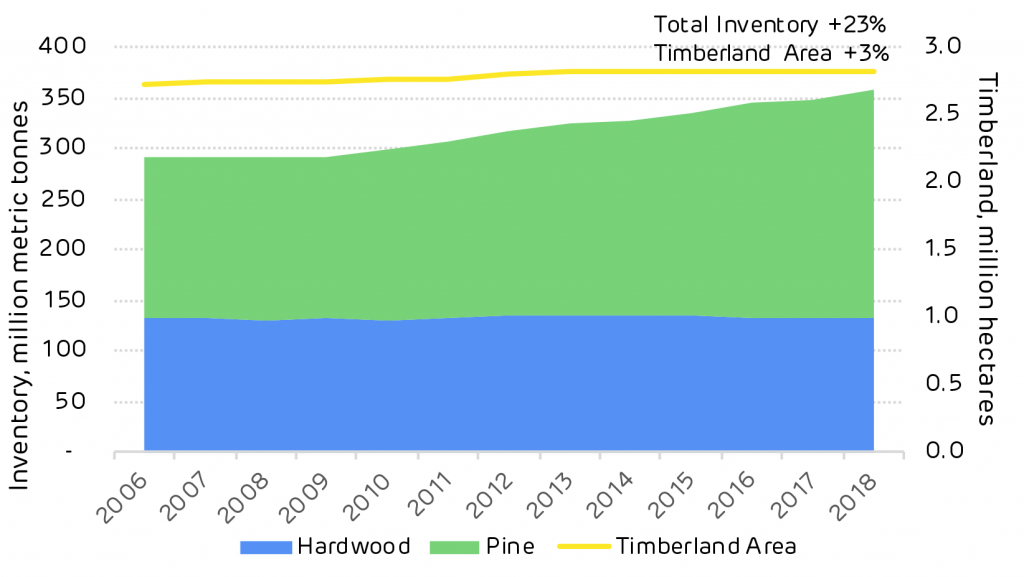
Pine forest is dominant in this area with an increasing inventory (growing stock) despite a stable forest area. Active management of pine forests has increased the amount of timber stored in the standing trees by 68 million tonnes from 2006 to 2018.  Over the same period the hardwood inventory remained static.

Chart showing historic inventory and timberland area in Morehouse catchment

Historic inventory and timberland area in Morehouse catchment; click to view/download.

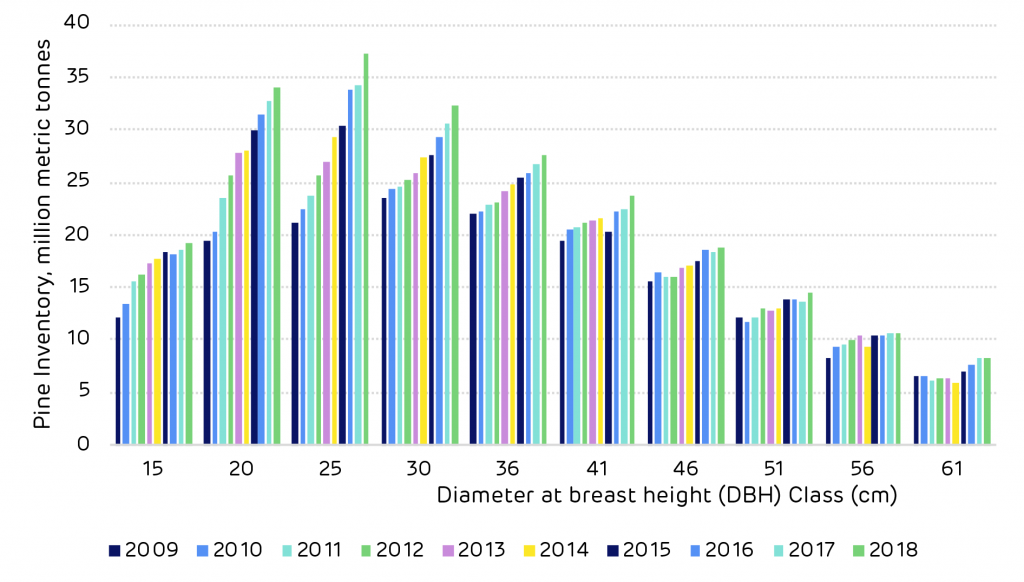
US Forest Service FIA data shows that the pine resource in this catchment area has been maturing, the volume of timber has been increasing in each size class year on year. This means that the volume available for harvesting is increasing and that more markets will be required to utilise this surplus volume and ensure that the long-term future of the forest area can be maintained.

Chart showing historic pine inventory by DBH Class

Historic pine inventory by DBH Class in Morehouse catchment; click to view/download.

This is reflected in the growth drain ratio – the comparison of annual growth versus harvesting. A ratio of one shows a forest area in balance, less than one shows that harvesting is greater than growth. This can be the case when the forest area is predominantly mature and at the age when clear cutting is necessary.

A growth drain ratio of more than one shows that growth exceeds harvesting, this is typically the case in younger forests that are not yet ready for harvesting and are in the peak growing phase, but it can also occur when insufficient market demand exists and owners are forced to retain stands for longer in the absence of a viable market.

Drax Morehouse plant

Drax’s Morehouse BioEnergy compressed wood pellet plant in northern Louisiana

This can have a negative impact on the future growth of the forest; limiting the financial return to forest owners and reducing the cumulative sequestration of carbon by enforcing sub-optimal rotation lengths.

The current growth drain ratio of pine around Morehouse is 1.67 with an average annual surplus of around 7 million metric tonnes. This surplus of growth is partly due to a decline in saw-timber demand due to the global financial crisis but also due to the maturing age class of the forest resource and the increasing quantity of timber available for harvesting.

Historic growth and removals of pine in Morehouse catchment (million metric tonnes)

YearGrowthRemovalsNet GrowthGrowth-to-Drain
200914.112960762411.1860124622.92694830041.26166145535
201014.580331100610.91819493463.662136166021.33541589869
201115.129903273610.72162297824.408280295451.41115792865
201215.357258404710.30755904395.049699360811.48990254039
201315.63898206189.701617808065.93736425371.61199733603
201415.91041518229.376564771556.533850410651.69682773701
201515.94235364499.669133266476.273220378431.64878828387
201616.43527840789.579357241816.855921165961.71569740985
201716.838075354610.1594737396.678601615681.65737672908
201817.770968348910.65938820047.111580148561.66716588371

The chart below shows the decline in pine saw-timber demand in the catchment area following the financial crisis in 2008. It also shows the recent increase in pulpwood demand driven by the new pellet mill markets that have supplemented the declining p&p mills.

Sawmills are a vital component of the forest industry around Morehouse, with most private owners seeking to maximise revenue through saw-timber production from pine forests.

As detailed in the table below, there are 70 markets for higher value timber products around this catchment area. These mills also need an off-taker for their residues and the pellet mills can provide a valuable market for this material, increasing the viability of the saw-timber market.

Operating grade-using facilities near Morehouse timber market

TypeNumber of MillsCapacityCapacity UnitsHardwood Roundwood At Mill From MarketSoftwood Roundwood At Mill From Market
Consumption, million green metric tonnes
Lumber6810538.8235294M m³1.737194320550.88604623042613.06745552335.69986977638
Plywood/Veneer2904M m³000.9617438725360.506109617373
Total701.737194320550.88604623042614.02919939586.20597939376

Pulp and paper mills dominate the low grade roundwood market for both hardwood and softwood. The pellet mill market is small with just 3 mills and therefore does not influence forest management decisions or macro trends in the catchment area. However, demand for wood pellet feedstock exceeds 1.5 million tonnes p.a. and this can provide a valuable market for thinnings and sawmill residues. A healthy forest landscape requires a combination of diverse markets co-existing to utilise the full range of forest products.

Operating pulpwood-using facilities near Morehouse timber market

TypeNumber of MillsCapacityCapacity UnitsHardwood Roundwood At Mill From MarketSoftwood Roundwood At Mill From Market
Consumption, million green metric tons
Pulp/Paper117634.86896M metric tons3.489826926741.192570970097.557287050371.66598821268
OSB/Panel62412.55M m³002.567325398621.19890681942
Chips178395.08999M metric tons2.938909722111.46484421365.287607151192.18745126814
Pellets31573.965975M metric tons002.078219858451.01128896402
Total346.428736648862.6574151836917.49043945866.06363526426

In its analysis, Forisk Consulting considered the impact that the new pellet mills including Morehouse BioEnergy have had on the significant trends in the local forest industry. The tables below summarise the Forisk view on the key issues. In its opinion, the Morehouse plant has had no negative impact.

Bioenergy impacts on markets and forest supplies in the Morehouse market

ActivityIs there evidence that bioenergy demand has caused the following?Explanation
DeforestationNo
Change in forest management practiceNo
Diversion from other marketsPossiblyBioenergy plants compete with pulp/paper and OSB mills for pulpwood and residual feedstocks. There is no evidence that these facilities reduced production as a result of bioenergy markets, however.
Increase in wood priceNoThere is no evidence that bioenergy demand increased stumpage prices in the market.
Reduction in growing stocking timberNo
Reduction in sequestration of carbon / growth rateNo
Increasing harvesting above the sustainable yieldNo

Bioenergy impacts on forests markets in the Morehouse market

Forest metric Bioenergy impact
Growing Stock Neutral
Growth Rates Neutral
Forest Area Neutral
Wood Prices Neutral
Markets for Solid Wood Neutral to Positive*
*Access to viable residual markets benefits users of solid wood (i.e. lumber producers).

Read the full report: Morehouse, Louisiana Catchment Area Analysis. An interview with the co-author, Amanda Hamsley Lang, COO and partner at Forisk Consulting, can be read here. Explore every delivery of wood to Morehouse BioEnergy using our ForestScope data transparency tool.

This is part of a series of catchment area analyses around the forest biomass pellet plants supplying Drax Power Station with renewable fuel. Others in the series include: ,

Others in the series include: Georgia MillEstonia, Latvia, Chesapeake and Drax’s own, other three mills LaSalle BionergyMorehouse Bioenergy and Amite Bioenergy.

Heating the future

We all want our homes and our workplaces to be warm and cosy, but not at the cost of catastrophic climate change. That’s why decarbonising our heating is a challenge that simply cannot be ignored.

Making decisions about how this is done requires careful consideration and a detailed, deliverable national strategy.

Here we discuss the key issues in decarbonising heat.

The numbers

The Climate Change Act commits the UK to reducing its carbon emissions by at least 80 per cent of their 1990 levels by 2050.

As heating our homes and workplaces is responsible for almost one fifth of our country’s total carbon emissions, we are clearly going to need to make huge changes to the way we keep our homes and workplaces warm in order to meet those commitments.

‘Over 80% of energy used in homes is for heating – suggesting large potential for continued decarbonisation.’

— Energising Britain: Progress, impacts and outlook for transforming Britain’s energy system, by I. Staffell, M. Jansen, A. Chase, C. Lewis and E. Cotton, 2018.

Improved insulation, greater energy efficiency and electrification will all reduce the need for fossil fuel-based heating. However, domestic energy efficiency in the UK is lagging well behind targets, although the situation varies from region to region – and such targets do not even exist yet for the non-domestic sector.

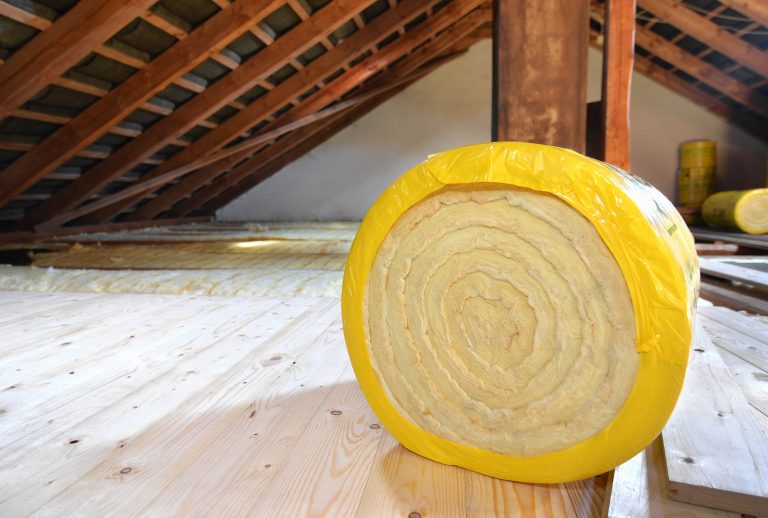
Roof insulation material

Even in a low or zero-carbon future, we’re still going to need to keep our homes and workplaces warm – and affordably.

Future policy

Against this backdrop, in March 2018, the UK Government issued a call for evidence for a Future Framework for Heat in Buildings.

Chancellor Phillip Hammond introduced a new ‘future homes standard’ in his 2019 Spring Budget Statement, “mandating the end of fossil fuel heating systems.” Gas boilers will be banned from all new homes from 2025.

A major change is coming. But what else will we need to change in order to transform our heating systems?

1. More electrification

The most noticeable change in the way we heat our homes and workspaces in the future may well come from the need to switch from systems that fuelled by natural gas to ones that are driven by electricity.

Some technologies that can offer a solution to the challenge of decarbonising heating depend on a significant amount of electricity to keep the warmth flowing.

For instance, the hybrid heat pump scenario which is currently supported by the Committee on Climate Change would see up to 85% of a consumer’s need for heat being met by low-carbon electricity.

To give some context to that figure, according to the Committee, 85 per cent of the UK’s homes now rely on fossil-fuel derived natural gas for heating and hot water, and on average these: “currently emit around 2tCO2 per household per year… which represents around one tenth of the average UK household’s carbon footprint.”

Changing from a situation where our heating depends on 85% fossil fuel gas to one that depends on 85% low or zero carbon electricity is little short of a complete transformation. Given that the new future homes standard is due to be introduced in less than six years, this transformation will need to happen quickly.

Of course, a great deal of the extra electricity needed will come from intermittent renewables such as wind turbines and solar panels – especially as the cost of renewable electricity is falling.

Much of that power looks likely to be supplied by distributed sources rather than those integrated into the national grid. Indeed, since 2011, power generation capacity connected directly to the distribution network grew from 12 gigawatts (GW) to more than 40 GW by the end of 2017, according to estimates from energy experts Cornwall Insight in a report for our B2B energy supply business, Haven Power.

With so much of our electricity reliant on the weather, there will still be a need for dispatchable and flexible thermal sources and energy storage, such as Drax and Cruachan power stations. Their centralised power generation can be turned up and fed directly into the national transmission system at short notice, to keep our heating running and our homes warm.

Dam and reservoir, Cruachan Power Station, Scotland

Such a transformation will obviously require careful strategic planning as well as an enormous amount of investment.

There may well be no single solution to the challenge of heat decarbonisation, rather a number of different solutions that depend on where people live and work, their individual circumstances, the energy efficiency of their homes and the resources they have close at hand.

But while it has previously been reported that the overall or system costs of electrifying heating could be as much as three times the cost of using gas, another study suggests that the costs could be much closer.

2. More heat pumps

Heat pumps that absorb environmental warmth and use it to provide low carbon heating have always been considered a possible option for the four million homes and countless workplaces that are not currently connected to the UK’s mains gas network.

Recently expert opinion has been changing with hybrid heat pumps seen as a workable solution even for homes and workplaces that are connected to gas supplies. Indeed, in 2018 the Committee on Climate Change stated that hybrid heat pumps: “can be the lowest cost option where homes are sufficiently insulated, or can be insulated affordably.” This means that they may be one of the simplest and most affordable options to provide the heating of the future.

Hybrid heat pumps draw heat from the air or ground around them and use a boiler to provide extra heat when the weather is exceptionally cold. In a low carbon future, that boiler could be fuelled by biogas. In a zero carbon situation, it could be powered by hydrogen.

Heat pumps can be air-source (ASHP) – absorbing warmth from the atmosphere like the heat exchanger in your fridge in reverse – or ground source (GSHP). GSHPs absorb heat through on a network of pipes (a ground loop) buried or a vertical borehole drilled in the earth outside your home or workplace.

Both ASHPs and GSHPs can be used to support underfloor heating or a radiator system, though neither will provide water heated to the high temperature a natural gas boiler will reach to keep radiators hot.

And even though the warmth they absorb is free, heat pumps depend on a supply of electricity to condense it and to bring it back to the heating system inside the house.

This electricity could be generated by distributed power from local solar PV, wind turbines, drawn from batteries or even from the low carbon grid of the future.

It is worth noting that the size of heat pumps and the amount of land they require – especially GSHP – makes them a less attractive solution for people who live or work in built up areas such as cities. While for those who live in blocks of flats, it is difficult to see how individual heat pumps could be a practical solution.

3. More hydrogen

The idea of switching the mains gas grid to store and transport hydrogen has long appealed as a potential solution to the challenge of decarbonising heating. Renewable hydrogen could then be burnt in domestic boilers similar to those we currently use for natural gas.

The benefits are many. Hydrogen produces no carbon emissions when burnt, and can be stored and transported in much the same way as natural gas (provided old metal pipes have been replaced with modern alternatives).

And given the sunk costs involved in the existing gas grid and in the network of pipes and radiators already installed in tens of millions of homes, hydrogen has always been expected to be the lowest cost option too.

However, according to the Committee on Climate Change’s latest findings, hydrogen should not be seen as a ‘silver bullet’ solution, capable of transforming our entire heating landscape in a single change.

The main reasons they give for this judgment are the relatively high cost of the electricity required to produce sufficient hydrogen to power tens of millions of boilers, the undesirability of relying on substantial imports of hydrogen, and the lack of a carbon-free method to supply the gas cost-effectively at scale.

Hydrogen could, however, be produced by gas reformation of the emissions retained by bioenergy carbon capture and storage (BECCS) such as that being pioneered at Drax Power Station. Carbon capture use and storage (CCUS), of which BECCS is the renewable variant, is supported by the UK government through its Clean Growth Strategy as it has potential to accelerate decarbonisation in power and industrial sectors.

Extremely rapid progress to provide hydrogen in sufficient quantities from BECCS is unlikely – but the first schemes could begin operating in the late 2020s.

Hydrogen production also has the potential to radically transform the economics of CCUS, making it a much more attractive investment.

It was originally assumed that the power required to drive the energy-intensive process of hydrogen created via electrolysis would come from surplus electricity generated by intermittent renewables at times of low demand. However, that surplus is not now generally regarded as likely to be sufficiently large to be relied upon. 

It is these limitations, together with a comprehensive model of the likely costs involved in different approaches to decarbonisation, that led the Committee on Climate Change to suggest that hybrid heat pumps could provide the bulk of domestic heating in the future.

At present, it seems likely that converting to hydrogen-fuelled boilers will mainly be an attractive option for those who live and work near areas where the renewable fuel can be most easily created and stored. The north of England is a prime example – close to the energy and carbon intensive areas of the Humber and Tees valleys where CCUS and hydrogen clusters could be located with good access to North Sea carbon stores such as aquifers and former gas fields.

4. More solar

Many homes in the UK – especially in the south – could be heated electrically without carbon emissions at the point of use.

Solar thermal (for water heating) or solar PVs (for electric and water heating) common sights on domestic property rooftops. The intermittency of solar power need not be an issue as the electricity generated could then be stored in batteries ‘behind the meter’ until it is needed.

However, the lack of sufficient daylight for much of the year in many parts of the UK could, together with the still relatively high cost of battery storage, still mean that this would not necessarily be a solution that can be applied at scale to millions of homes and workplaces all year round.

As the cost of battery storage continues to fall, it may well be that solar becomes a more practical and cost-effective solution.

5. More biomass

More geothermal

Sustainably sourced compressed wood pellets and biomass boilers have long been proposed as a potential solution to decarbonising heating for the many people who live and work off the mains gas grid. Bioenergy as a whole – including biogas as well as wood pellets – now provides around four percent of UK heat, up from 1.4% in 2008.

The main barriers to this are the current relatively high cost of biomass boilers. This is currently offset by the Renewable Heating Incentive (RHI) which the UK government has committed to continuing until 2021.

As this solution is adopted by more consumers, it is anticipated that the real costs of such new technology will fall as economies of scale start to take effect in much the same way that solar PV and battery technology has recently become more affordable.

6. More geothermal

Ruins of a tin mine, Wheal Coates Mine, St. Agnes, Cornwall, England

Geothermal energy uses the heat stored beneath the surface of our planet itself to provide the energy we need.

While in some countries such as Iceland, geothermal energy is used to drive turbines to generate electricity that is then used to provide power for heating, it is envisaged that in the UK it could be converted into warmth through massive heat pumps that provide heating to entire communities – especially those in former mining areas. There is already one geothermal district heating scheme in operation in the UK, in Southampton.

It is envisaged that such geothermal schemes would work most effectively at a district level, providing zero carbon heat to many homes and workplaces. According to a recent report, geothermal energy has the potential to “produce up to 20 per cent of UK electricity and heat for millions.”

At present, drilling is being carried out to see if geothermal heating could be viable in Cornwall. However, there is no reason why it could not be used in disused coalmines too where ground source heat pumps (GSHPs) would absorb and condense the required heat. This means that geothermal could have strong potential as a solution to the challenge of decarbonisation for former mining communities.

7. More CHP

By using the heat created in thermal renewable electricity generation – such as biomass – in combined heat and power schemes, businesses and individuals can reduce their energy costs and their carbon emissions. Such schemes can work well for new developments on a district basis, and are already popular in mainland Europe, especially Sweden, Denmark and Switzerland.

Warm homes, factories and offices

There are already a number of viable solutions to decarbonising heating in the UK. They rely on smart policy, smarter technology and customers taking control of their energy.

Rather than any one of these technologies providing a single solution that can help every consumer and business in the country to meet the challenge in the same way, it is more likely that it will be met by a number of different solutions, depending on geography, cost and individual circumstances. These will sometimes also work in concert rather than alone.

The UK has made solid progress on reducing carbon emissions – especially in power generation. When it comes to heating buildings, rapid decarbonisation is now needed. And that decarbonisation must avoid fuel poverty and help to rebalance the economy.

Find out more about energy in buildings in Energising Britain: Progress, impacts and outlook for transforming Britain’s energy system.