Tag: wood pellets

Results of General Meeting

RNS Number : 1936U
Drax Group plc
(“Drax” or the “Group”; Symbol:DRX)

Drax is pleased to announce the results of its General Meeting held today, Wednesday 31 March 2021.

No.ResolutionVotes For%Votes Against%Votes Total (not including withheld)Votes Withheld
1.To approve the acquisition of the entire issued share capital of Pinnacle Renewable Energy Inc.318,727,66499.99%20,7440.01%318,748,40895,895

The resolution was passed.

Completion of the acquisition is expected to occur in April 2021, subject to the satisfaction or waiver of the final outstanding conditions.

The number of shares in issue is 411,732,605 (of which 13,841,295 are held in treasury. Treasury shares don’t carry voting rights).

Votes withheld are not a vote in law and have not been counted in the calculation of the votes for and against the resolution, the total votes validly cast or the calculation of the proportion of issued share capital voted.

A copy of the resolution is available for inspection in the Circular, which was previously submitted to the Financial Conduct Authority’s National Storage Mechanism at https://data.fca.org.uk/#/nsm/nationalstoragemechanism.

The Circular and the voting results are also available on the Company’s website at www.drax.com.

Capitalised terms used but not defined in this announcement have the meanings given to them in the Circular.

Enquiries:

Drax Investor Relations: Mark Strafford

+44 (0) 7730 763 949

Media:

Drax External Communications: Ali Lewis

+44 (0) 7712 670 888

At the heart of the energy transition

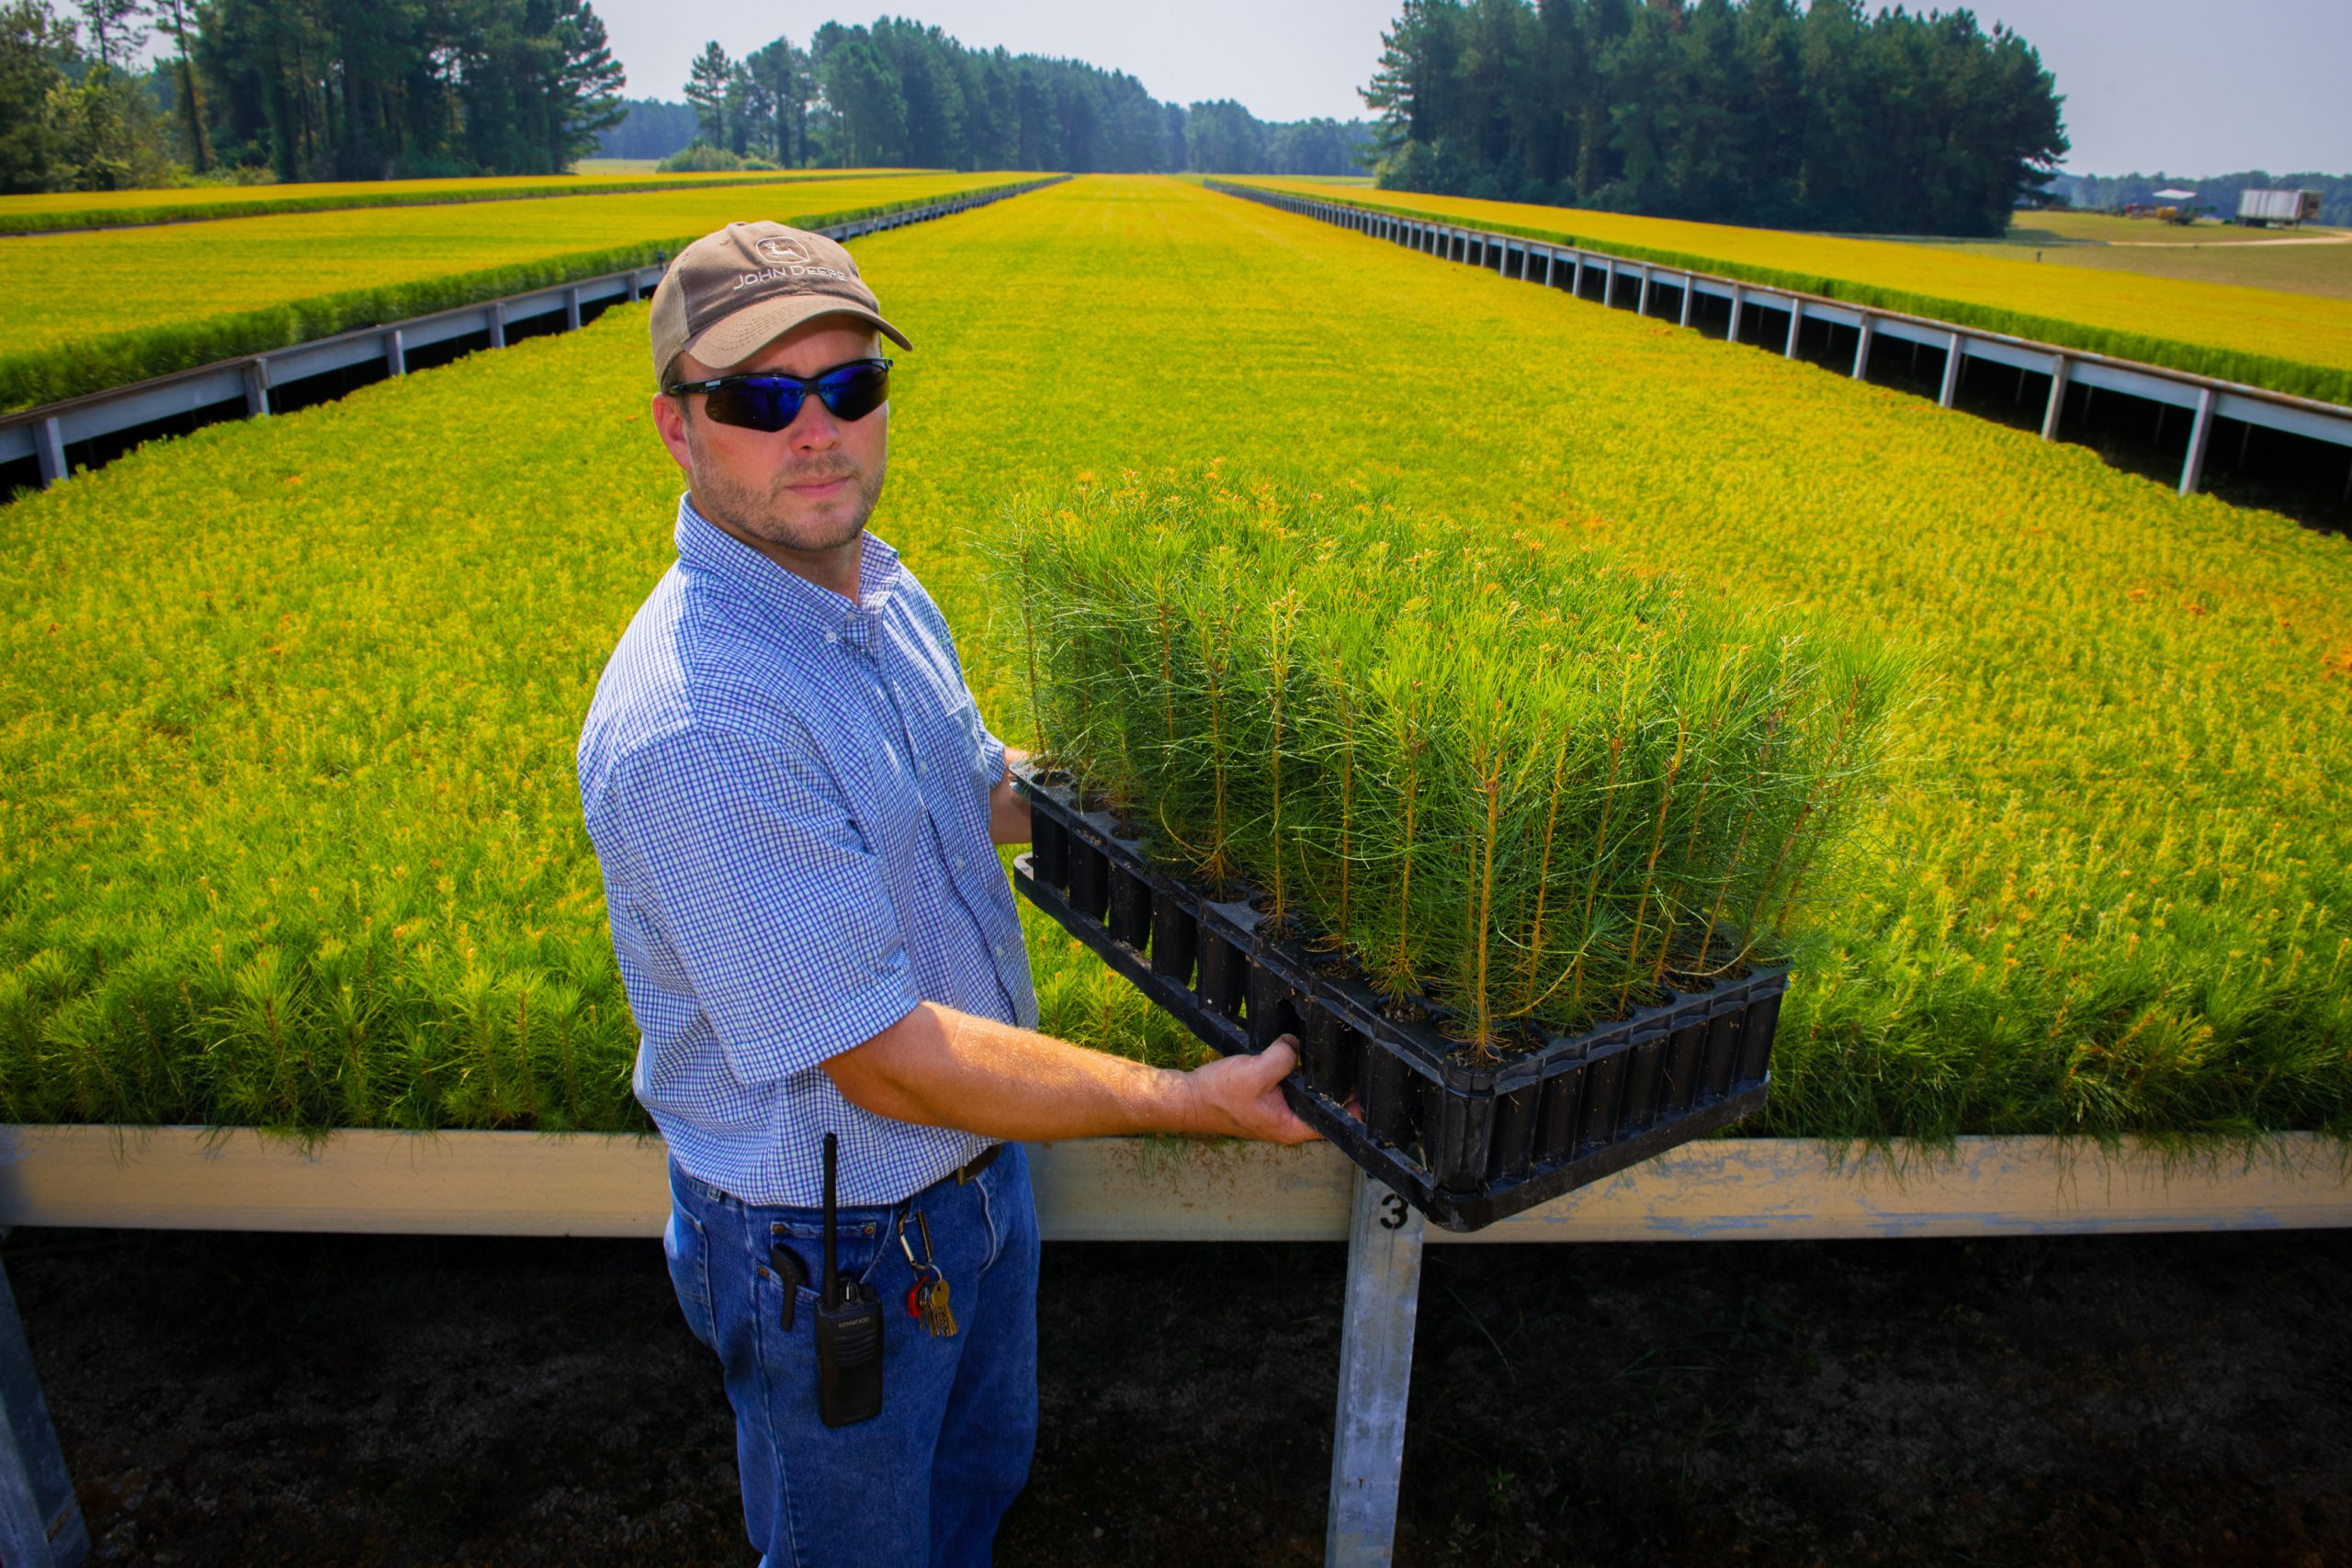
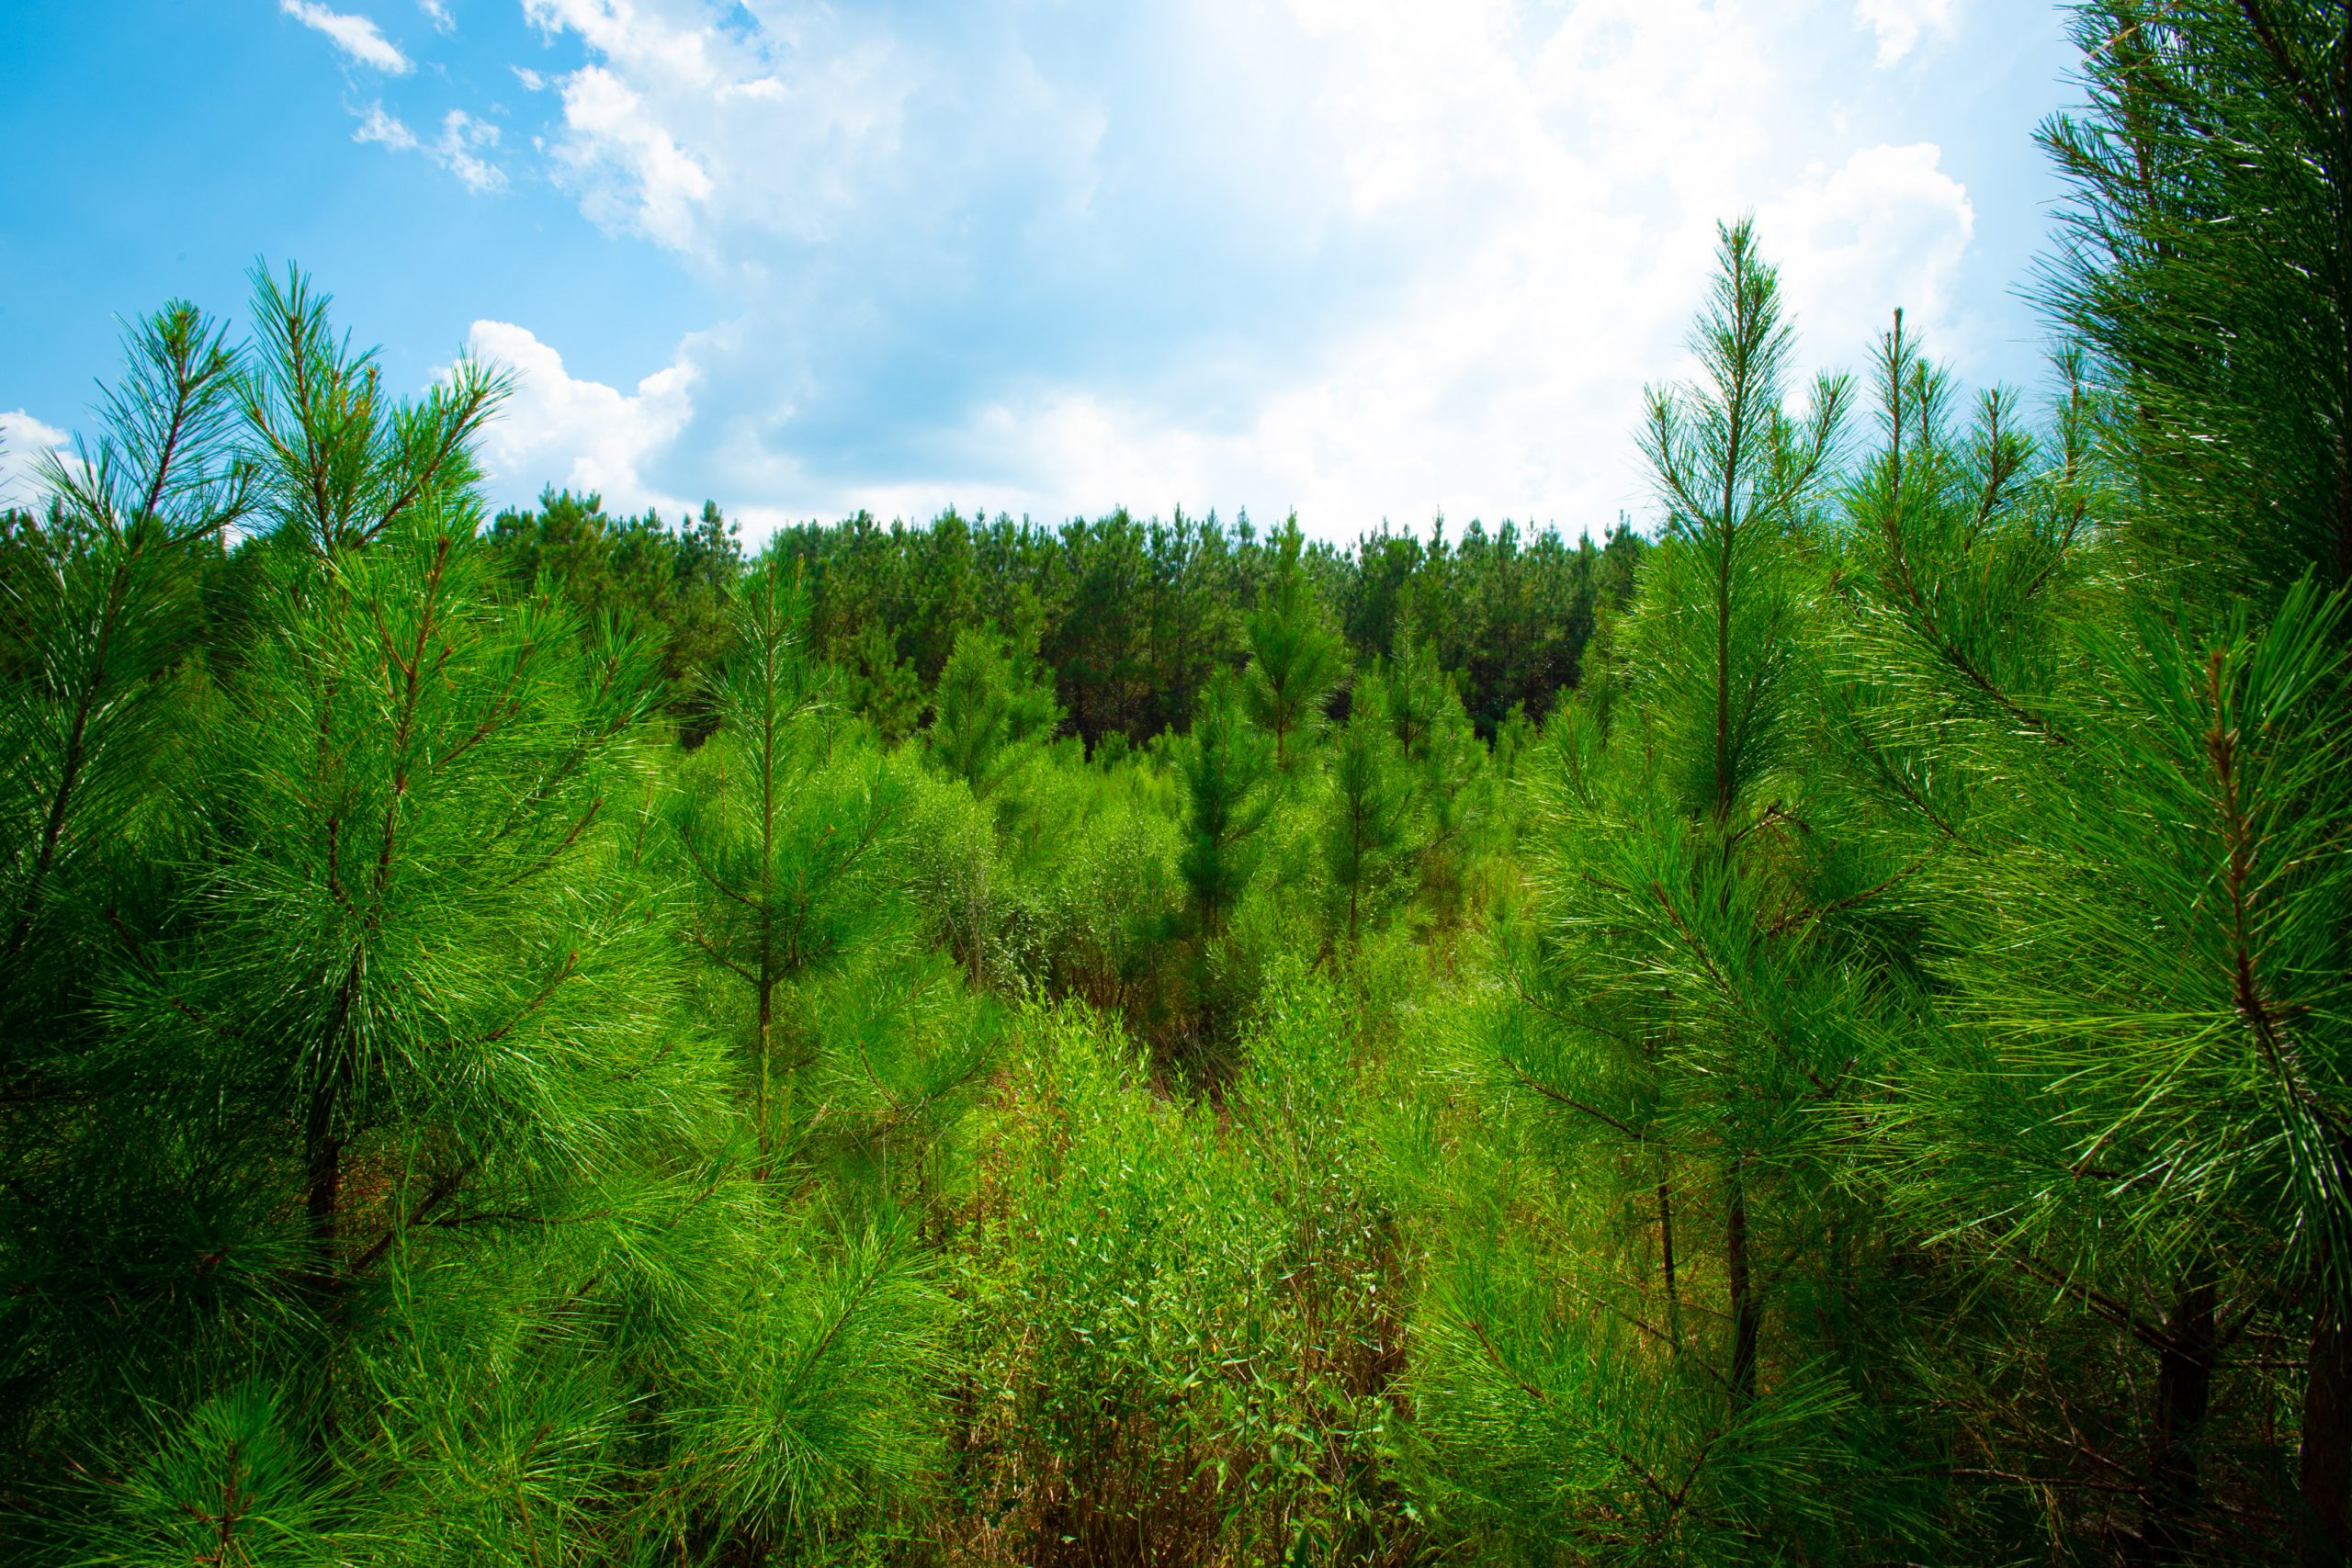
Tree nursery in Mississippi

Will Gardiner opened the second day of the Chatham House Energy Transitions conference. Watch his keynote address below or scroll down the page to read his speech in full.

The energy transition is central to our purpose of enabling a zero carbon, lower cost energy future.

Drax has been at the heart of Britain’s energy system for decades. And we have played a key role in the decarbonisation of the power sector: Drax Power Station in Selby, North Yorkshire, is the UK’s largest power station and Europe’s largest decarbonisation project. Cruachan, our Scottish Pumped Storage facility is a key complement to Britain’s ever increasing supply of offshore wind.

Our transition from coal to biomass has allowed us to reduce our greenhouse gas emissions by over 80% while providing clean and flexible energy to millions of homes and businesses across the UK. This month saw the end of commercial coal generation at Drax power station – a milestone in the history of our company and of the UK economy, too.

But the scale of the climate crisis means that we cannot stop here.

Which is why we have committed to a world-leading ambition to be carbon negative by 2030.

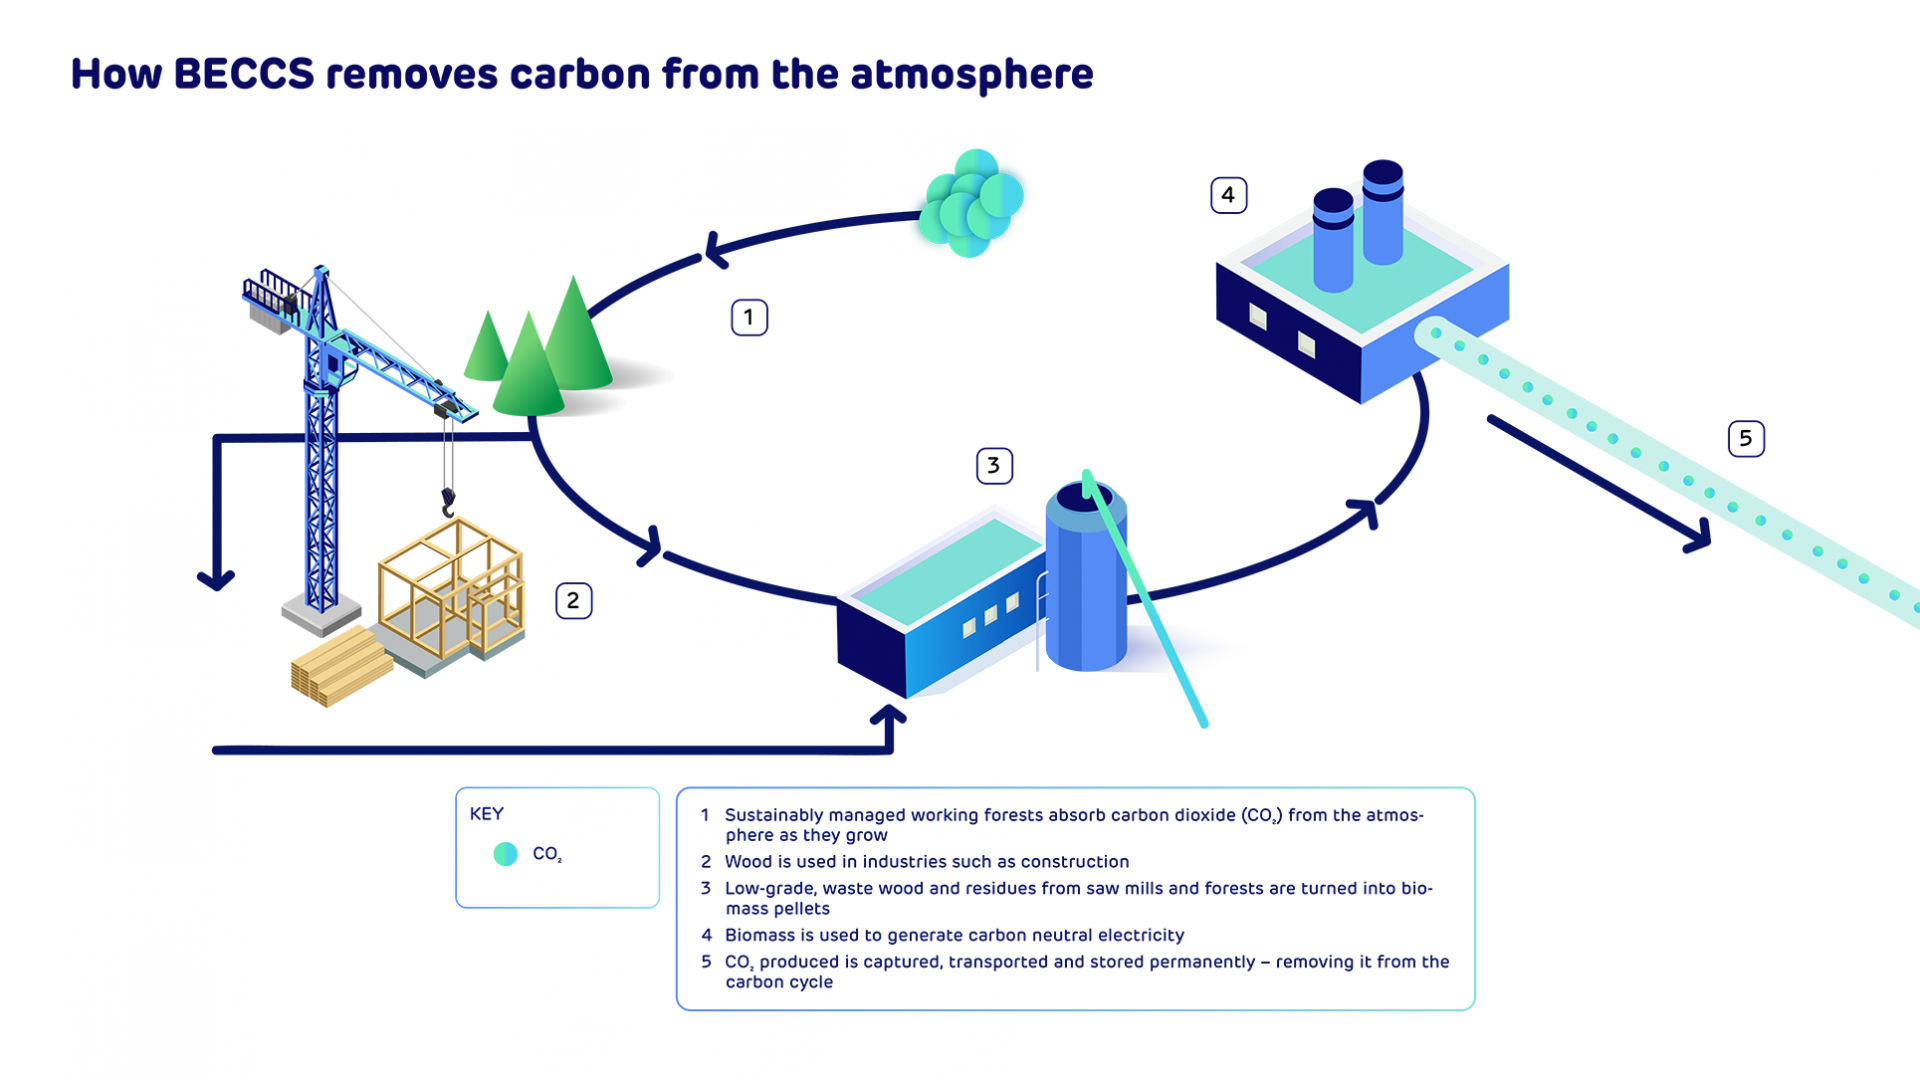
We will achieve this by making a transformational investment in bioenergy with CCS, or BECCS, which will enable us to permanently remove carbon emissions from the atmosphere while continuing to supply the renewable electricity that millions of British homes and businesses depend upon.

Water outlet into Loch Awe from Cruachan Power Station

Water outlet into Loch Awe from Cruachan Power Station

Today, we are pioneering BECCS at Drax Power Station as part of the Zero Carbon Humber Cluster, a coalition of diverse businesses with one ambition: to create the world’s first net zero emissions industrial cluster.

The benefits are enormous

BECCS is a vital technology in the fight against climate change. Expert bodies such as the Climate Change Committee here in the UK and the IPCC at a global level are clear that we need negative emissions technologies including BECCS to reach net zero, and BECCS is central to the UK and Europe’s decarbonisation plans.

As the world’s largest, and most experienced, generator and supplier of sustainable bioenergy there is no better place to pioneer BECCS than at Drax. The economic, social and environmental benefits are enormous.

BECCS at Drax will permanently remove millions of tonnes of carbon from the atmosphere and help heavy industry in the UK’s largest emitting area decarbonise quickly and cost effectively;

It will enable the creation of tens of thousands of green jobs in the North of England, levelling up the economy and delivering a green recovery from the Covid crisis;

And it will put the UK at the forefront of global efforts to develop carbon removal technology in this, the year that we host COP26 in Glasgow.

The scale of the climate crisis means that we cannot stop here.

A proven technology

We know that BECCS works and that the technology is available now. Looking at cost projections from the CCC, we also know that it is the best value negative emissions technology.

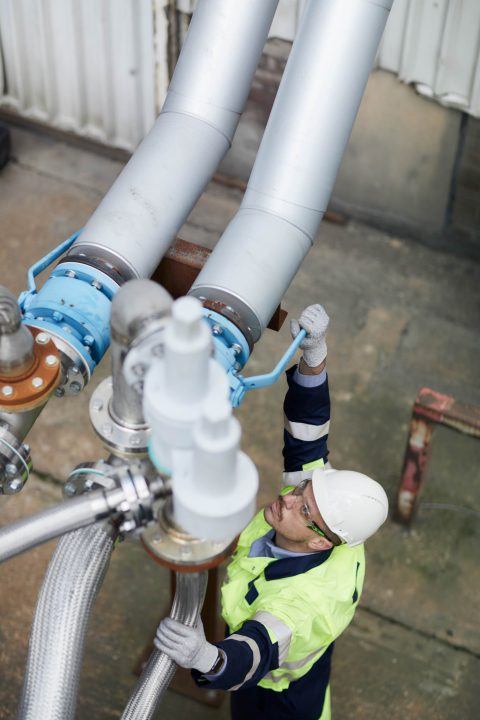
Engineer at BECCS pilot project within Drax Power Station

Engineer at BECCS pilot project within Drax Power Station

We have already successfully run two BECCS pilots at the power station. In 2019 we demonstrated that we can capture CO2 from a 100% biomass feedstock. And in 2020, we began a second pilot working with Mitsubishi Heavy Industries to further enhance the potential for delivering negative emissions.

We aim to deploy BECCS at scale by 2027. To that end, earlier this month, we kickstarted the planning process for our proposals to build our first BECCS units, marking a major milestone in the project and putting us in a position to commence building BECCS as soon as 2024.

The support we need

Drax Power Station has a proud history of transformation. And today we are making rapid progress in further decarbonising our operations and making bold commitments about our future.

The core of our successful decarbonisation has been a close partnership with government. And it is this partnership that will make BECCS a reality and enable the multiple benefits that come with it. An effective negative emissions policy and regulatory framework from government will enable further investments from companies such as Drax.

We believe it is possible for such a policy framework to emerge in the coming months.

With COP26 later this year, making that policy commitment will allow us to accelerate our own decarbonisation journey and support the industries of the future here in the UK.

BECCS in context

But we know that there is no silver bullet solution to tackling climate change.

Negative emissions technologies such as BECCS will be needed alongside others, for example more renewables, electric vehicles, energy storage, energy efficiency and hydrogen.

BECCS will enable us to permanently remove carbon emissions from the atmosphere while continuing to supply the renewable electricity that millions of British homes and businesses depend upon.

BECCS complements – and does not – and should not – substitute for ambitious decarbonisation plans. Technologies such as BECCS have a clear and unique role to play by helping harder to abate sectors such as heavy industry, aviation and agriculture – decarbonise.

This is critically important if we are to meet our legally binding 2050 net zero target. The CCC estimates that 51m tonnes of CO2 will need to be captured via BECCS to meet net zero.

Sustainability at our core

We know that BECCS can only make a meaningful contribution to tackling climate change if the bioenergy is sustainably sourced. This has been fundamental to Drax’s transition from coal to biomass, and it remains fundamental as we progress our plans for BECCS.

Infographic showing how BECCS removes carbon from the atmosphere

Biomass, as the UK Government has stated, is one of our most valuable tools for reaching net zero emissions. So we need the right framework to ensure it is sourced sustainably.

As the world’s largest bioenergy producer and generator, we recognise our responsibility to be the world leaders in sustainability, too.

At Drax, we have invested in world leading policies, tools and expertise to ensure that our biomass is sustainably sourced. We go beyond regulatory compliance and have set up an Independent Advisory Board, Chaired by the UK Government’s former Chief Scientific Advisor, to help us and challenge us on sustainable biomass and its role in Drax’s transition to net zero.

front cover of 'Responsible sourcing' PDF

[click to read]

Thanks to our independent catchment area analyses, we know more about the forests we source from than ever before. We know and can demonstrate how demand for biomass can support healthy forests. For example, in the South East US where Drax sources most of its biomass, there is more than double the carbon stored in forests than there was 50 years ago.

A partnership with our stakeholders

The purpose of today’s session is to discuss all these issues and more. Our aim is clear: to enable a successful energy transition.

At Drax we stand ready to invest hundreds of millions of pounds to scale up BECCS technology;

To put the UK at the forefront of global efforts to reach net zero emissions;

And to help create tens of thousands of green jobs in the North of England.

But I want your help in making BECCS as sustainable and successful as it can be.

We know and can demonstrate how demand for biomass can support healthy forests.

Thank you very much for listening and I wish you a good and constructive session tackling this critical global challenge.

Will Gardiner delivered this keynote address at Energy Transitions 2021.

The video of Will’s speech can be watched in full here and with subtitles here.

The science behind measuring and analysing trees

Weyerhaeuser working forest in Amite catchment area

We have published independent Catchment Area Analysis (CAA) reports for around 68% of the total biomass wood pellet supply to Drax Power Station in 2019. Within that, 73% of the pellets were manufactured in the US South accounting for 49% of that year’s total supply quantity.

A key component of CAA analysis are measurements, data and calculations provided by the National Forest Inventory (NFI). Bespoke wood price data, mill production capacity, market trends and interviews with local experts complete the picture.

The NFI in each country or region can be quite different in its intensity and frequency of measurement and overall degree of accuracy. In this article we examine the Forest Inventory and Analysis (FIA) database produced by the US Department of Agriculture Forest Service (USDA FS).

FIA traces its origin back to the McSweeney – McNary Forest Research Act of 1928 and began the first inventory in 1930. Since that time, it has been in continuous operation with a stated mission to: make and keep current a comprehensive inventory and analysis of the present and prospective conditions of and requirements for the renewable resources of the forest and rangelands of the US.

The fundamental science behind measuring tree height and diameter to calculate growth and volume has not changed much over the decades. A girth tape is used to measure the diameter at breast height (DBH), which is a point on the tree stem 1.37m above the base of the tree or the root collar (the exact height can vary by country). The height of a standing tree is conventionally measured using a clinometer or hypsometer, which measures the angle from the top of the tree to a measured distance away from the base. This forms a triangle from which the tree height can be calculated.

Example of girth and height measurement in the US South

The combination of height and girth are then used to estimate total tree volume based on historical models for that particular species in that country or region. Many decades worth of data measurements and modelling have been used to develop complex equations to estimate volume for each species and circumstance. This calculation process needs to estimate the rate of taper of the stem, or the difference in diameter between the base and the top of the tree. This can be consistent within a single species, but it can depend on growth rates and planting density (for example closely stocked trees may grow taller and thinner but more openly planted trees tend to be shorter and wider). Whether the site has been thinned, how many times, and at what age, can impact the degree of taper in the stem. Through many years of research, measuring and modelling the Southern Research Station (SRS) FIA team has developed the following formula for under-bark volume calculation:

under-bark volume calculation

This is then modified according to the parameters shown below, depending on species and stem characteristics.

Example of volume

Example of volume

Once the volume has been calculated, the basic density (solid wood per cubic metre) and moisture content can be used to calculate wet and dry weight, fibre content and yield.

A comprehensive record of data

The US Forest Service has built up an extensive historical record of data points through years of physical measurements – from both sampling and cutting down individual sample trees to determine the actual dimensions and statistics to compare against the estimated values. Over time, forest scientists are able to build up reasonably accurate tables for each tree species that can be used to estimate growth and volume based on the DBH and estimated tree height.

In the UK we have a forester’s handbook known as The Blue Book which contains a vast quantity of modelled data to help a forester calculate volume and growth in a range of different forest types across the country. This data has been collected and modelled by the Forestry Commission’s Forest Research branch. In the US they have a similar system of data collection and modelling but on a bigger scale, given the much larger forest area and greater variety in tree species and site type.

How can you measure an entire forest?

The forestland area of the US South covers more than 100 million hectares (ha) in total which can present quite a challenge to measure, survey and accurately predict forest growth and health. The FIA does this through a network of sample plots randomly but sequentially distributed across the forestland in each State with undisclosed locations so as to avoid biased management. Field crews collect data on forest type, site attributes, tree species, tree size, and overall tree condition on accessible forest land.

Recently, the programme has involved a five-year rolling measurement system where 20% of the plots are measured in each State, on an annual basis. At the end of a five-year period all plots will have been measured and the process begins again. This process is overseen by a robust quality assurance system to maintain and ensure the quality and accuracy of the fieldwork.

Plots are distributed at a rate of 1 plot per 6,000 acres of land (or one per 2,400 ha). This degree of plot distribution is at an extremely course scale if attempting to understand the growth of an individual stand or forest area. For example, The Blue Book recommends using 8-12 plots (and top height measurements) for a relatively uniform stand of around 10 ha. This degree of accuracy would be required to calculate the volume of standing wood for sale. In comparison, the FIA data would be completely inaccurate if trying to monitor growth and trends at an individual forest level or even at county level. This sampling intensity and the scale of measurement are the most critical factors in assessing the validity of data and trends that are identified through the FIA and through the CAA analysis.

Quantifying the level of accuracy

The physical measurement procedure and volume modelling are well established processes with data and analysis collected over many decades to support the findings; this leads to a clearly quantifiable degree of error for each measured plot. The challenge comes when using plot data to estimate the values in the surrounding forest. At this scale, the level of accuracy will depend on the ratio of plots to total forest area and the total number of plots measured. The ratio of plots per ha in the US South is pre-determined, limited by the physical and financial constraints of actually measuring trees on the ground. However, the total number of plots used to evaluate trends can vary according to how large an area is assessed.

Fundamentally, if a single county is assessed then the total number of sample plots will be low and the potential for error will be high. If an entire State is assessed, then the number of plots is much larger (despite the same ratio of plots per ha) therefore the data and the trend is statistically much more accurate. Drax’s CAA analysis falls somewhere in between these two points, with each catchment area including multiple counties but not quite at the same scale as State level analysis. An example of the variation in error is shown in the table below.

Degree of error for key metrics in Drax’s CAA analysis

Degree of error for key metrics in Drax’s CAA analysis

The data showing total inventory (volume of wood growing in the forest) has been assessed for the Chesapeake catchment area in North Carolina and Virginia. When looking at each individual county, the data error calculation is +/- 46.5%, therefore not very accurate. If looking at State level, the data error is only +/- 2.7%. This degree of error is much more accurate and demonstrates more credible and reliable data due to the much larger number of plots available across the entire State. The Drax CAA analysis for inventory in the Chesapeake area is +/- 4.7% which is reasonably close to the State level accuracy due to the large number of countries that are included in the CAA analysis.

Since the catchment area boundary is defined by the pellet mill’s historical and future sourcing pattern, this can vary in size according to each mill’s procurement strategy and local market conditions. For example, the Amite BioEnergy pellet plant sources from a much smaller area close to the mill and therefore the catchment area includes fewer counties. This can lead to a higher degree of error than in the other CAA reports as the total number of plots used is smaller.

A long history of measurement and analysis

Despite this, the overall degree of error is still in single figures and can be considered reasonable in each CAA report by the standards of forest measurement and modelling, an error of under 10% is generally considered acceptable. Measuring standing trees that are still growing is not an exact science – it is an estimation. Trees cannot be accurately weighed or measured until they are cut down. Therefore, there will always be degree of error in estimated data. In the US South, the long history of measurement, analysis and data modelling and the relatively homogenous nature of the main commercial species (southern yellow pine), mean that the error is relatively uniform and predictable if a large sample area is considered.

The potential for remote sensing data collection and analysis to replace traditional field measurement is an interesting and developing field. At an individual forest or stand level, it is possible to carry out intensive measurement with Laser or Lidar, to calculate volume and growth. However, there is currently no reliable, accurate and cost-effective way to do this at a large-scale across several million hectares. This may be a possibility as the technology and data interpretation tools continue to develop and Drax is working closely with remote sensing specialists to trial and develop this process. Until then, we can rely on boots on the ground and traditional fieldwork for an accurate view of the forest trends across our supply chain.

This blog supports a series of catchment area analyses around the forest biomass pellet plants supplying Drax Power Station with renewable fuel. Read more.


Publication of Circular and Notice of General Meeting in relation to proposed acquisition of Pinnacle Renewable Energy Inc.

RNS Number : 1426S
Drax Group PLC
(Symbol: DRX)

On 8 February 2021, Drax announced that it had entered into an agreement to purchase Pinnacle Renewable Energy Inc. (the “Acquisition”).

Drax is pleased to announce that a Circular in relation to the Acquisition (the “Circular”) has been published.

The Acquisition is subject to the approval of the shareholders of the Company and, accordingly, the Circular contains a notice convening a general meeting of the Company to be held at Opus Energy House, 8-10 The Lakes, Northampton NN4 7YD, UK at 4:30 pm on 31 March 2021. In light of COVID-19 restrictions and current prohibitions on public gatherings, attendance at the general meeting shall be restricted and therefore shareholders are strongly encouraged to vote electronically or to vote by proxy.

The Company will be accepting shareholders’ questions for the general meeting via the facility on the Company’s website at https://www.drax.com/investors/disclaimer-proposed-acquisition-of-pinnacle-renewable-energy-inc-by-drax. The deadline for submitting questions is 5:00pm on 19 March 2021. The Company will look to post answers to questions received on the Company’s website.

The Circular, which has been produced in accordance with the Listing Rules and approved by the Financial Conduct Authority, will shortly be available on the Company’s website at www.drax.com. In accordance with Listing Rule 9.6.1, a copy of the Circular has been submitted to the National Storage Mechanism and will be available shortly at https://data.fca.org.uk/#/nsm/nationalstoragemechanism. Printed copies of the Circular will be posted to shareholders who have elected to receive them.

Enquiries:

Drax Investor Relations: Mark Strafford

+44 (0) 7730 763 949

Media:

Drax External Communications: Ali Lewis

+44 (0) 7712 670 888

Royal Bank of Canada (Financial Adviser, Sponsor and Joint Corporate Broker):

+44 (0) 20 7653 4000

James Agnew Peter Buzzi Mark Rushton Evgeni Jordanov Jonathan Hardy Jack Wood

Important notice

The contents of this announcement have been prepared by and are the sole responsibility of Drax Group plc (the “Company”).

RBC Europe Limited (“RBC”), which is authorised by the Prudential Regulation Authority (the “PRA”) and regulated in the United Kingdom by the Financial Conduct Authority (“FCA”) and the PRA, is acting exclusively for the Company and for no one else in connection with the Acquisition, the content of this announcement and other matters described in this announcement and will not regard any other person as its clients in relation to the Acquisition, the content of this announcement and other matters described in this announcement and will not be responsible to anyone other than the Company for providing the protections afforded to its clients nor for providing advice to any other person in relation to the Acquisition, the content of this announcement or any other matters referred to in this announcement.

This announcement does not constitute or form part of any offer or invitation to sell or issue, or any solicitation of any offer to purchase or subscribe for, any shares in the Company or in any entity discussed herein, in any jurisdiction nor shall it or any part of it nor the fact of its distribution form the basis of, or be relied on in connection with, any contract commitment or investment decision in relation thereto nor does it constitute a recommendation regarding the securities of the Company or of any entity discussed herein.

RBC and its affiliates do not accept any responsibility or liability whatsoever and make no representations or warranties, express or implied, in relation to the contents of this announcement, including its accuracy, fairness, sufficient, completeness or verification or for any other statement made or purported to be made by it, or on its behalf, in connection with the Acquisition and nothing in this announcement is, or shall be relied upon as, a promise or representation in this respect, whether as to the past or the future. RBC and its respective affiliates accordingly disclaim to the fullest extent permitted by law all and any responsibility and liability whether arising in tort, contract or otherwise which it might otherwise be found to have in respect of this announcement or any such statement.

Each of the Company, RBC and their respective affiliates expressly disclaim any obligation or undertaking to supplement, amend, update, review or revise any of the forward looking statements made herein, except as required by law.

You are advised to read this announcement and the circular in their entirety for a further discussion of the factors that could affect the Company and its group and/or, following completion, the enlarged group’s future performance. In light of these risks, uncertainties and assumptions, the events described in the forward-looking statements in this announcement may not occur.

Neither the content of the Company’s website (or any other website) nor any website accessible by hyperlinks on the Company’s website (or any other website) is incorporated in, or forms part of, this announcement.

Proposed Acquisition of Pinnacle Renewable Energy Inc. – a major international supplier of sustainable biomass

This announcement contains inside information

RNS Number: 2805O
Drax Group PLC
(“Drax”, “the Group”, “Drax Group”, “the Company”; Symbol: DRX)

Drax is pleased to announce that it has signed an agreement (the “Acquisition Agreement”) with Pinnacle Renewable Energy Inc. (PL.TO) (“Pinnacle”), providing for the acquisition by Drax Canadian Holdings Inc., an indirect, wholly-owned subsidiary of Drax, of the entire issued share capital of Pinnacle (the “Acquisition”). The Acquisition will be implemented by way of a statutory plan of arrangement in accordance with the laws of the Province of British Columbia, Canada, at a price of C$11.30 per share (representing a premium of 13% based on the closing market price as at 5 February of C$10.04 per share and valuing the fully diluted equity of Pinnacle at C$385 million (£226 million(1)), with an implied enterprise value of C$741 million, including C$356 million of net debt(2)). The Acquisition, which remains subject to Drax and Pinnacle shareholder approval, court approval, regulatory approvals and the satisfaction of certain other customary conditions, has been unanimously recommended by the board of Pinnacle and has the full support of Pinnacle’s major shareholder, affiliates of ONCAP (which, together hold shares representing approximately 31% of Pinnacle’s shares as at 5 February 2021). Completion is expected to occur in the second or third quarter of 2021.

The Board believes that the Acquisition advances Drax’s biomass strategy by more than doubling its biomass production capacity, significantly reducing its cost of biomass production and adding a major biomass supply business underpinned by long-term contracts with high-quality Asian and European counterparties. The Acquisition positions Drax as the world’s leading sustainable biomass generation and supply business alongside the continued development of Drax’s ambition to be a carbon negative company by 2030, using Bioenergy Carbon Capture and Storage (BECCS).

Highlights

  • Compelling opportunity to advance Drax biomass strategy
    • Adds 2.9 million tonnes of biomass production capacity
    • Significantly reduces Drax average cost of production(3)
  • Increased global reach and presence in third-party markets
    • C$6.7 billion of contracted sales to counterparties in Asia and Europe
    • 99% of capacity contracted through to 2026, significant volumes contracted post 2027
  • Strong return on investment
    • Cash generative with 2022 EBITDA consensus of C$99 million
    • Expected returns significantly ahead of Drax’s WACC
    • Funded from cash and existing agreements
  • Reinforces sustainable and growing dividend

The world’s leading sustainable biomass generation and supply business

  • Drax and Pinnacle combined
    • 17 pellets plants, three major fibre baskets, four deep water ports
    • 4.9Mt capacity from 2022 – 2.9Mt available for self-supply
    • 2.6GW of renewable biomass generation, with potential for BECCS
  • Global growth opportunities for sustainable biomass

Commenting on today’s announcement Will Gardiner, Chief Executive Officer of Drax, said:

“I am excited about this deal which positions Drax as the world’s leading sustainable biomass generation and supply business, progressing our strategy to increase our self-supply, reduce our biomass production cost and create a long-term future for sustainable biomass.

Drax Group CEO Will Gardiner

Drax Group CEO Will Gardiner in the control room at Drax Power Station [Click to view/download]

“We expect to benefit greatly from Pinnacle’s operational and commercial expertise, and I am looking forward to what we can achieve together.

“It will pave the way for our plans to use Bioenergy with Carbon Capture and Storage (BECCS), and become a carbon negative company by 2030 – permanently removing millions of tonnes of carbon dioxide from the atmosphere each year. Negative emissions from BECCS are vital if we are to address the global climate emergency whilst also providing renewable electricity needed in a net zero economy, supporting jobs and clean growth in a post-COVID recovery.”

Duncan Davies, Chief Executive Officer of Pinnacle, said:

“Pinnacle’s Board of Directors has unanimously determined that the transaction represents the best course of action for the company and its shareholders. On closing, the transaction will deliver immediate, significant and certain cash value to our shareholders. At the same time, the combination of Pinnacle and Drax will create a global leader in sustainable biomass with the vision, technical expertise and financial strength to help meet the growing demand for renewable energy products, which is exciting for our employees, customers and others around the world.”

Drax’s sustainable biomass strategy

Sustainable biomass has an important role to play in global energy markets as a flexible and sustainable source of renewable energy, as well as having the potential to deliver negative emissions. Drax believes that the Acquisition accelerates the Group’s strategic objectives to increase its available self-supply of sustainable biomass to five million tonnes per annum (Drax currently operates 1.6 million tonnes of capacity with 0.4 million tonnes in development) and reduce the cost of biomass to £50/MWh(4) by 2027. Through the delivery of these strategic objectives Drax aims to create a long-term future for sustainable biomass, including third-party supply, BECCS and merchant biomass generation.

Employee at Morehouse BioEnergy in Louisiana

Employee at Morehouse BioEnergy in Louisiana

The Group’s enlarged supply chain will have access to 4.9 million tonnes of operational capacity from 2022. Of this total, 2.9 million tonnes are available for Drax’s self-supply requirements in 2022 (increasing to 3.4 million tonnes in 2027). Drax aims to increase the level of third-party sales and further expand its capacity to meet its target of five million tonnes of self-supply by 2027.

Drax believes that the Acquisition is highly complementary to the Group’s other long-term strategic options for biomass. Once optimised, the enlarged group’s biomass supply chain will support Drax’s own generation requirements, including the potential development of BECCS, whilst also serving the growing biomass markets in Europe and Asia via long-term off-take agreements.

A major producer and supplier of good-quality, low-cost sustainable biomass

Pinnacle, which is listed on the Toronto Stock Exchange, operates 2.5 million tonnes of biomass capacity at sites in Western Canada and the Southeastern US, with a further 0.4 million tonnes of capacity in development (commissioning in 2021). Investment in this new capacity is expected to be substantially complete in the first half of 2021. Once the new capacity is commissioned, Pinnacle’s nameplate production capacity is expected to increase to 2.9 million tonnes per annum.

Pinnacle has ownership of c.80% of this nameplate capacity, with the remaining c.20% co-owned with its forestry industry joint venture partners, ensuring strong commercial relationships and shared interests in security of supply. Pinnacle has sales and marketing rights to 100% of the output from all sites.

Pinnacle is a key supplier of wood pellets for Drax and other third parties in Asia and Europe, with C$6.7 billion of contracted third-party sales (including sales to Drax).
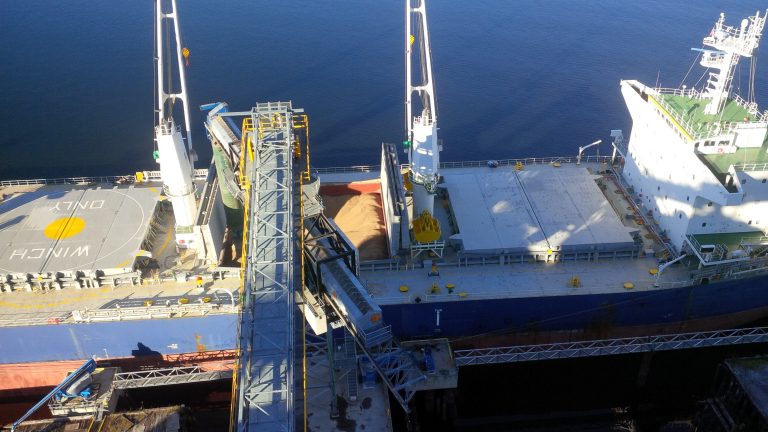
Westview terminal, Canada

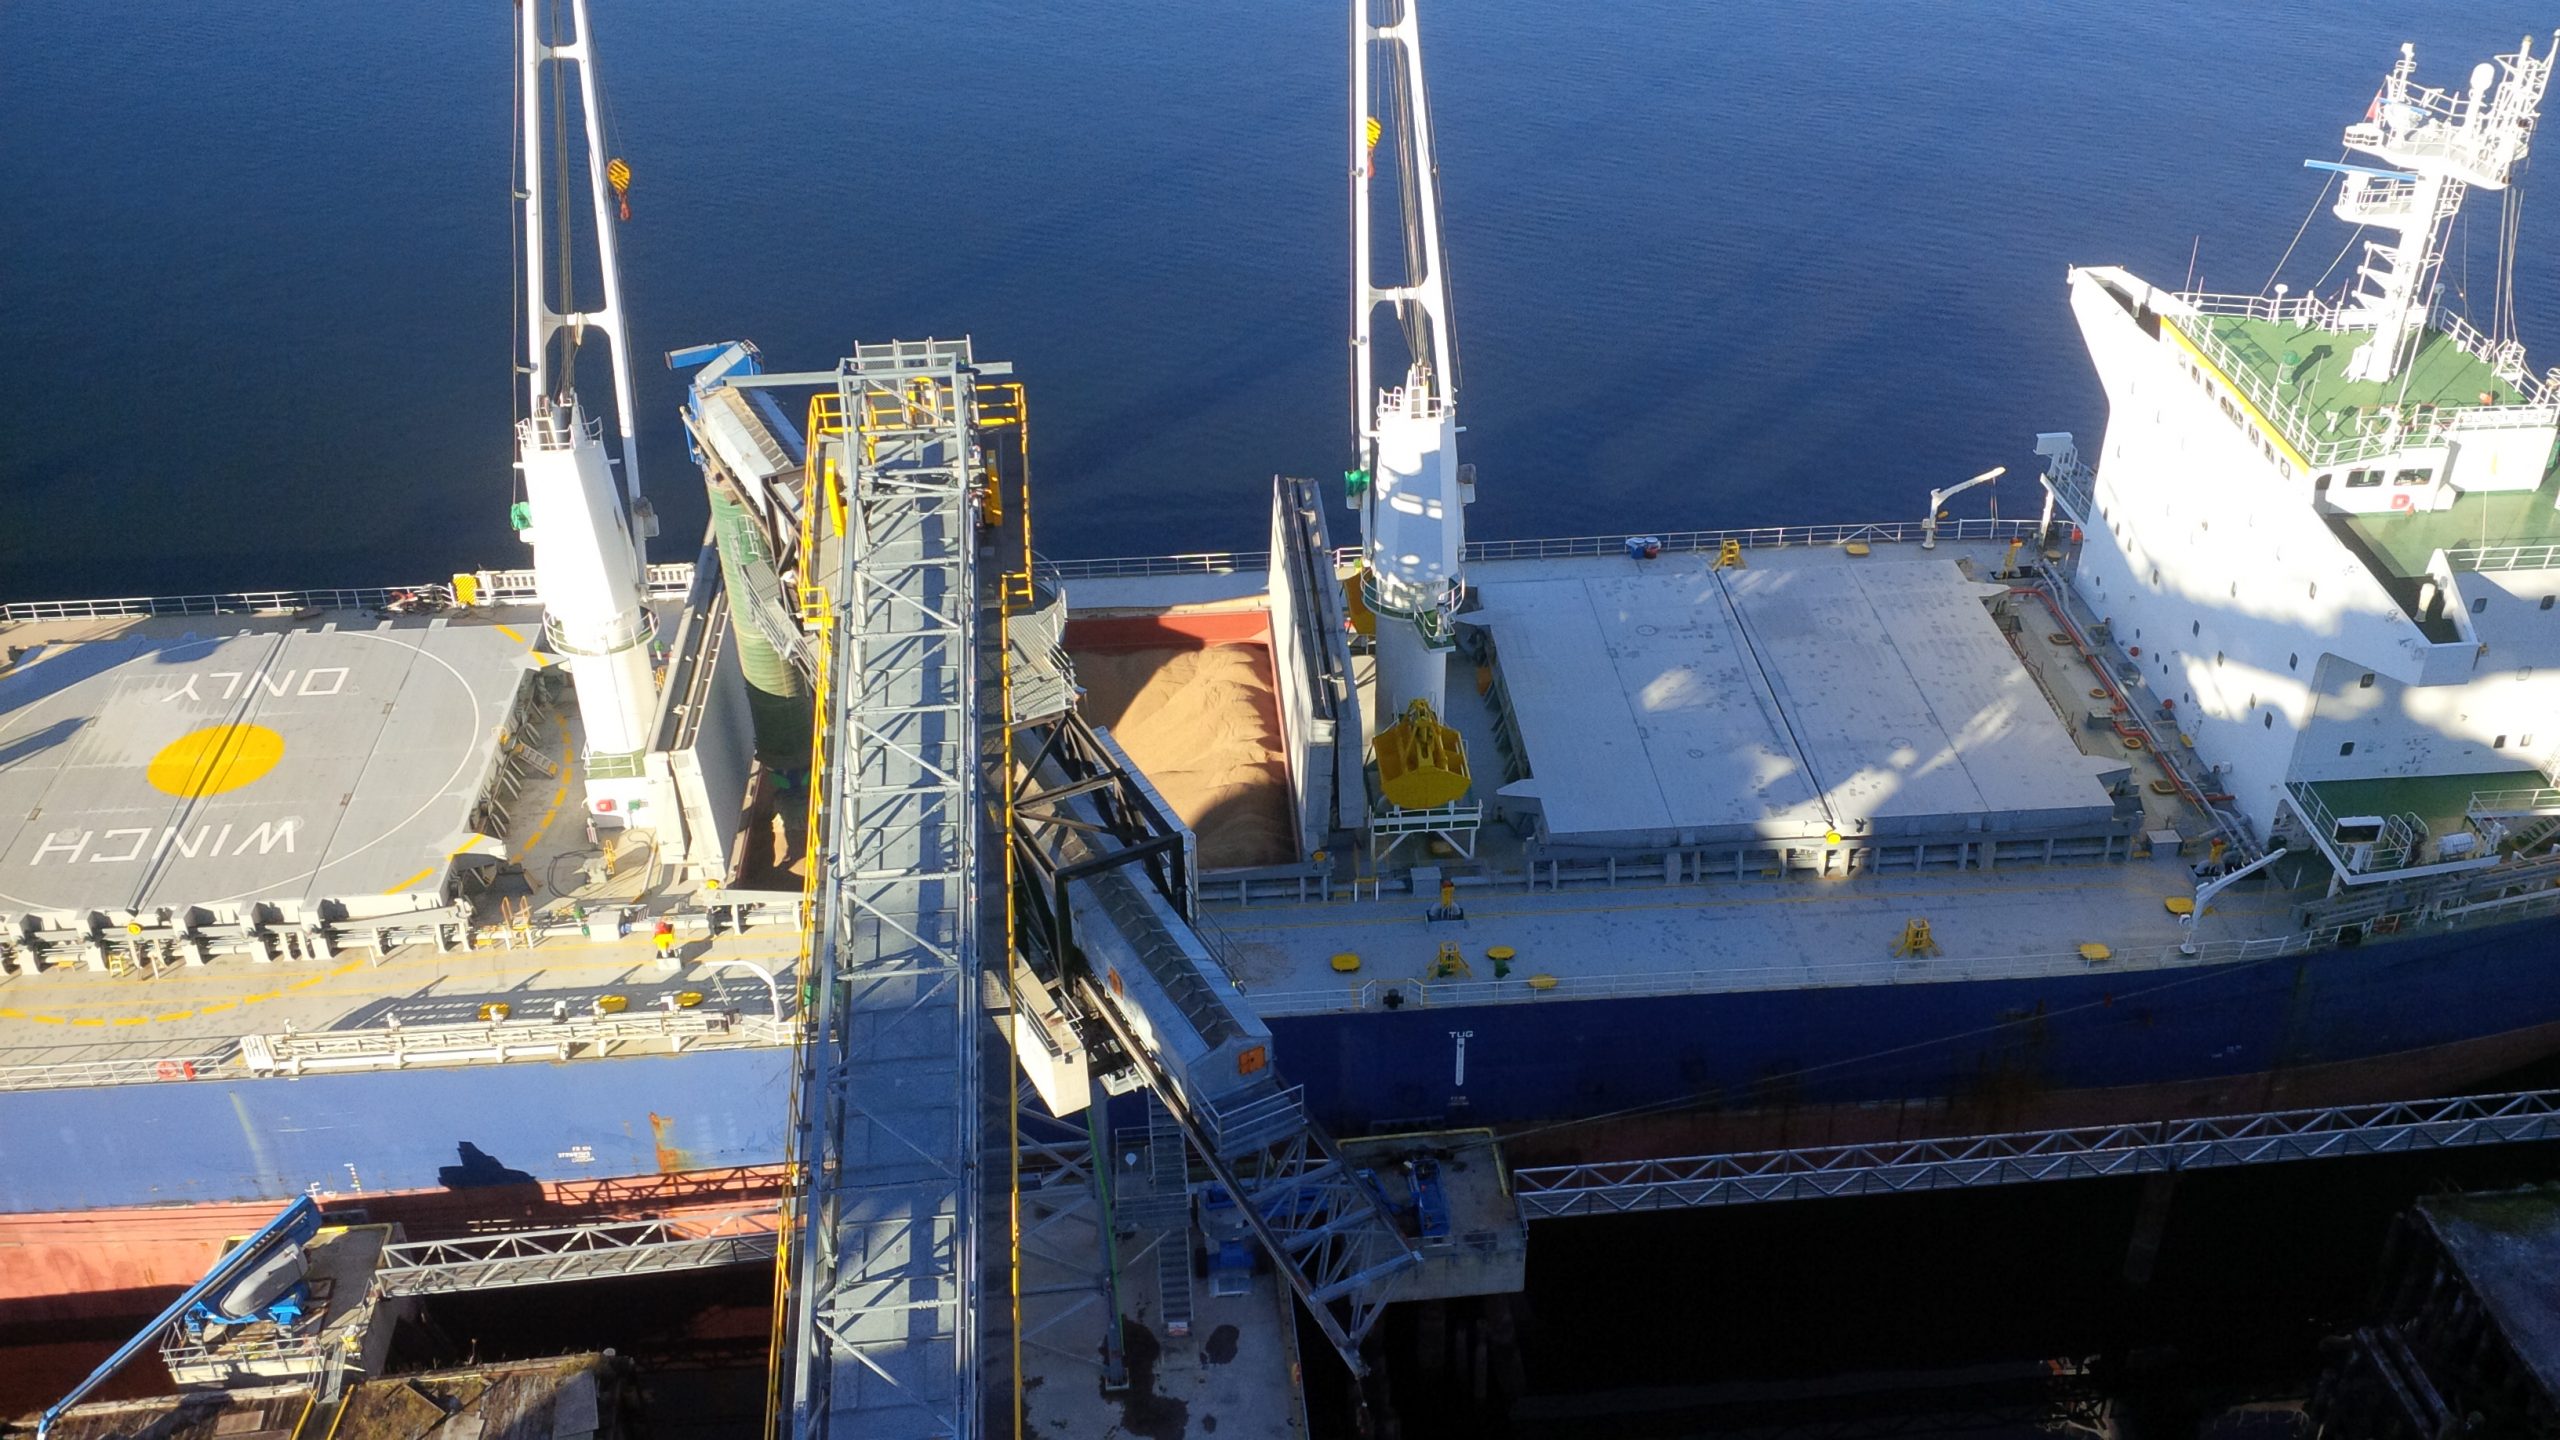
Wood pellets loaded onto vessel at Westview Terminal, British Columbia

Through scale, operational efficiency and low-cost fibre sourcing, Pinnacle is currently produces biomass at a lower cost than Drax, with a like-for-like 2019 production cost of US$124/tonne(3), compared to Drax’s 2019 production cost of US$161/tonne(3). The pro forma 2019 production cost for the combined business is US$141/tonne.

Pinnacle’s lower cost partially reflects the use of high levels of low-cost sawmill residues. British Columbia has a large and well-established commercial forestry industry, which has in recent years seen increased harvest levels, in part associated with management of a pine beetle infestation, producing good levels of residue material availability for the production of biomass. This infestation has now run its course and alongside other influences on the forest landscape, including wild-fire, is resulting in a reduction in the annual harvest and sawmill closures. The industry is adjusting to this with some production curtailment as well as developing approaches to fibre recovery and use which is expected to result in some increase in fibre costs.

Since 2017, the Sustainable Biomass Program has conducted annual audits of each of Pinnacle’s operational sites, allowing Drax to ensure, through its diligence, that the material that it purchases from Pinnacle is in line with its sustainability standards.

Drax is committed to ensuring best practice in health and safety, operational efficiency and sustainability across the enlarged group and intends to invest accordingly to deliver this outcome.

Drax is committed to ensuring that its biomass sources are compliant with Drax’s well-established responsible sourcing policy and Drax expects to invest in, adapt and develop sourcing practices to ensure compliance with Drax’s policies to deliver both Drax’s biomass strategy and positive forest outcomes.

A large and geographically diversified asset base

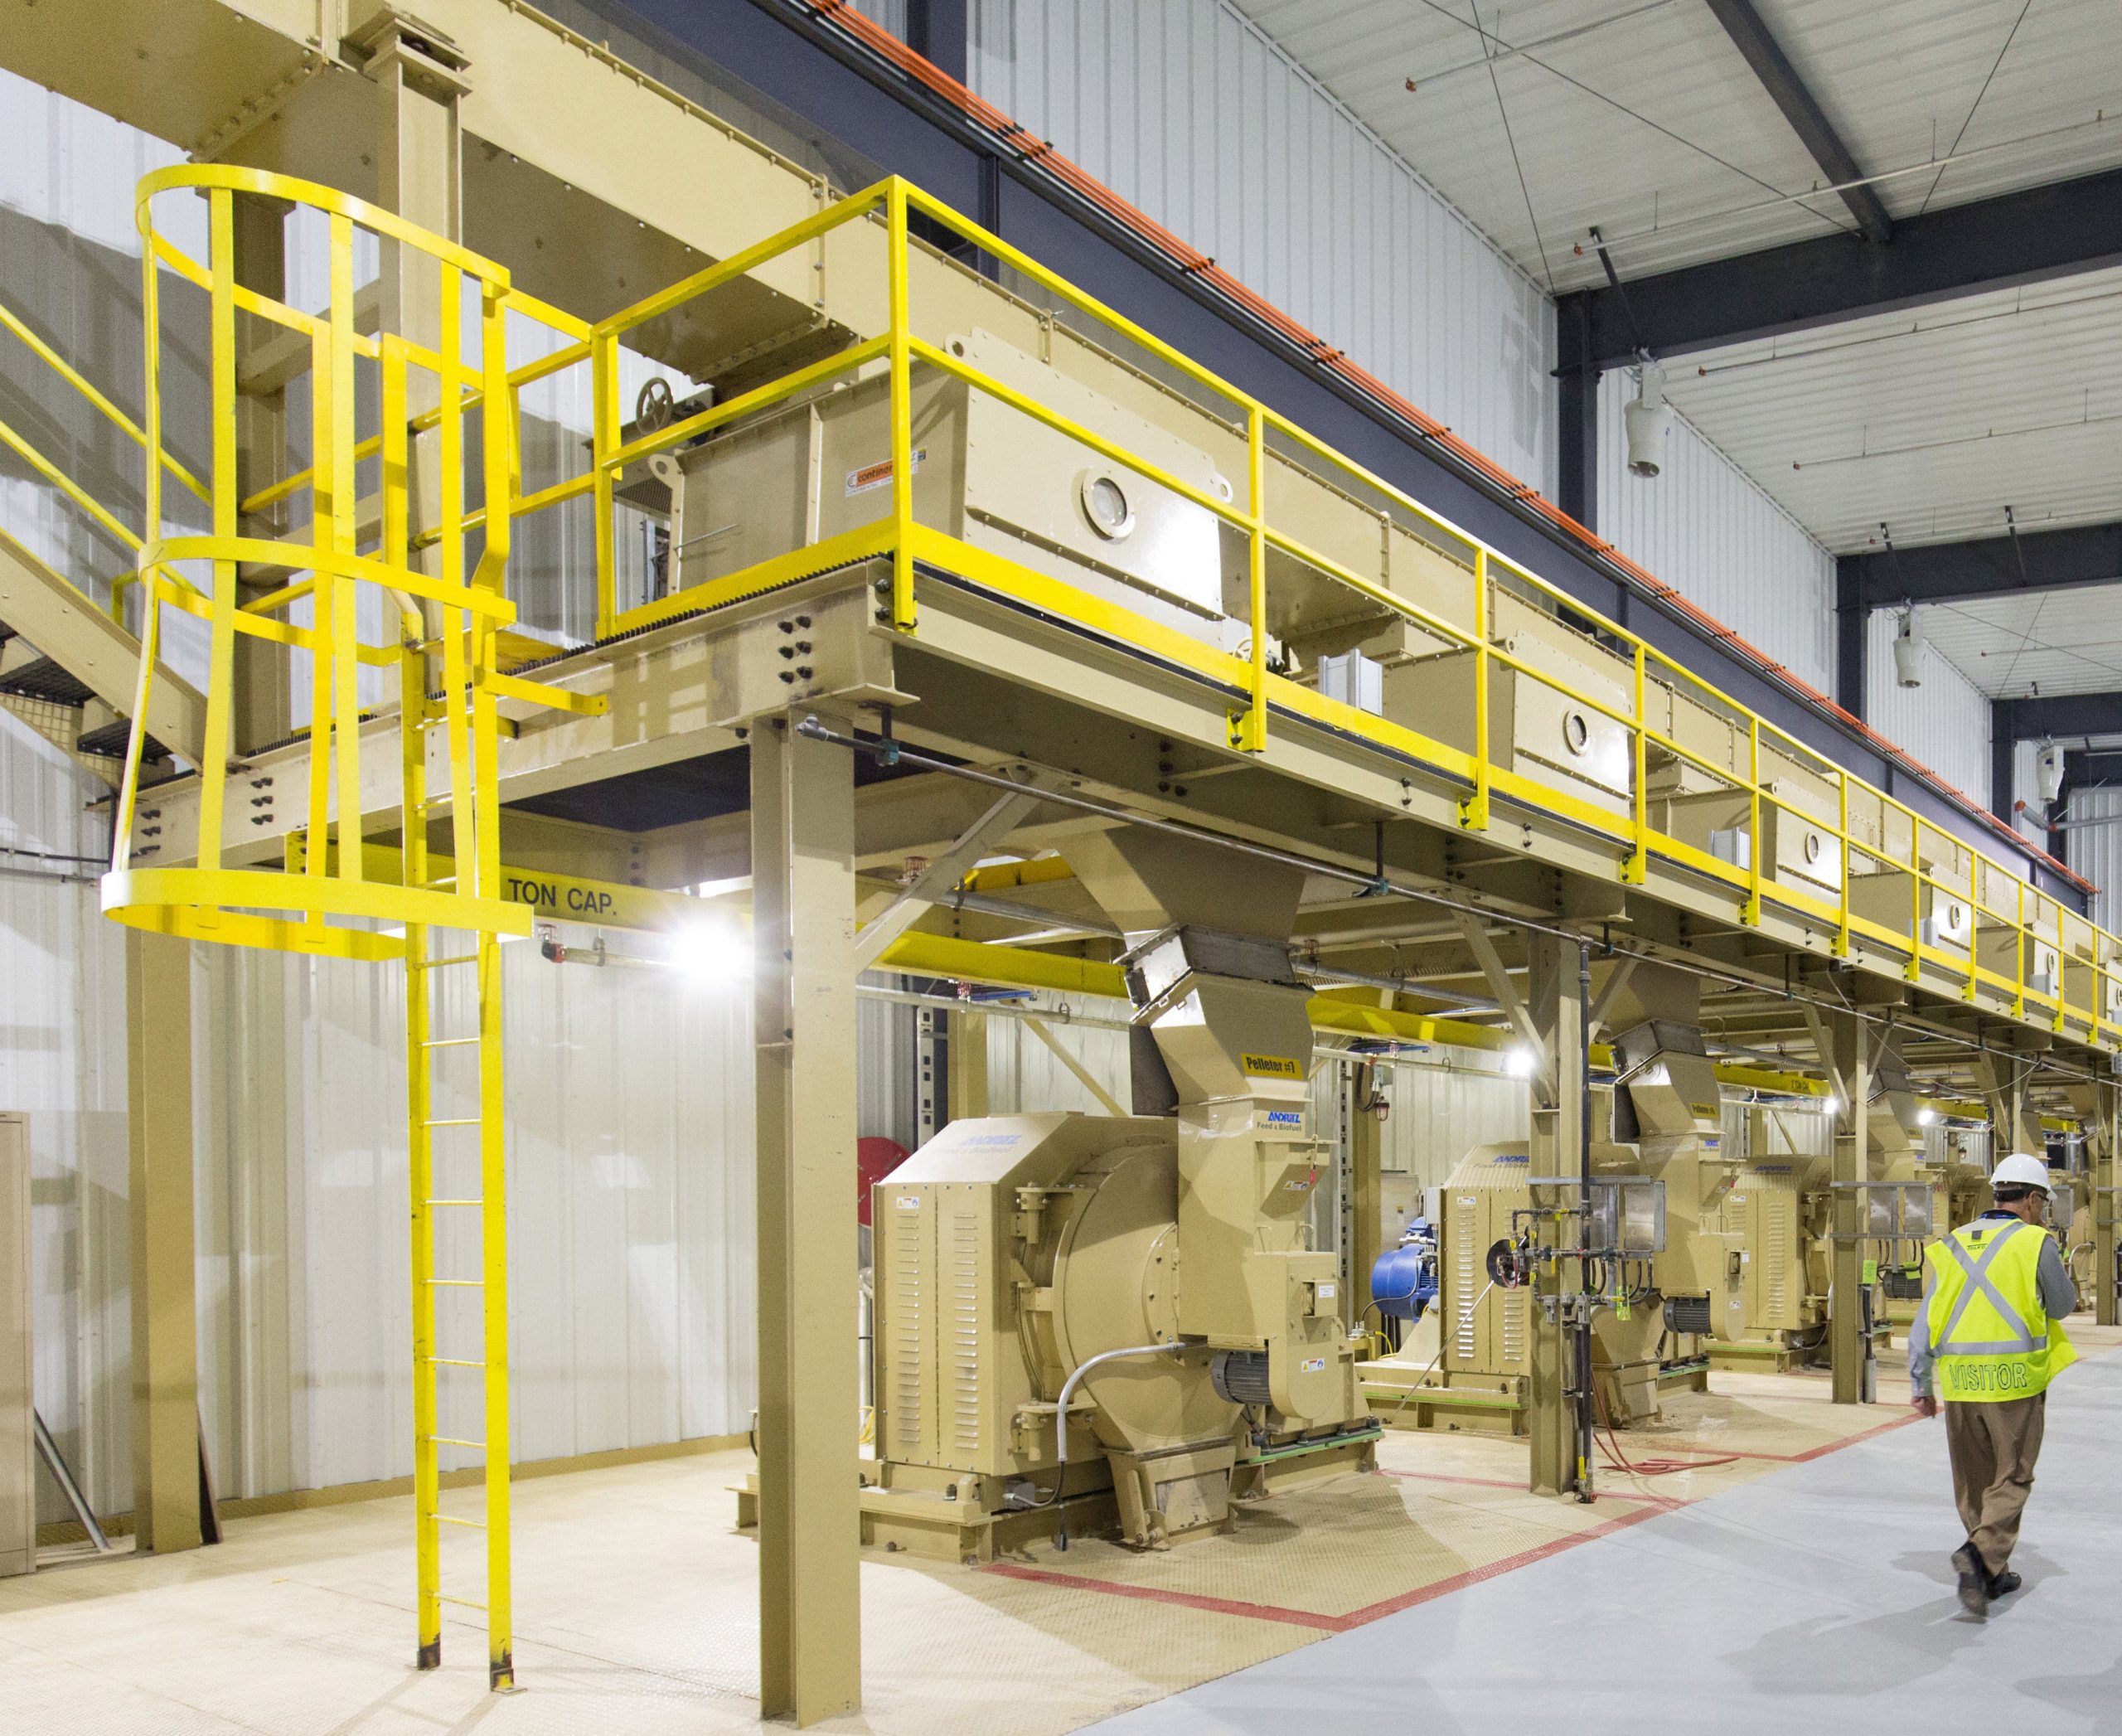
Pinnacle has ownership interests in ten operational plants and one in development (commissioning 2021), six of which are operated through joint venture arrangements, providing access to nameplate production capacity of 2.9 million tonnes per annum.

Seven of Pinnacle’s sites are in British Columbia (1.6 million tonne nameplate capacity) and two are in Alberta (0.6 million tonne nameplate capacity). All of these sites have rail lines to ports at either Prince Rupert or Vancouver, both accessing the Pacific Ocean, providing routes to Asian and European markets.

Pinnacle also operates a US hub at Aliceville, Alabama (0.3 million tonne nameplate capacity) and is developing a second site in Demopolis, Alabama (0.4 million tonne nameplate capacity), which Pinnacle expects to commission in 2021. Pinnacle’s total operational and development nameplate capacity in the US is 0.7 million tonnes.

Pinnacle’s US sites are close to Drax’s existing operations in the Southeastern US and will utilise river barges to access the Port of Mobile and barge-to-ship loading, reducing fixed port storage costs.
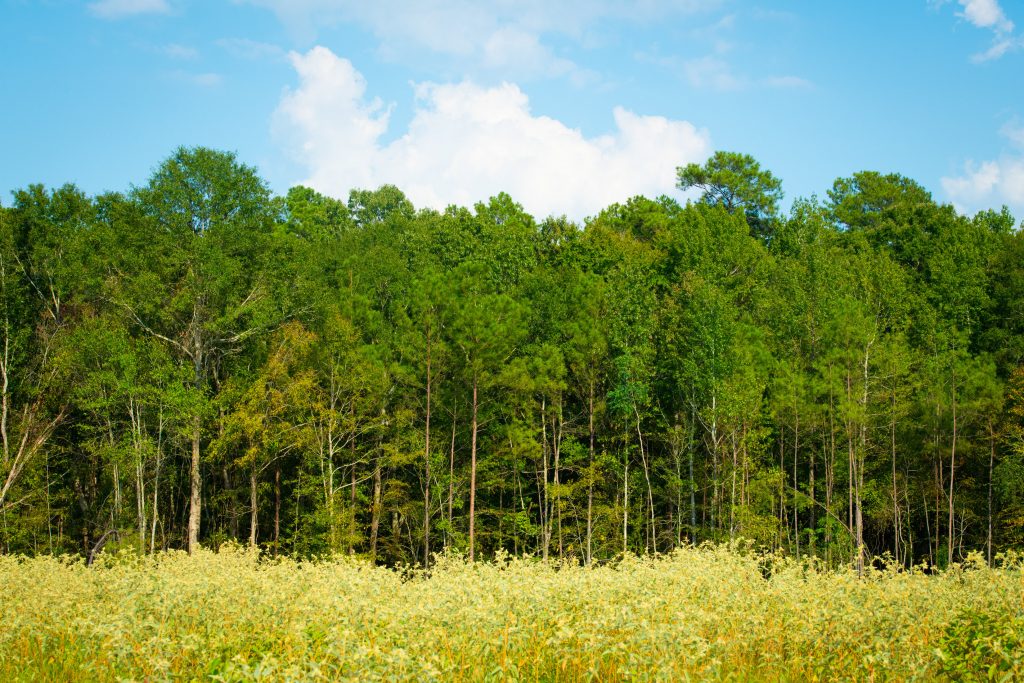
Forest in LaSalle catchment area

Working forest in LaSalle BioEnergy catchment area, Louisiana

All production sites are located in areas with access to fibre and are able to operate with a range of biomass material from existing commercial forestry activities, including sawmill residues, pre-commercial thinnings and low-grade wood. Combined with a geographic spread of production capacity and access to three separate export facilities, Pinnacle benefits from operational and sourcing flexibility, further enhancing Drax’s security of supply.

Further information is set out in Appendix 1 to this announcement.

Long-term biomass revenues with access to Asian and European markets

Pinnacle has contracted sales of C$6.7 billion, with high-quality Asian and European counterparties (including Drax). This equates to 99% of its current production capacity contracted to third parties through 2026 and a significant volume contracted in 2027 and beyond, providing long-term high-quality revenues.
Vessel carrying biomass pellets at Westview Terminal, British Columbia

Pinnacle has been supplying biomass to Europe since 2004. The location of the majority of Pinnacle’s production capacity in Western Canada, with access to the Pacific Ocean, provides a strong position from which to serve the growing demand for biomass in Asian markets. In 2018 and 2019, Pinnacle entered into 12 new long-term contracts in Japan and South Korea, totalling over 1.3 million tonnes per annum, valued at C$4.6 billion, with most contracts commencing between 2021 and 2023. The average contract duration is nine years, with certain contracts extending significantly beyond this point. Contracts typically operate on a take-or-pay basis.

Global growth opportunities for sustainable biomass

The global biomass wood pellet market has a broad range of providers that are expected to expand their production capacity, including operators such as Enviva, Graanul Invest, Pinnacle, An Viet Phat, Fram and SY Energy.

The market for biomass wood pellets for renewable generation in Europe and Asia is expected to grow in the current decade, principally driven by Asian demand(5). Drax believes that increasingly ambitious global decarbonisation targets, the need for negative emissions and an improved understanding of the role that sustainably sourced biomass can play will result in continued robust demand.

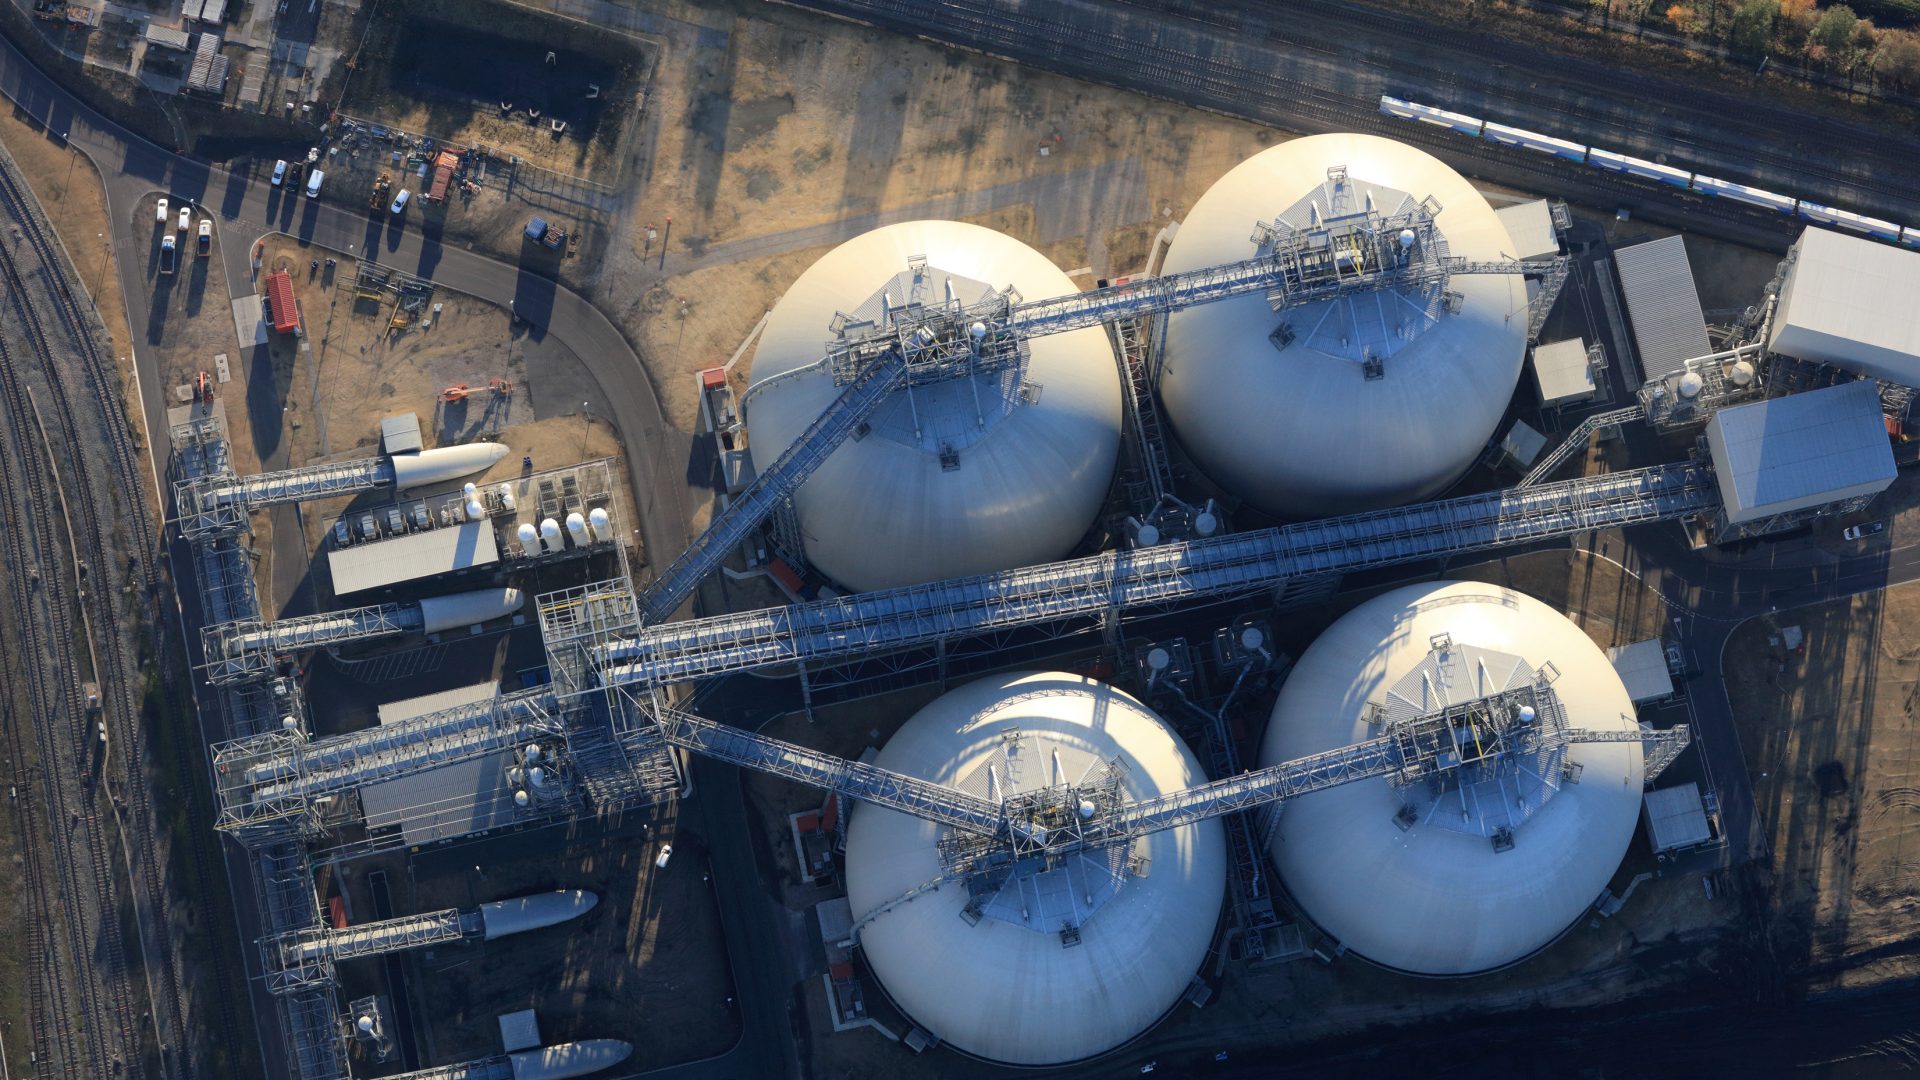
Aerial photo of biomass storage domes, Drax Power Station

Train pulling biomass wagons, storage domes and wood pellet conveyor system Drax Power Station, North Yorkshire

As a vertically integrated producer and consumer of sustainable biomass Drax is differentiated from its peers and well positioned to deliver supply chain efficiencies and an expanded range of sustainable biomass materials for own-use and third-party sales.

Through its expanding lower cost supply chain, expertise in biomass generation and enhanced global footprint, Drax believes that there will be opportunities to work with other companies and countries in developing their own biomass-enabled decarbonisation strategies.

Strong return on investment

The Acquisition is expected to be cash generative and represent an attractive opportunity to create significant value for shareholders, with expected returns significantly in excess of the Group’s weighted average cost of capital.

The addition of long-term contracts with high-quality counterparties in growing international biomass markets will reduce the Group’s relative exposure to commodity prices, in line with the Group’s objective to improve earnings quality and visibility.

In total, the Acquisition increases access to lower cost biomass by a further 2.9 million tonnes after the commissioning of the Demopolis plant in 2021. The price paid for this capacity is consistent with the previously outlined strategy to invest in the region of c.£600 million to deliver Drax’s plans for five million tonnes of self-supply capacity and a biomass cost of £50/MWh by 2027.

For the year ended 27 December 2019, Pinnacle generated Adjusted EBITDA(6) of C$47 million from pellet sales of 1.7 million tonnes.

Pinnacle’s 2019 performance was impacted by fire at its Entwistle plant, reduced rail access due to rail industrial action and weather disrupted forestry activity. At the same time Pinnacle experienced regional Canadian sawmill closures, resulting in some reduction in sawmill residues and an increase in provincial fibre prices.

Fibre diversification and the development of a second hub in the Southeastern US is expected to partially mitigate the risk of fibre price rises.

Taking these factors into account, alongside the commissioning of new capacity and the commencement of Asian supply contracts, Pinnacle’s 2022 consensus EBITDA is C$99 million, increasing to C$126 million in 2023 (Bloomberg).

The Acquisition strengthens the Group’s ability to pay a sustainable and growing dividend. Drax does not expect the Acquisition to have any impact on its expectations for the final dividend payment for 2020.

Financing the Acquisition

The Acquisition is expected to be funded from cash and existing agreements. On 15 December 2020 the Group issued a trading update which noted cash and total committed liquidity of £643 million at 30 November 2020. Following the completion, on 31 January 2021, of the sale of four gas power stations, previously announced on 15 December 2020, the Group received cash of £188 million, being the agreed purchase price consideration of £164 million and £24 million of customary working capital adjustments.

Net debt to Adjusted EBITDA(7) in 2021 is expected to be above Drax’s long-term target of around 2 times immediately after completion of the Acquisition but is expected to return to around this level by the end of 2022.

Management of foreign exchange exposure

The Acquisition price will be paid in Canadian dollars. Pinnacle’s existing contracts with Drax and third parties are denominated in Canadian and US dollars and Drax expects to manage any exposure within its foreign exchange processes.

Drax’s policy is to hedge its foreign currency exposure on contracted biomass volumes over a rolling five-year period. This has given rise to an average foreign exchange rate hedge around 1.40 (US$/GBP£).

Sustainable sourcing

Sustainably sourced biomass is an important part of UK and European renewable energy policy. The renewable status of sustainably sourced biomass is based on well-established scientific principles set out by the Intergovernmental Panel on Climate Change and reflected in the European Union’s (EU) second Renewable Energy Directive and the UK Renewables Obligation.

Drax maintains a rigorous approach to biomass sustainability, ensuring the wood fibre it uses is fully compliant with the UK’s mandatory standards as well as those of the EU.

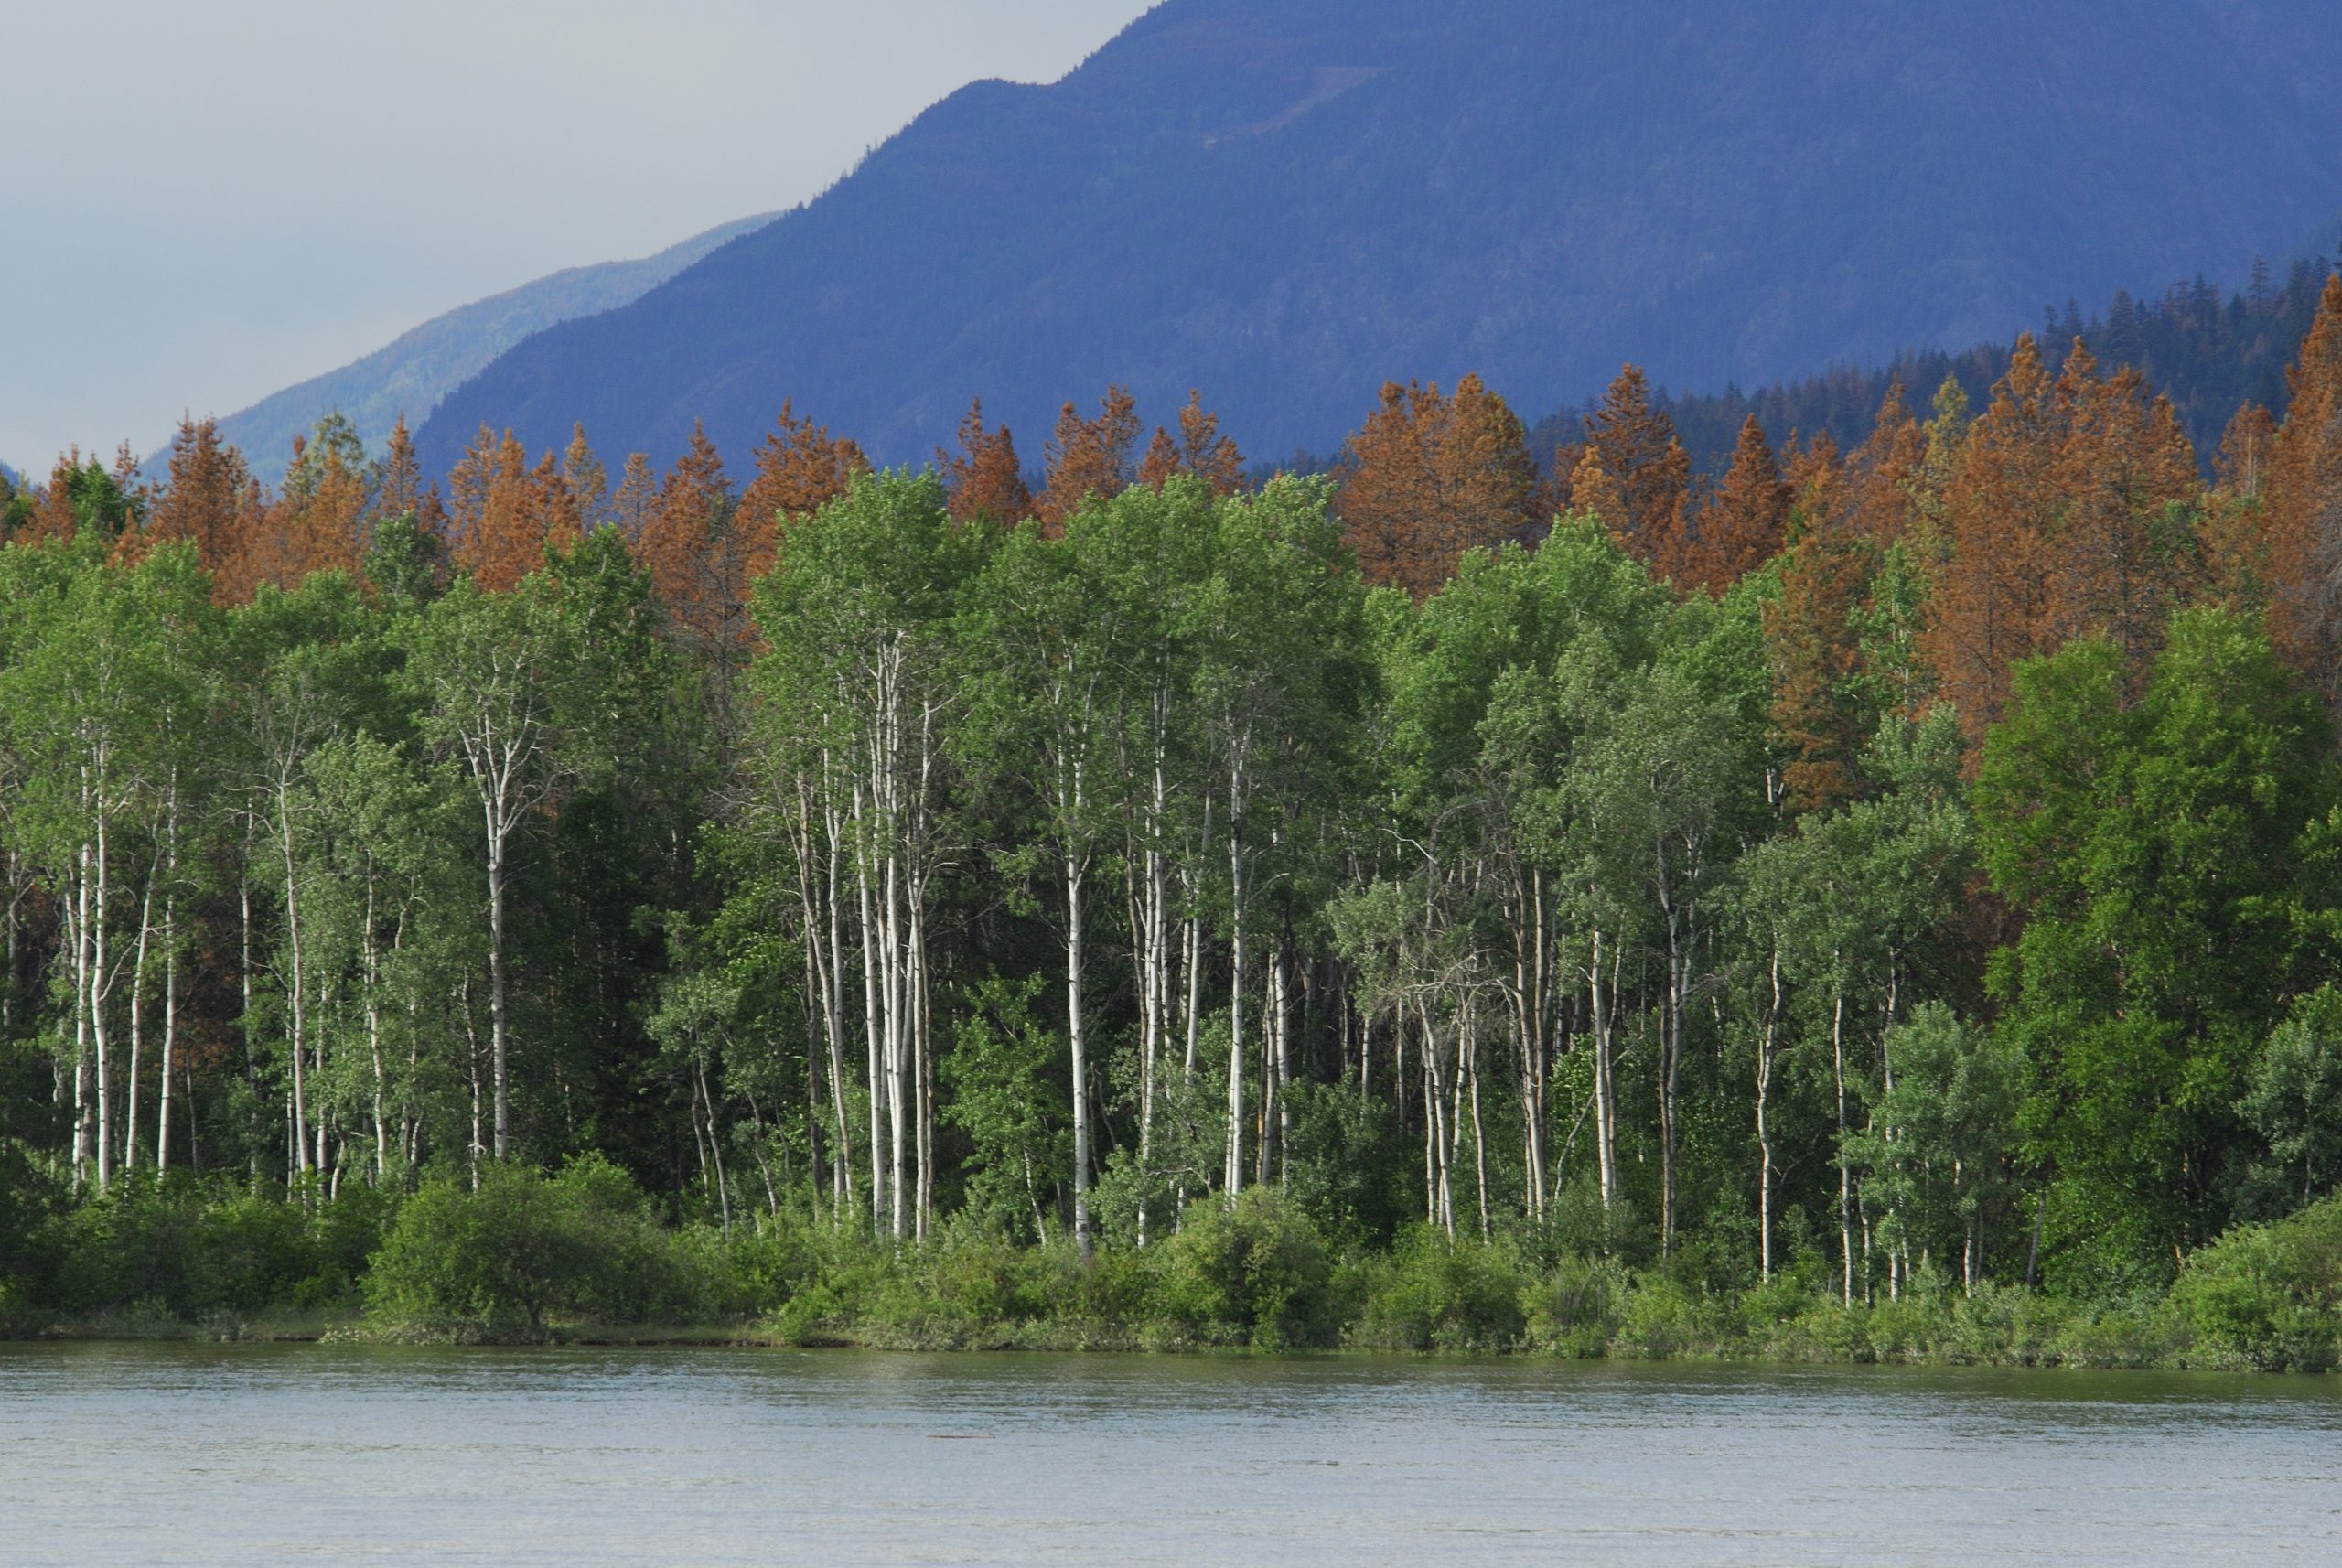
British Columbia, near Barriere, North Thompson River, aspen trees, dead pine trees behind infected with pine bark beetle (aka mountain pine beetle)

Dead pine trees in background, infected with mountain pine beetle, British Columbia

Drax recognises that the forest landscape in British Columbia and Alberta is different to commercially managed forests in the Southeastern US. Working in partnership with eNGO Earthworm, Drax has a good understanding of the considerations associated with sourcing residues from harvesting of primary forest and the particular characteristics of the forests in British Columbia and Alberta. In line with its responsible sourcing policy, Drax will work closely with eNGO partners, Indigenous First Nation communities and other stakeholders, and invest to deliver good environmental, social and climate outcomes in Pinnacle’s sourcing areas.

Operational efficiencies, improvements and savings

The strong financial returns associated with the Acquisition are not dependent on synergy benefits, but the Group has identified areas for potential operational improvements and efficiencies, and opportunities to invest across the supply chain to achieve consistent standards and improve outputs across the enlarged group.

Portfolio optimisation

Drax aims to leverage Pinnacle’s trading capability across its expanded portfolio. Drax believes that the enlarged supply chain will provide greater opportunities to optimise the supply of biomass from its own assets and third-party suppliers.

With existing plans to widen of the Group’s sustainable biomass fuel mix to include a wider range of lower cost sustainable biomass materials, Drax expects to create further opportunities to optimise fuel cargos for own use and third-party supply.

Logistics optimisation

Drax believes that the transport and shipping requirements of the enlarged group will provide greater opportunities to optimise logistics, with delivery of cargos to a counterparty’s closest port, reducing distance, time, carbon footprint and cost.

Enhanced security of supply

Control of Drax’s biomass supply chain, with geographically diverse production and export facilities, is expected to enhance security of supply, further mitigating the risk of supply interruptions thereby resulting in improved reliability and a reduced risk of supply interruption.

Combined expertise

Drax believes that there will be opportunities to share best practice and drive improved production performance across the enlarged group by leveraging combined expertise in the production of good-quality, low-cost pellets across the enlarged supply chain.

Drax also expects to leverage Pinnacle’s experience in developing and managing third-party off-take agreements alongside its existing commercial and trading capabilities to develop new agreements for supply to third-parties.

Stronger counterparty credit

Drax has a stronger credit rating, which could enable Pinnacle to develop its supply capability and contracts in Asian and European markets beyond its current position.

Reduced cost of debt

Drax’s average cost of debt is lower than Pinnacle’s giving rise to potential future savings.

Corporate cost savings

Drax expects to derive typical corporate cost savings associated with the Acquisition and delisting from the Toronto Stock Exchange.

Shareholder approvals

The Acquisition constitutes a Class 1 transaction under the Listing Rules. As a consequence, completion of the Acquisition is conditional on the Acquisition receiving the approval of Drax shareholders. A combined shareholder circular and notice of general meeting will be posted to shareholders as soon as practicable.

Among other things, the Acquisition is also conditional upon the approval of the Acquisition by Pinnacle’s shareholders, the approval of the Supreme Court of British Columbia, certain antitrust and other regulatory approvals other customary conditions.

A summary of the terms of the Acquisition Agreement is set out in Appendix 2 to this announcement.

Drax’s board has unanimously recommended that Drax’s shareholders vote in favour of the Acquisition, as each of the Drax directors that hold shares in Drax shall do in respect of their own beneficial holdings of Drax’s shares, representing approximately 0.17 per cent. of the existing share capital of Drax as at 5 February 2021, being the last business day prior to the date of this announcement.

Pinnacle’s board has unanimously recommended that Pinnacle’s shareholders vote in favour of the Acquisition at the Pinnacle General Meeting, as the Pinnacle directors (and certain current and former members of Pinnacle management that hold shares in Pinnacle) shall do in respect of their own beneficial holdings of Pinnacle’s shares, representing approximately 4.75 per cent. of the existing share capital of Pinnacle as at 5 February 2021, being the last business day prior to the date of this announcement.

In addition to the irrevocable undertakings from Pinnacle directors described above, Drax has also received an irrevocable undertaking from affiliates of ONCAP (which, together, hold shares representing approximately 31% of Pinnacle’s shares as at 5 February 2021 (being the last business day prior to the date of this announcement)) to vote in favour of the Acquisition at Pinnacle’s General Meeting.

Other

Drax issued a trading update on 15 December 2020 outlining its expectations for 2020 and expects to announce its full year results for the year ended 31 December 2020 on 25 February 2021.

Enquiries:

Drax Investor Relations: Mark Strafford
+44 (0) 7730 763 949

Media:

Drax External Communications: Ali Lewis
+44 (0) 7712 670 888 

Royal Bank of Canada (Financial Adviser and Joint Corporate Broker):

+44 (0) 20 7653 4000
Peter Buzzi
Mark Rushton
Evgeni Jordanov
Jonathan Hardy
Jack Wood

Acquisition presentation meeting and webcast arrangements

Management will host a webcast for analysts and investors at 9:30am (UK Time), Monday 8 February 2021.

The webcast can be accessed remotely via a live webcast link, as detailed below. After the meeting, the webcast recording will be made available and access details of this recording are also set out below.

A copy of the presentation will be made available from 7am (UK time) on 8 February 2021 for download at: https://www.drax.com/investors/results-reports-agm/#investor-relations-presentations

Event Title:
Drax Group plc: Proposed Acquisition of Pinnacle Renewable Energy Inc

Event Date:
9:30am (UK time), Monday 08 February 2021

Webcast Live Event Link:
https://secure.emincote.com/client/drax/drax010

Start Date:
9:30am (UK time), Monday 08 February 2021

Delete Date:
Monday 27 December 2021

Archive Link:
https://secure.emincote.com/client/drax/drax010

Important notice

The contents of this announcement have been prepared by and are the sole responsibility of Drax Group plc (the “Company”).

RBC Europe Limited (“RBC”), which is authorised by the Prudential Regulation Authority (the “PRA”) and regulated in the United Kingdom by the Financial Conduct Authority (“FCA”) and the PRA, is acting exclusively for the Company and for no one else in connection with the Acquisition, the content of this announcement and other matters described in this announcement and will not regard any other person as its clients in relation to the Acquisition, the content of this announcement and other matters described in this announcement and will not be responsible to anyone other than the Company for providing the protections afforded to its clients nor for providing advice to any other person in relation to the Acquisition, the content of this announcement or any other matters referred to in this announcement.

This announcement does not constitute or form part of any offer or invitation to sell or issue, or any solicitation of any offer to purchase or subscribe for, any shares in the Company or in any entity discussed herein, in any jurisdiction nor shall it or any part of it nor the fact of its distribution form the basis of, or be relied on in connection with, any contract commitment or investment decision in relation thereto nor does it constitute a recommendation regarding the securities of the Company or of any entity discussed herein.

RBC and its affiliates do not accept any responsibility or liability whatsoever and make no representations or warranties, express or implied, in relation to the contents of this announcement, including its accuracy, fairness, sufficient, completeness or verification or for any other statement made or purported to be made by it, or on its behalf, in connection with the Acquisition and nothing in this announcement is, or shall be relied upon as, a promise or representation in this respect, whether as to the past or the future. RBC and its respective affiliates accordingly disclaim to the fullest extent permitted by law all and any responsibility and liability whether arising in tort, contract or otherwise which it might otherwise be found to have in respect of this announcement or any such statement.

Certain statements in this announcement may be forward-looking. Any forward-looking statements reflect the Company’s current view with respect to future events and are subject to risks relating to future events and other risks, uncertainties and assumptions relating to the Company and its group’s and/or, following completion, the enlarged group’s business, results of operations, financial position, liquidity, prospects, growth, strategies, integration of the business organisations and achievement of anticipated combination benefits in a timely manner. Forward-looking statements speak only as of the date they are made. Although the Company believes that the expectations reflected in these forward looking statements are reasonable, it can give no assurance or guarantee that these expectations will prove to have been correct. Because these statements involve risks and uncertainties, actual results may differ materially from those expressed or implied by these forward looking statements.

Each of the Company, RBC and their respective affiliates expressly disclaim any obligation or undertaking to supplement, amend, update, review or revise any of the forward looking statements made herein, except as required by law.

You are advised to read this announcement and any circular (if and when published) in their entirety for a further discussion of the factors that could affect the Company and its group and/or, following completion, the enlarged group’s future performance. In light of these risks, uncertainties and assumptions, the events described in the forward-looking statements in this announcement may not occur.

Neither the content of the Company’s website (or any other website) nor any website accessible by hyperlinks on the Company’s website (or any other website) is incorporated in, or forms part of, this announcement.

Appendix 1

Pinnacle Production Capacity

PlantLocationStatusCommissioningNameplate Capacity (Mt)Pinnacle Ownership (%)
Williams LakeBC, CanadaOperational20040.2100%
HoustonBC, CanadaOperational20060.230%
ArmstrongBC, CanadaOperational20070.1100%
MeadowbankBC, CanadaOperational20080.2100%
Burns LakeBC, CanadaOperational20110.4100%
LavingtonBC, CanadaOperational20150.375%
SmithersBC, CanadaOperational20180.170%
EntwistleAlberta, CanadaOperational20180.4100%
AlicevilleAlabama, USAOperational20180.370%
High LevelAlberta, CanadaOperational20200.250%
DemopolisAlabama, USADevelopmentEst. 20210.470%
Total2.980%

Capacity by fibre basket in 2021

LocationNameplate Capacity (Mt)Pinnacle Ownership (%)
BC, Canada1.684%
Alberta, Canada0.683%
Alabama, USA0.370%
Total2.582%

Capacity by fibre basket in 2022

LocationNameplate Capacity (Mt)Pinnacle Ownership (%)
BC, Canada1.684%
Alberta, Canada0.683%
Alabama, USA0.763%
Total2.981%

Across its business Pinnacle employs 485 employees, principally in the operation of its assets.

Appendix 2

Principal terms of the Acquisition Agreement

The following is a summary of the principal terms of the Acquisition Agreement.

Parties and consideration

The Acquisition Agreement was entered into on 7 February 2021 between Drax, Drax Canadian Holdings Inc., (an indirect wholly-owned subsidiary of Drax) (“Bidco”) and Pinnacle. Pursuant to the Acquisition Agreement, Bidco has agreed to acquire all of the issued and outstanding shares in Pinnacle and, immediately following completion, Pinnacle will be an indirect wholly-owned subsidiary of Drax. The Acquisition will be implemented by way of a statutory plan of arrangement in accordance with the laws of the Province of British Columbia, Canada.

Conditions

Completion under the Acquisition Agreement is subject to, and can only occur upon satisfaction or waiver of, a number of conditions, including:

(a) the approval of the Acquisition by Drax shareholders who together represent a simple majority of votes cast at a meeting of Drax shareholders;

(b) the approval of the Acquisition by Pinnacle shareholders who together represent not less than two-thirds of votes cast at a meeting of Pinnacle shareholders;

(c) an interim order providing for, among other things, the calling and holding of a meeting of Pinnacle shareholders and a final order to approve the Arrangement, each having been granted by the Supreme Court of British Columbia;

(d) no material adverse effect having occurred in respect of Pinnacle;

(e) in the event that the Competition and Markets Authority (the “CMA”) has requested submission of a merger notice or opened a merger investigation, the CMA having issued a decision that the Acquisition will not be subject to a Phase 2 reference or the period for the CMA considering a merger notice has expired without a Phase 2 reference having been made;

(f) either the receipt of an advance ruling certificate or both the expiry, termination or waiver of the applicable waiting period under the Competition Act (Canada) and, unless waived by Drax, receipt of a no-action letter in respect of the Acquisition from the Commissioner of Competition;

(g) the expiry or early termination of any applicable waiting period (and any extension of such period) applicable to the Acquisition under the Hart-Scott-Rodino Antitrust Improvements Act of 1976 (US); and

(h) the receipt a third party consent

In addition, Drax has the unilateral right not to complete the Acquisition where registered Pinnacle shareholders representing more than five per cent. of the outstanding share capital of Pinnacle duly exercise their dissent rights.

If any of the conditions are not satisfied (or waived) by 7 September 2021, either party can terminate the Acquisition Agreement.

Non-solicitation

Prior to obtaining approval from their respective shareholders in relation to the Acquisition, each of Drax and Pinnacle are prohibited from soliciting from any third party any acquisition proposal (relating to 20 per cent. or more of their shares or their group’s assets). However, if prior to obtaining Drax shareholder approval, Drax receives an unsolicited bona fide proposal in respect of 50 per cent. or more of its shares or all or substantially all of the assets of the Drax group and which the Drax board considers would result in a transaction that is more favourable to Drax shareholders from a financial perspective than the Acquisition (a “Drax Superior Proposal”), it may engage in discussions in relation to such Drax Superior Proposal in accordance with the terms of the Acquisition Agreement. Similarly, if prior to obtaining Pinnacle shareholder approval, Pinnacle receives an unsolicited bona fide proposal in respect of 100 per cent. of its shares or all or substantially all of the assets of the Pinnacle group and which the Pinnacle board considers would result in a transaction that is more favourable to Pinnacle shareholders from a financial perspective than the Acquisition (a “Pinnacle Superior Proposal”), it may engage in discussions in relation to such proposal in accordance with the terms of the Acquisition Agreement.

Termination fees payable to Pinnacle

Drax has agreed to pay a break fee of C$25 million to Pinnacle if the Acquisition Agreement is terminated as a result of:

(a) the Drax board withholding, withdrawing or adversely modifying its recommendation that Drax shareholders approve the Acquisition;

(b) the Drax board authorising Drax to enter into any definitive agreement (other than a confidentiality agreement) in respect of a Drax Superior Proposal;

(c) the Drax board terminating the Acquisition Agreement in response to any intervening event that was not known to the Drax board as of the date of the Acquisition Agreement;

(d) Drax breaching its non-solicitation obligations set out in the Acquisition Agreement; or

(e) completion not occurring by 7 September 2021 or a failure to obtain Drax shareholder approval and, in each case, an acquisition of 50 per cent. of Drax’s shares or assets (subject to certain exceptions) is is made or announced prior to the Drax shareholder approval having been obtained and any such acquisition is consummated (or a definitive agreement is entered into in respect of the same) within 12 months of termination.

In addition, Drax has agreed to pay Pinnacle an expense fee of C$5 million in the event that the Acquisition Agreement is terminated as a result of a failure to obtain Drax shareholder approval. The expense fee shall not be payable in the event that the break fee is also payable.

Termination fees payable to Drax

Pinnacle has agreed to pay a break fee of C$12.5 million to Drax if the Acquisition Agreement is terminated as a result of:

(a) the Pinnacle board withholding, withdrawing or adversely modifying its recommendation that Drax shareholders approve the Acquisition;

(b) the Pinnacle board authorising Pinnacle to enter into any definitive agreement (other than a confidentiality agreement) in respect of a Pinnacle Superior Proposal;

(c) the Pinnacle board terminating the Acquisition Agreement in response to any intervening event that was not known to the Pinnacle board as of the date of the Acquisition Agreement;

(d) Pinnacle breaching its non-solicitation obligations set out in the Acquisition Agreement; or

(e) completion not occurring by 7 September 2021 or a failure to obtain Pinnacle shareholder approval and, in each case, an acquisition of 50 per cent. of Pinnacle’s shares or assets (subject to certain exceptions) is made or announced prior to the Drax shareholder approval having been obtained and any such acquisition is consummated (or a definitive agreement is entered into in respect of the same) within 12 months of termination.

Burns Lake and Houston pellet plant catchment area analysis

British Columbia, near Barriere, North Thompson River, aspen trees, dead pine trees behind infected with pine bark beetle (aka mountain pine beetle)

The eigth report in a series of catchment area analyses for Drax looks at the fibre sourcing area surrounding two compressed wood pellet plants operated by Pinnacle.

This part of interior British Columbia (BC) is unique in the Drax supply chain. Forest type, character, history, utilisation, natural challenges, logistics, forest management and planning are all very different to the other regions from which Drax sources biomass. Recently devasted by insect pest and fire damage, Arborvitae Environmental Services has produced a fascinating overview of the key issues and challenges that are being experienced in this region.

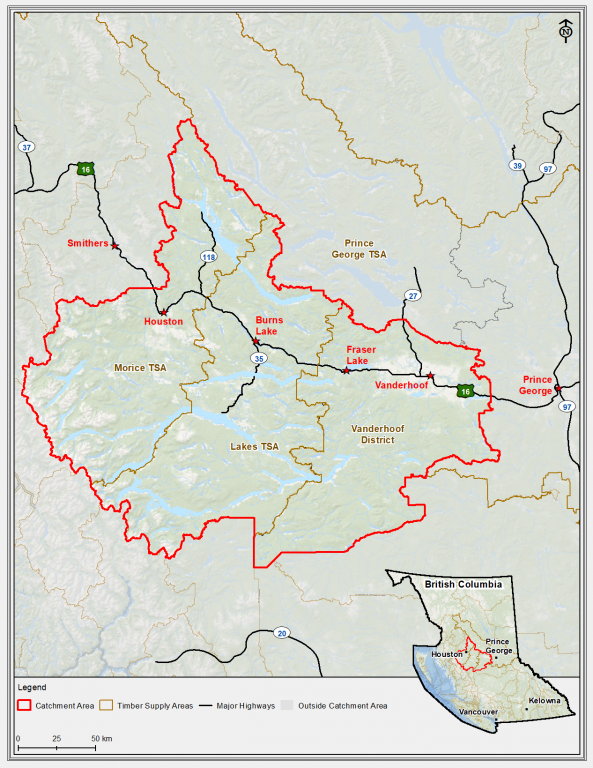
Figure 1: Catchment area map of the region [Click to view/download]

A positive response to natural disasters

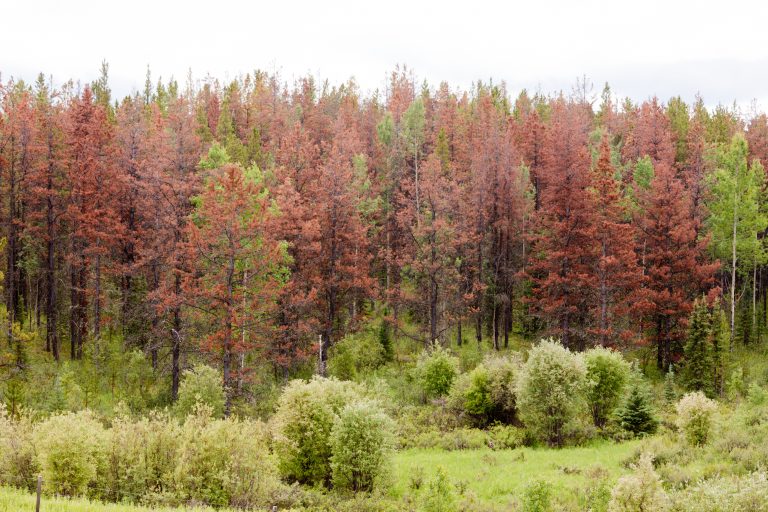
Like the entire BC Interior, the area has suffered a devastating attack of Mountain Pine Beetle (MPB) damage over the last 20 years which has completely dominated every forest management decision and action. Within the catchment area, the MPB killed an estimated 157 million cubic metres (m3) between 1999 and 2014, representing 42% of the estimated 377 million m3 of total standing timber in the catchment area in 1999.  In addition, severe wildfires in 2018 burned an estimated 7.1 million m3.

These natural events have had a devastating impact on the forest resource. Harvesting increased significantly to utilise the dead and dying timber as lumber in sawmills whilst it was still viable.

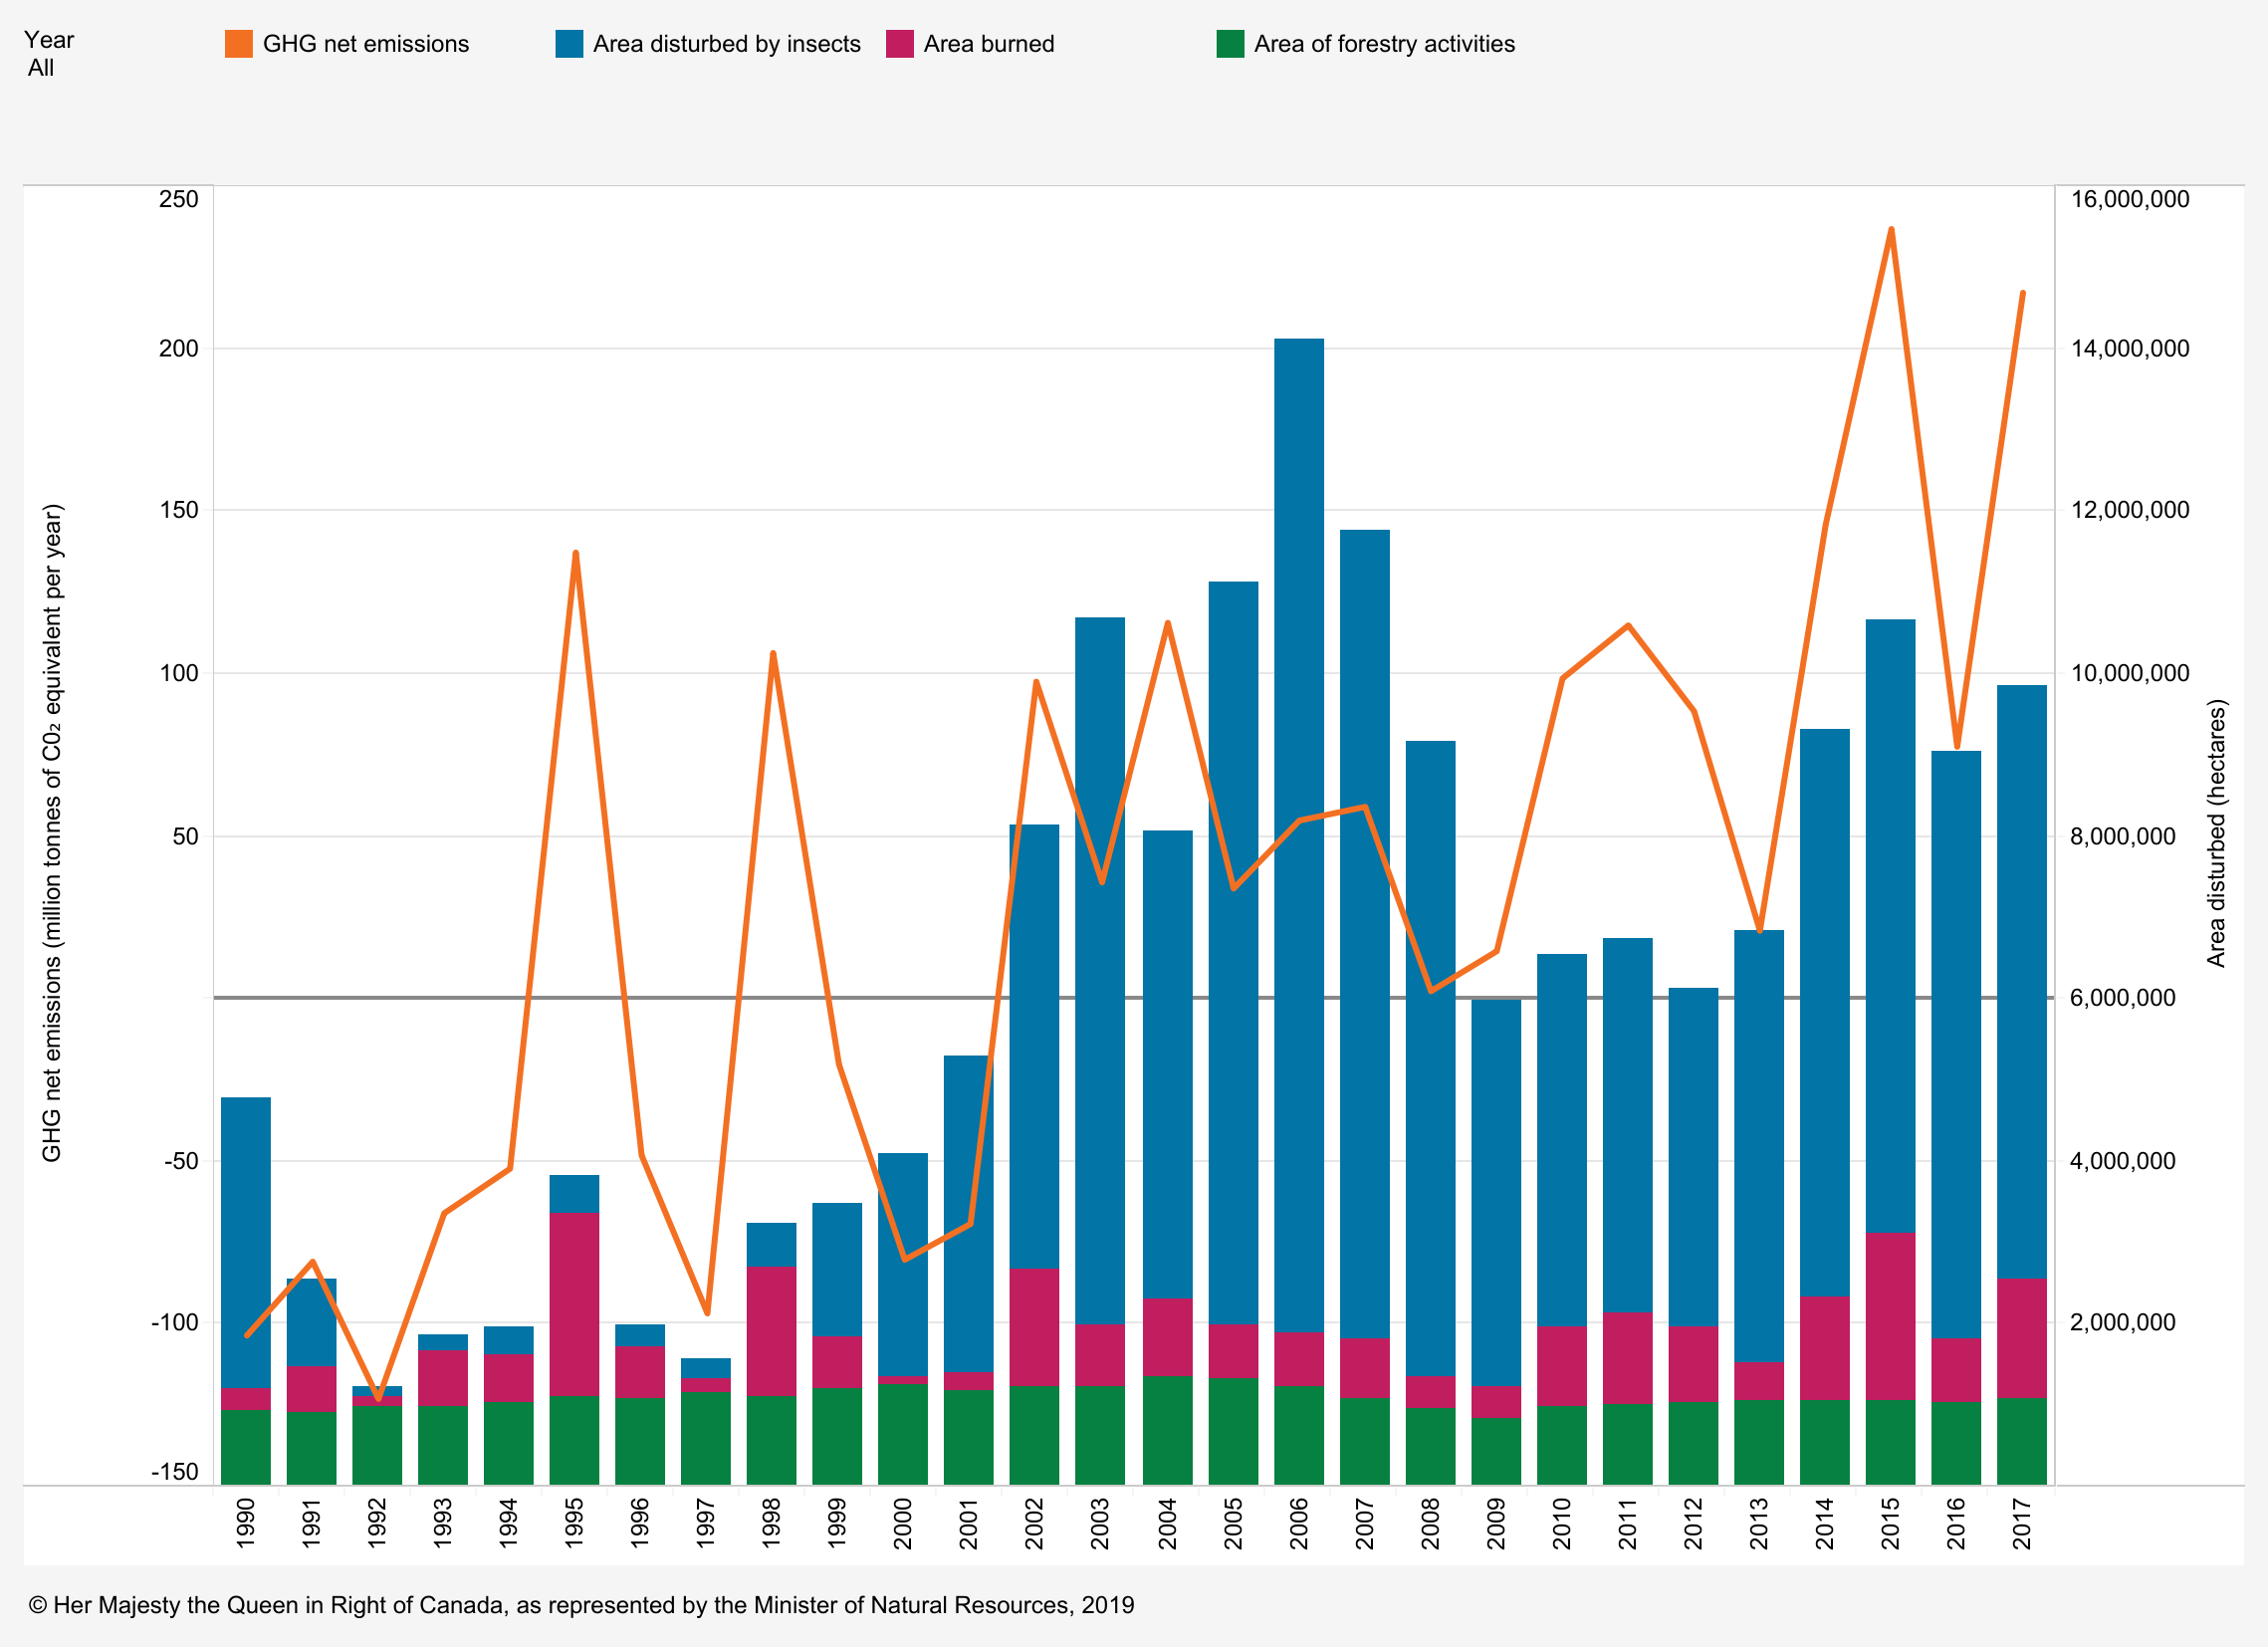
Net carbon emissions in Canada’s managed forest: All areas, 1990–2017; illustrates that the impact of fires and insect damage have been far more significant, by hectares affected, than forestry activity; Chart via Natural Government of Canada

The Pinnacle pellet mills at Burns Lake and Houston were established alongside the sawmills to utilise the sawmill residues as there were no other viable markets for this material. These sawmills draw fibre from a large distance, up to 300 miles away. Therefore, the size of the catchment area in this piece of analysis is determined by the sourcing practices of the sawmills rather than the economic viability of low grade roundwood transport to the pellet mill (see Figure 1).

Damage to pine trees by Mountain Pine Beetle (MPB)

Utilising forest residues

The two mills producing high-density biomass pellets have provided an essential outlet for residue material that would otherwise have no other market and until very recently were supplied almost entirely by mill residuals. As the quantity of dead and dying timber has reduced and sawmill production has declined, the pellet mills are beginning to utilise more low-grade roundwood and forest residues (that are otherwise heaped and burned at roadside following harvest) to supplement the sawmill co-products.

Primarily State owned managed forests

The total land area in the catchment for Burns Lake and Houston is 4.47 million hectares (ha) of which 3.75 million ha is classed as forest land, 94% of the catchment area is public land under provincial jurisdiction. The provincial forest service is responsible for all decisions on land use and forest management on public land, in consultation with communities and indigenous groups, determining which areas are suitable for timber production and which areas require protection. Approximately 34% of the catchment area is not available for commercial timber harvesting because it is either non-forested or it has low productivity, and other operational challenges, or it is protected for ecological and wildlife reasons.

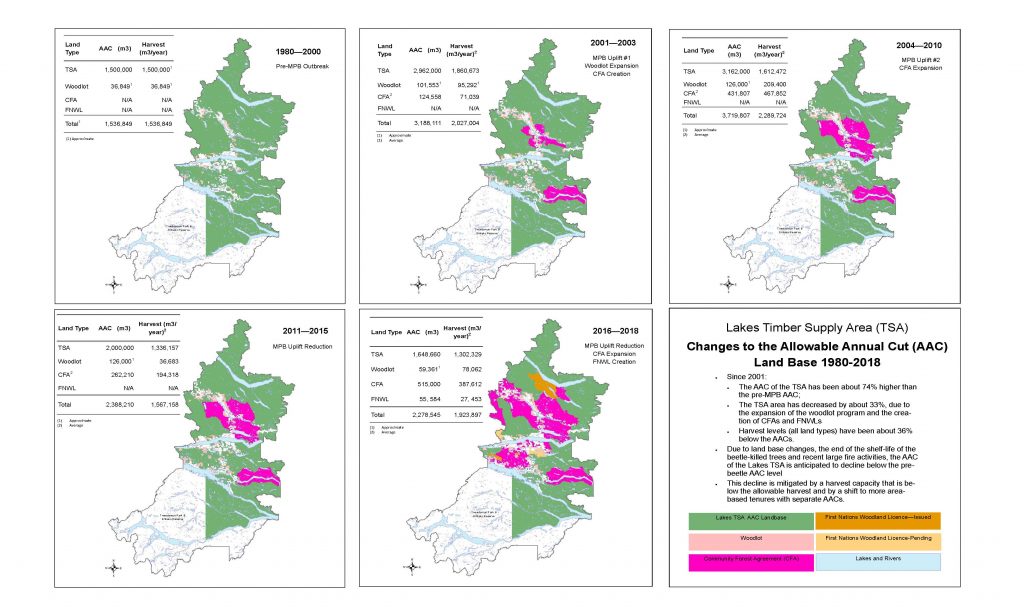
The Chief Forester for the province sets the Annual Allowable Cut (AAC) which determines the quantity of timber that can be harvested each year. Ordinarily this will be based on the sustainable yield capacity of the working forest area, but in recent years the MPB damage has necessitated a significant increase in AAC to facilitate the salvage of areas that have been attacked and damaged (see Figure 2).

Figure 2: Changes in Annual Allowable Cut 1980 to 2018 (Source: Nadina District FLNRORD) [Click to view/download]

The catchment area is in the Montane Cordillera ecozone and the Canadian Forest Service reports that between 1980 and 2017, the area of forest in the ecozone declined from 31,181,000 ha to 31,094,000 ha, a decline of 87,000 ha or 0.28 % of the forest area. Deforestation in the catchment area was estimated at 300 ha per year. Most deforestation in the ecozone occurred because of conversion to agriculture, as well as other contributing factors, such as mining, urban expansion and road construction (including forest roads).

The forest area is dominated by coniferous species (see Figure 3) predominantly lodgepole pine, spruce and fir (90% of the total area), with hardwood species (primarily aspen) making up just 8% of the total area.

Figure 3: Species composition of forest land in the catchment area.

Managing beetle damaged areas

The annual harvest volume was at a peak in the early part of the last decade at over 12 million m3 in 2011. This has now declined by around 4.5 million m3 in 2019 (see Figure 4) as the beetle damaged areas are cleared and replanted. The AAC and harvesting levels are expected to be reduced in the future to allow the forest to regrow and recover.

Figure 4: Annual change in harvest volume of major species

Future increases in forest growth rates

Historically, the forest area has naturally regenerated with self-seeded stands reaching a climax of mature pine, spruce, and Abies fir mixtures.  As the forest matured, it would often be subject to natural fires or other disturbance which would cause the cycle to begin again. Following the increase in harvesting of beetle damaged areas, many forests are now replanted with mixtures of spruce and pine rather than naturally regenerated. This is likely to lead to an increase in forest growth rates in the future and a higher volume of timber availability once the areas reach maturity (see Figure 5).

Figure 5: Forecast of future volume production

Timber markets in the catchment area are limited in comparison to other regions like the US South.  The scale of the landscape and the inaccessible nature of many of the forest areas limit the viability of access to multiple markets. Sawmills produce the highest value end-product and these markets have driven the harvesting of forest tracts for many years. Concessions to harvest timber are licensed either by volume or for a specific area from the provincial forest service. This comes with a requirement to ensure that the forest regrows and is appropriately managed after harvesting.

There are no pulp mills within the catchment area and limited alternative markets for the lowest grades of roundwood or sawmill residuals other than the pellet mills; consequently, the pellet mills have a close relationship with the sawmills.

Wood price trends

Prices for standing timber on public land are determined by the provincial government using results from public timber sales and set according to the species and quality of timber produced (from the highest-grade logs through to forest residuals). The lack of market diversity and challenging logistics mean that there is little competition for mill residuals and low-grade fibre. The price differential in end-product value between sawtimber and wood pellets ensures that fibre suitable for sawmill utilisation does not get processed by the pellet mill. A very small volume of larger dimension material can end up in a low value market when there are quality issues that limit the value for sawtimber (e.g. rotten core, structural defects) but this represents a very small proportion of the supply volume. There is no evidence that pellet mills have displaced other markets within this catchment area.

Read the full report: Catchment Area Analysis: Pinnacle Renewable Energy’s Burns Lake & Houston Mills.

This is part of a series of catchment area analyses around the forest biomass pellet plants supplying Drax Power Station with renewable fuel. Others in the series can be found here

Georgia Mill Cluster catchment area analysis

Forest in LaSalle catchment area

The seventh report in a series of catchment area analyses for Drax looks at the fibre sourcing area surrounding a number of compressed wood pellet plants operated by Georgia Biomass (now owned by Enviva) and Fram Renewable Fuels.

The evidence found in the report by Hood Consulting shows a substantial increase in forest inventory (stored carbon) and a relatively stable forest area. However, with continued pressure from urban development, future losses of timberland area are possible.  Despite this, increasing growth rates can maintain and improve wood supply and carbon stock for the foreseeable future.

Increasing forest growing stock and carbon sequestration

The overall inventory of growing stock in the catchment area has increased by 63 million cubic metres (m3) between 2000 and 2018, a growth of 19.3%.  All of this increase has been in the pine area, which increased by nearly 68 million m3, whereas the hardwood species decreased in volume by 4.5 million m3. Overall, the inventory volume split by species in 2018 was 72% to 28% softwood to hardwood. The breakdown by product category is shown in Figure 3 below.

Figure 1: Change in growing stock by major product category and species (USFS)

The pine saw-timber and chip-n-saw product categories, larger dimension and higher value material, showed the largest increase in inventory, whereas pine pulpwood decreased in total volume.  The most substantial change occurred from 2010 to 2018, where pulpwood went from an increasing trend to a decreasing trend and saw-timber increased in volume much more rapidly – this is shown in Table 1 and Figure 2 below.

Change (cubic metres (m3))Pine SawtimberPine Chip-n-sawPine PulpwoodHardwood SawtimberHardwood PulpwoodTotal
2000-201851,301,62822,277,139-5,835,2301,211,110-5,657,11463,297,533
2000-201014,722,99512,707,6745,262,192-3,740,507-5,76989923,182,455
2010-201836,578,6329,569,465-11,097,4224,951,618112,78440,115078
Table 1: Change in growing stock volume by major product category (USFS)

These changes are likely to reflect an increasing age class in the catchment area, with younger stands of pine (previously classed as pulpwood), growing into a larger size class and being reclassified as saw-timber.  This means that the volume of saw-timber availability in future will be significantly higher, but pulpwood availability will be diminished.  For pellet mill markets any loss in pulpwood availability can be compensated by an increase in sawmill residue production if market demand is maintained or increased.

Figure 2: Change in growing stock by major product category and species (USFS)

Growth rates for both softwood and hardwood species have been increasing since 2000 as shown in Figure 3 below. Softwood growth has increased by 18.5% since 2000 and hardwood by 1.4%. The improved softwood growth rate probably resulted from increased investment in the management of pine forests, the superior quality of seedlings and better management practice (ground preparation, weed control, fertilisation etc.). This is a very positive trend for the sequestration rate of carbon and also for providing landowners with the potential to increase revenue per hectare and encourage the retention and improved management of forests, rather than converting to other land uses. The Georgia catchment area is likely split between passive owners that do not actively manage, where growth rates are slower or decline and the incentive to convert land is greater, and owners that actively manage to improve growth and quality, increasing revenue and maintaining productive forest.  There is likely to be a much greater differential in growth rate between these two management approaches than reflected by the trend in Figure 3, highlighting the importance of active management for carbon abatement.

Average annual growth rate per hectare (USFS)

Figure 3: Average annual growth rate per hectare (USFS)

Stable forest area

At a macro scale, the distribution of land use categories has remained relatively stable since 2000, with no apparent major shifts in land use. The timberland area around the seven mills has decreased by around 135 thousand hectares (ha) between 2000 and 2018 (2.3% of the total land area), whilst the area of arable and urban land increased by 98 thousand (1.7% of total area) and 158 thousand (2.7% of total area) ha respectively.  In 2018, timberland represented 67% of total land area and all forest and woodland 80% of total area, down from 69% and 82% respectively in 2000 (Figure 1).

Change in land use category (USDA)

Figure 4: Change in land use category (USDA)

Looking at this change in land use more closely, the timberland area shows the most pronounced decline between 2010 and 2018, a drop of 117 thousand ha. The largest change in other land use categories over this period was an increase of 97 thousand ha in urban and other land, suggesting that a large proportion of the timberland area has been converted to urban areas.

LaSalle Bioenergy forest area

The most significant change in agricultural land occurred prior to 2010, when the timberland area remained relatively stable, this change appears to have involved the transition of pastureland to arable crops. There may also have been some reclassification of forest and woodland types, with a decrease in the area of woodland and an increase in forestland during the period between 2000 and 2010 (Table 2).

Change (hectares (ha))TimberlandOther ForestlandArable CroplandWoodlandPasturelandUrban & Other Land
2000-2018-135,19570,07398,436-77,904-113,725178,315
2000-2010-18,53953,15073,243-73,077-95,63060,852
2010-2018-116,65616,92225,193-4,827-18,09697,463
Table 2: Timing of land use change in Georgia catchment area (USDA)

These trends are also clear and apparent in Figure 3 below which shows the sharp decline in timberland area, albeit small in absolute area relative to the total catchment area size, and the steady increase in urban land.  Georgia ranks 8th in the list of US States and territories by total population with 10.6 million and 17th by population density at 184 per square mile (mi2) compared to just 63 per mi2  in Mississippi where Drax’s Amite Bioenergy (ABE) pellet plant is located and 108 per mi2 in Louisiana where the Morehouse Bioenergy (MBE) and LaSalle Bioenergy (LBE) mills are located (US Census Bureau). This population pressure and increased development can lead to more forest loss and land use change.

Trends in major land use categories (USDA)

Figure 5: Trends in major land use categories (USDA)

Drax’s suppliers in the Georgia catchment area have made a commitment not to source wood from areas where land use change is taking place. This commitment is monitored and verified through the Sustainable Biomass Program (SBP) certification process that is maintained by each mill.  Any land use change in the catchment area is likely to be a result of prevailing economic drivers in the region rather than due to actions being taken by the pellet producers.

Increasing demand and surplus forest growth

Strong markets are essential for ensuring that forests are managed and restocked to optimum benefit, sawlog markets are particularly important as this is highest revenue stream for forest owners. Figure 6 shows the trend in market demand for each major product category since 2000 and demonstrates the recent increase in softwood sawlog demand as the US economy (particularly housing starts) recovered from the global recession at the end of the last decade. Softwood pulpwood demand increased through the 2000s but has remained relatively stable since 2011, with the exception of a peak during 2018 which resulted from an increase in volume generated by salvage operations after hurricane Michael.

Figure 6: Demand for wood products (USFS, TMS)

Figure 6: Demand for wood products (USFS, TMS)

The comparison of average annual growth and removals in the Georgia catchment area is much more tightly balance than in Drax’s other supply regions, as shown in Figure 7. Since 2000 the average annual surplus of growth has been around 3.6 million m3 with both demand and growth increasing in recent years.

Figure 7: Average annual growth, removals and surplus (USFS)

Figure 7: Average annual growth, removals and surplus (USFS)

As shown in Figures 2 & 3, growth rates are strong and inventory is increasing, this is not a problem in the Georgia area.  The relatively small surplus, as compared to other catchment areas in the US South, is due to the higher concentration of wood fibre markets and the more intense forest industry activity in this region.  As of July 2020, there were over 50 major wood-consuming mills operating within the Georgia catchment area and an additional 80+ mills operating within close proximity, overlapping the catchment area.  Total pulpwood demand in 2019 was 12.9 million tons, of which approximately 87% was attributed to non‐bioenergy‐related sources (predominantly pulp/paper) and 13% was attributed to the bioenergy sector.  Given the bio-energy sector’s low ranking position in the market (with the lowest ability to pay for fibre), combined with the relatively small scale in demand compared to the pulp and paper industry, the influence of biomass markets can be considered to be minimal in this region, particular when it comes to impacts on wood prices and forest management practice.

Wood price trends

Pine sawtimber prices suffered a significant decline between 2000 and 2010, dropping almost $21 per ton as a result of the global financial crisis and the decline in demand due to the collapse in housing markets and construction (Table 3).  Since 2010 pine sawtimber has remained relatively stable, with some minor fluctuations shown in Figure 8 below.

Change ($/ton)Pine SawtimberPine Chip-n-sawPine PulpwoodHardwood SawtimberHardwood Pulpwood
2000-2019-$20.92$15.14$5.95$12.55$4.70
2000-2010-$20.92-$21.41$2.11$11.25$5.67
2010-2019$0.00$6.27$3.84$1.30-$0.97
Table 3: Stumpage price trends (TMS)

Pine pulpwood prices have been on a generally increasing trend since 2000, with a more significant increase since 2011.  This increase does not reflect an increase in demand or total volume, which has remained relatively stable over this period, but a shifting of the geographic distribution of the market with some new mills opening and old mills closing, resulting in increased competition in some localised fibre baskets and leading to an overall increase in stumpage price.

Figure 8: Stumpage price trends (TMS)

Figure 8: Stumpage price trends (TMS)

Figure 9 below shows that, with the exception of the hurricane salvage volume in 2018, pulpwood removals have declined or remained relatively stable since 2010, whereas pulpwood stumpage prices increased by 41% from 2010 to 2018.

Figure 9: Pulpwood demand and stumpage price (USFS, TMS)

Figure 9: Pulpwood demand and stumpage price (USFS, TMS)

Comparing this stumpage price trend with other catchment areas of the US South (Figure 10), where Drax sources wood pellets, the Georgia area is on average 35% higher than the next highest area (Chesapeake) and 87% higher than the lowest cost area (Amite Bioenergy in Mississippi).  This price differential is predominantly due to the scale of demand and availability of surplus low-grade fibre.

Figure 10: Comparison of pine pulpwood stumpage prices in Drax supply areas US South (TMS)

Figure 10: Comparison of pine pulpwood stumpage prices in Drax supply areas US South (TMS)

Hood Consulting summary of the impact of the seven pellet plants on key trends and metrics in this catchment area.

Is there any evidence that bioenergy demand has caused the following…

Deforestation?

No. US Forest Service (USFS) data shows a 108,130-hectare (-2.6%) decrease in total timberland in the Georgia catchment area since Georgia Biomass’ first full year of production in 2012. Specifically, this loss in total area of timberland coincided with a more than 21,000-hectare increase in cropland/pastureland and a more than 73,000-hectare increase in urban land and land classified as having other uses.

However, there is little evidence to suggest that increased wood demand from the bioenergy sector has caused this decrease in total timberland. Furthermore, pine timberland – the primary source of roundwood utilized by the bioenergy industry – has increased more than 17,000 hectares in the catchment area since 2016.

A change in management practices (rotation lengths, thinnings, conversion from hardwood to pine)?

No. Changes in management practices have occurred in the catchment area over the last two decades. However, there is little evidence to suggest that bioenergy demand, which accounts for roughly 10-14% of total pulpwood demand (and only 5-7% of total wood demand in the catchment area), has caused or is responsible for these changes.

Clearcuts and thinnings are the two major types of harvests that occur in this region, both of which are long-standing, widely used methods of harvesting timber. TimberMart-South (TMS) data shows that thinnings accounted for 67% of total reported harvest area in the southeast Georgia market from 2000-2010, but only 43% of total harvest area reported from 2012-2019. Specifically, this downward shift was initiated by the bursting of the US housing bubble in the mid-2000s and had been completed by the early 2010s. We’d like to note that this shift coincided with a nearly 50% decrease in pine sawtimber stumpage price from 2006-2012. This is important because the strength of pine sawtimber markets had been a driving force behind timber management decisions in this region in the early and mid-2000s.

Also, contributing to the decreased prevalence of thinnings was the strengthening of pine pulpwood markets in the mid-2000s, as pine pulpwood stumpage prices increased more than 40% in the Georgia catchment area from 2003-2008. So, with sawtimber markets continuing to weaken and pulpwood markets doing just the opposite, the data suggests that many landowners decided to alter their management approach (to take advantage of strong pulpwood markets) and focus on short pulpwood rotations that typically do not utilize thinnings.

Ultimately, the shift in management approach that occurred in this market can be linked to the weakening of one type of timber market and the strengthening of another. In the early and mid-2000s, timber management was focused on sawtimber production – a type of management that utilizes thinnings. However, for more than a decade now, this market has been driven to a large degree by the pulp/paper industry, with a significant portion of the timber management in this area focused on short pulpwood rotations.

Diversion from other markets?

No. Demand for softwood (pine) sawlogs increased an estimated 39% in the Georgia catchment area from 2011-2019. Also, increased bioenergy demand has caused no diversion from other pulpwood markets (i.e. pulp/paper), as pulpwood demand not attributed to bioenergy held steady and remained nearly unchanged from 2012-2017 before increasing in 2018 and 2019 due to the influx of salvage wood brought about by Hurricane Michael.

We’d like to make special note that increased demand for softwood sawlogs since 2011 has not resulted in a full pine sawtimber (PST) stumpage price recovery in this market. Reduced demand for softwood sawlogs in the late 2000s and early 2010s resulted in oversupply, and this oversupply has remained, despite increased demand the last 6-8 years. As a result, PST stumpage prices have held steady and averaged roughly $30 per ton in the catchment area since 2013 – down approximately 35% from the 2000-2006 average of more than $46 per ton, but up roughly 15% from the 2011-2012 average of approximately $26 per ton.

An unexpected or abnormal increase in wood prices?

No / Inconclusive. The delivered price of pine pulpwood (PPW) – the primary roundwood product consumed by both Georgia Biomass and Fram – increased 26% in the Georgia catchment area over the six years directly following the startup of Georgia Biomass, increasing from $29.16 per ton in 2011 to $36.63 per ton in 2017. And while this 26% increase in delivered PPW price coincided with a roughly 1.1 million metric ton increase in annual pine pulpwood demand from Georgia Biomass and Fram, total demand for pine pulpwood (from both bioenergy and other sources) actually decreased 7% over this period. Moreover, evidence suggest that this increase in PPW price is more closely linked to changes in wood supply, specifically, the 9% decrease in PPW inventory from 2011-2017.

However, there is evidence that links increased demand from the bioenergy sector to an increase in secondary residual (i.e. sawmill chips, sawdust, and shavings) prices. Specifically, the price of pine sawmill chips – a residual feedstock utilized by the bioenergy industry for wood pellet production – held steady and averaged approximately $26 per ton in the Georgia catchment area from 2008-2012. However, from 2012-2016, pine sawmill chip prices increased more than 15% (to $29.55 per ton in 2016). This increase in price coincided with annual pine residual feedstock purchases by Georgia Biomass and Fram increasing from roughly 325,000 metric tons to nearly 1.0 million metric tons over this period. However, note that pine sawmill chip prices have held steady and averaged roughly $29.50 per ton in the catchment area since 2016, despite further increases in pine secondary residual purchases by Georgia Biomass and Fram (to more than 1.2 million metric tons in 2019).

Ultimately, the data suggests that any excess supply of pine secondary residuals in the catchment area was absorbed by the bioenergy sector in the early and mid-2010s, and the additional demand/competition placed on this market led to increased residual prices. However, the plateauing of residual prices since 2015 along with the continued increase in secondary residual purchases by Georgia Biomass and Fram further suggest that an increasing percentage of secondary residual purchases by the bioenergy sector is sourced from outside the catchment area. Specifically, Fram confirmed this notion, noting that 35-40% of its secondary residual purchases come from outside the Georgia catchment area (from six different states in the US South).

A reduction in growing stock timber?

No. Total growing stock inventory in the catchment area increased 11% from 2011 through 2018, the latest available. Specifically, over this period, inventories of pine sawtimber and chip-n-saw increased 35% and 13%, respectively. However, pine pulpwood inventory decreased 11% from 2011-2018.

Note that the decrease in pine pulpwood inventory was not due to increased demand from bioenergy (or other sources) or increased harvesting above the sustainable yield capacity of the forest area – as annual growth of pine pulpwood has exceeded annual removals every year since 2011. Rather, this decrease can be linked to the 24% decline in pine sawtimber removals that occurred from 2005-2014 (due to the bursting of the US housing bubble and Great Recession that followed). In this region, timber is typically harvested via clearcut once it reaches maturity (i.e. sawtimber grade), after which the stand is reestablished, and the cycle repeated. However, with the reduced harvest levels during this period also came a reduction in newly reestablished timber stands – the source of pine pulpwood. So, with less replantings occurring during this period, inventories of pine pulpwood were not replenished to the same degree they had been previously, and therefore this catchment area saw a reduction in pine pulpwood inventory levels.

However, according to the US Forest Service, annual removals of pine sawtimber have increased 50% in the Georgia catchment area since 2014, which would suggest higher clearcut levels and increased stand reestablishment. TimberMart-South data also supports this assertion, as clearcut harvests have constituted approximately 60% of the total harvest area reported to TimberMart-South in this region since 2014, compared to 40% from 2005-2014. Ultimately, these increases in clearcut (and stand reestablishment) levels may not be reflected in increased pine pulpwood inventory levels in the short term – as it can take more than 10 years for a pine seedling to become merchantable and reach the minimum diameter requirements to be classified as pulpwood. However, adequate supply levels are expected to remain in the meantime. Furthermore, pine pulpwood inventory levels are expected to increase in the mid-to-long terms as a result of the increased harvest levels and stand reestablishment levels that have occurred in the catchment area since 2014.

A reduction in the sequestration rate of carbon?

No / Inconclusive. US Forest Service data shows the average annual growth rate of total growing stock timber has remained nearly unchanged (holding between 6.0% and 6.1%) in the catchment area since 2011, which would suggest that the sequestration rate of carbon has also changed very little in the catchment area the last 8-10 years. However, the 11% increase in total growing stock inventory since 2011 does indicate that total carbon storage levels have increased in the Georgia catchment area since Georgia Biomass commenced operations in this market.

An increase in harvesting above the sustainable yield capacity of the forest area?

No. Growth-to-removals (G:R) ratios, which compare annual timber growth to annual harvests, provides a measure of market demand relative to supply as well as a gauge of market sustainability. In 2018, the latest available, the G:R ratio for pine pulpwood, the predominant timber product utilized by the bioenergy sector, equaled 1.06 (a value greater than 1.0 indicates sustainable harvest levels). Note, however, that the pine pulpwood G:R ratio averaged 1.44 from 2012-2017. The significant drop in 2018 was due to a 31% increase in removals (due to Hurricane Michael) and is not reflective of the new norm. Specifically, pine pulpwood removals are projected to be more in line with pre-2018 levels in 2019 and 2020, and so too is the pine pulpwood G:R ratio.

Timber growing stock inventory

Neutral. According to USFS data, inventories of pine pulpwood decreased 11% in the catchment area from 2011-2018. However, that decrease was not due to increased demand from bioenergy. Typically, a reduction in inventory is linked to harvest levels above the sustainable yield capacity of the forest area, but in this case, annual growth of pine pulpwood exceeded annual removals every year during this period.

Ultimately, the decrease in pine pulpwood inventory from 2011-2018 can be linked to decreased pine sawtimber production beginning in the mid-2000s. Specifically, annual removals of pine sawtimber decreased 24% from 2005-2014, and the reduction in harvest levels during this period meant fewer new pine stands were reestablished, and that has led to the current reduction in pine pulpwood inventory. (Note that the decrease in pine sawtimber removals from 2005-2014 was mirrored by a 27% increase in pine sawtimber inventory over this same period). However, USFS data shows that annual removals of pine sawtimber have increased 50% in the Georgia catchment area since 2014, which suggests that pine pulpwood inventory levels will start to increase in the catchment area due to increased harvest levels and the subsequent increase in stand reestablishment levels.

Timber growth rates

Neutral. Timber growth rates have increased for both pine sawtimber and pine chip-n-saw but decreased slightly for pine pulpwood in the catchment area since 2011. Evidence suggests that this decrease in pine pulpwood growth rate is not due to increases in bioenergy demand, but rather linked to changes in diameter class distribution and indicative of a forest in a state of transition, where timber is moving up in product class (i.e. pine pulpwood is moving up in classification to pine chip-n-saw).

Forest area

Neutral. In the Georgia catchment area, total forest area (timberland) decreased more than 115,000 hectares (-2.8%) from 2011 through 2018. Note that this decrease coincided with a roughly 19,000-hectare increase in cropland and 93,000-hectare increase in urban land and land classified as having other uses.

Specifically, pine timberland, the primary source of roundwood utilized by the bioenergy industry, decreased over 34,000 hectares from 2011-2016. However, from 2016-2018, pine timberland stabilized and rather increased more than 17,000 hectares in the catchment area (or a net decrease of roughly 17,000 hectares from 2011-2018). Ultimately, there is little evidence that the decrease in pine timberland from 2011-2016 or increase since 2016 is linked to increased bioenergy demand. Rather, the overall decrease in pine timberland since 2011 appears to be more closely linked to the relative weakness of pine sawtimber markets in the Georgia catchment area and the lack of return from sawtimber.

Wood prices

Positive / Negative. Intuitively, an increase in demand should result in an increase in price, and this is what the data shows in the Georgia catchment area as it relates to increased biomass demand from Georgia Biomass and Fram and the prices of the various raw materials consumed by these mills. Specifically, the 1.4-million metric ton increase in softwood pulpwood demand attributed to Georgia Biomass and Fram coincided with a 20% increase in delivered pine pulpwood price and a 10-15% increase in pine chip prices from 2011-2015. Since 2015, biomass demand has held relatively steady, and, overall, so too have delivered pine pulpwood and pine chip prices. The apparent link between increased bioenergy demand and increased pine raw material prices is supported further by statistical analysis, as strong positive correlations were found between softwood biomass demand and both delivered pine pulpwood and pine chip prices. However, note that biomass demand alone is not responsible for these changes in prices, as softwood biomass demand accounts for only 10-15% of total softwood pulpwood demand in the catchment area. Rather, the prices of these raw materials are impacted to a larger degree by demand from other sources (i.e. pulp/paper), which accounts for 85-90% of total softwood pulpwood demand in the Georgia catchment area.

On the other hand, it’s also important to note that the increase in bioenergy-related wood demand has been a positive for forest landowners in the Georgia catchment area. Not only has bioenergy provided an additional outlet for pulpwood in this market, but the increase in pulpwood prices as a result of increased pulpwood demand has transferred through to landowners (improved compensation). Specifically, since 2015, pine pulpwood (PPW) stumpage price – the price paid to landowners – has averaged more than $17 per ton in the Georgia catchment area. This represents a 70% increase over the approximately $10 per ton averaged by PPW stumpage in the catchment area over the last five years prior to Georgia Biomass’ startup in 2Q 2011.

(Note: Pine pulpwood stumpage prices are notably higher in the Georgia catchment area due to a much tighter balance in supply and demand (in comparison to most other markets across the US South). For instance, in all other areas across the US South2, PPW stumpage prices have averaged less than $9 per ton since 2015, or roughly half that of prices in the Georgia catchment area).

Markets for solid wood products

Positive. In the Georgia catchment area, demand for softwood sawlogs used to produce lumber and other solid wood products increased an estimated 39% from 2011-2019, and by-products of the sawmilling process are sawmill residuals – materials utilized by Georgia Biomass and the Fram mills to produce wood pellets. With the increased production of softwood lumber, so too has come an increase in sawmill residuals, some of which have been purchased/consumed by Georgia Biomass and Fram. Not only have these pellet producers benefited from the greater availability of this by-product, but lumber producers have also benefited, as the Georgia Biomass and Fram mills have provided an additional outlet for these producers and their by-products.

Read the full report: Georgia Biomass Catchment Area Analysis.

This is part of a series of catchment area analyses around the forest biomass pellet plants supplying Drax Power Station with renewable fuel. Others in the series include: ChesapeakeEstonia, Latvia and Drax’s own, other three mills LaSalle BionergyMorehouse Bioenergy and Amite Bioenergy.