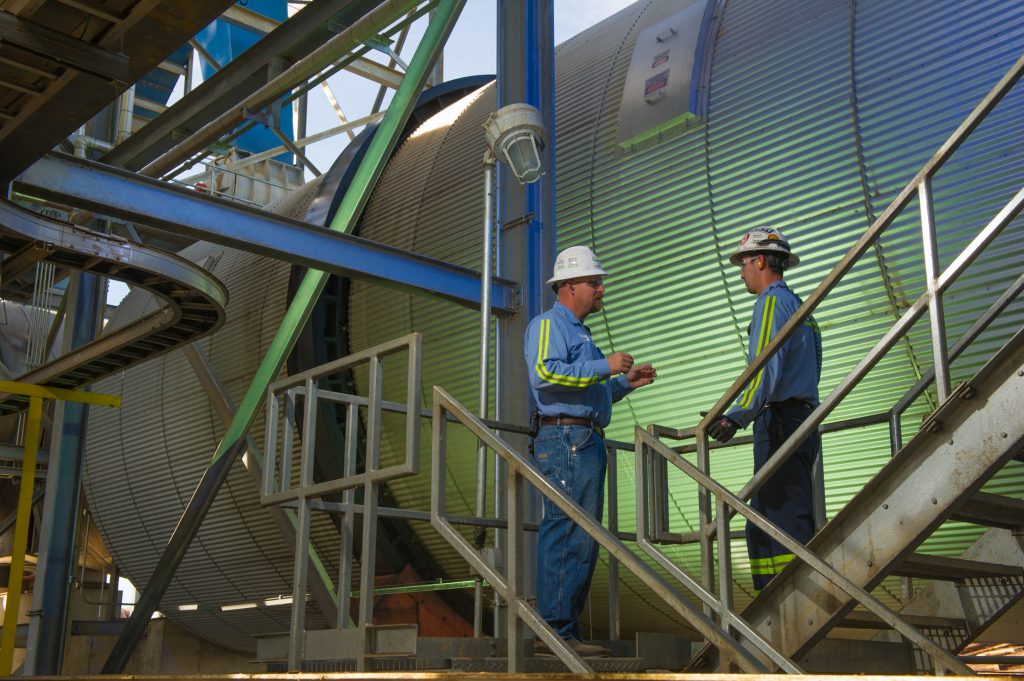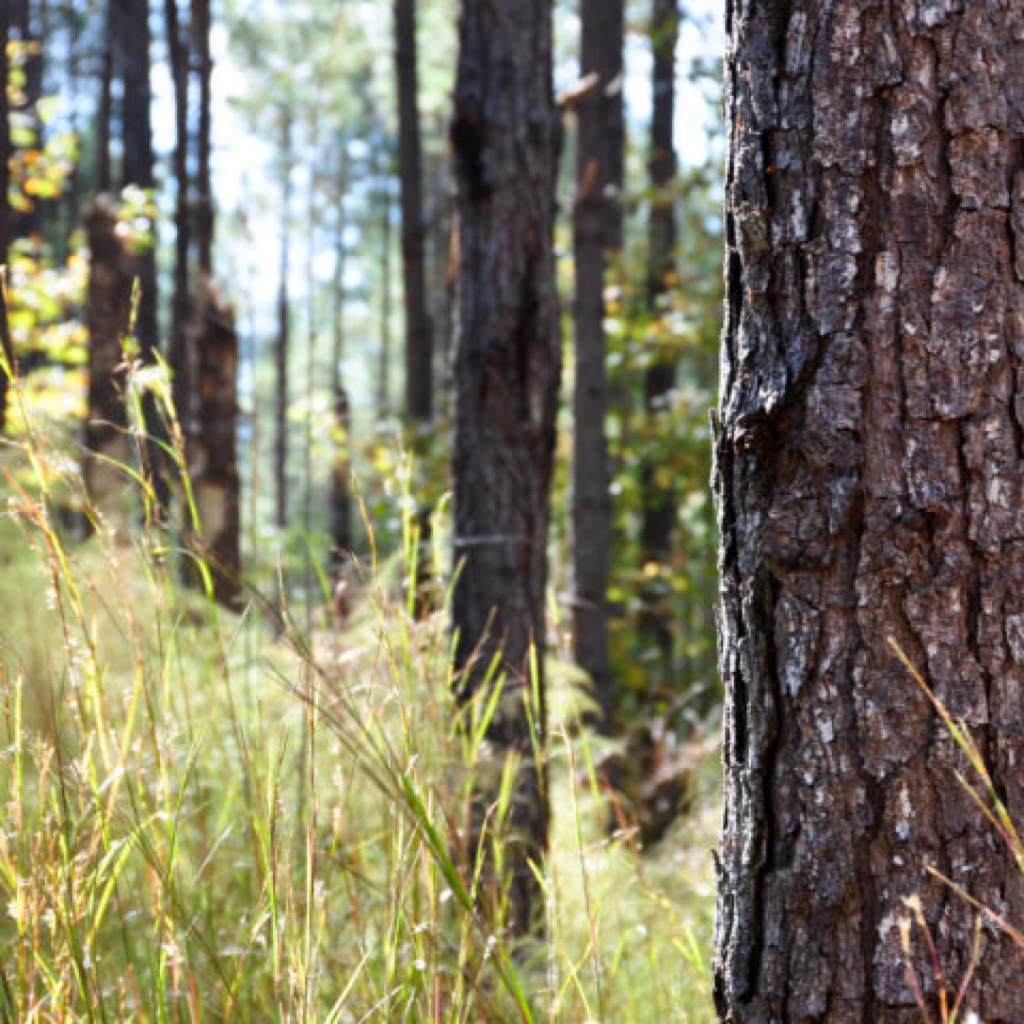
The landscape of the Amite catchment area in Mississippi is dense with forests. They cover 84% of the area and play a crucial role in the local economy and the lives of the local population.
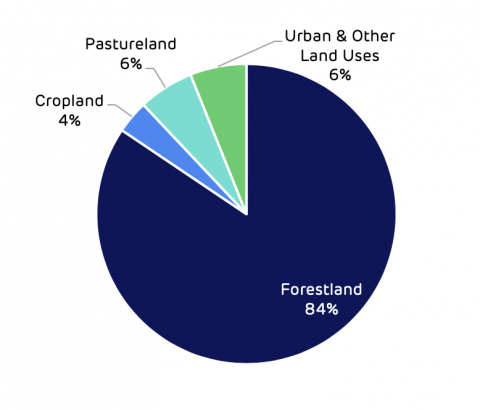
Amite BioEnergy catchment area – land area distribution by land classification & use (2017)
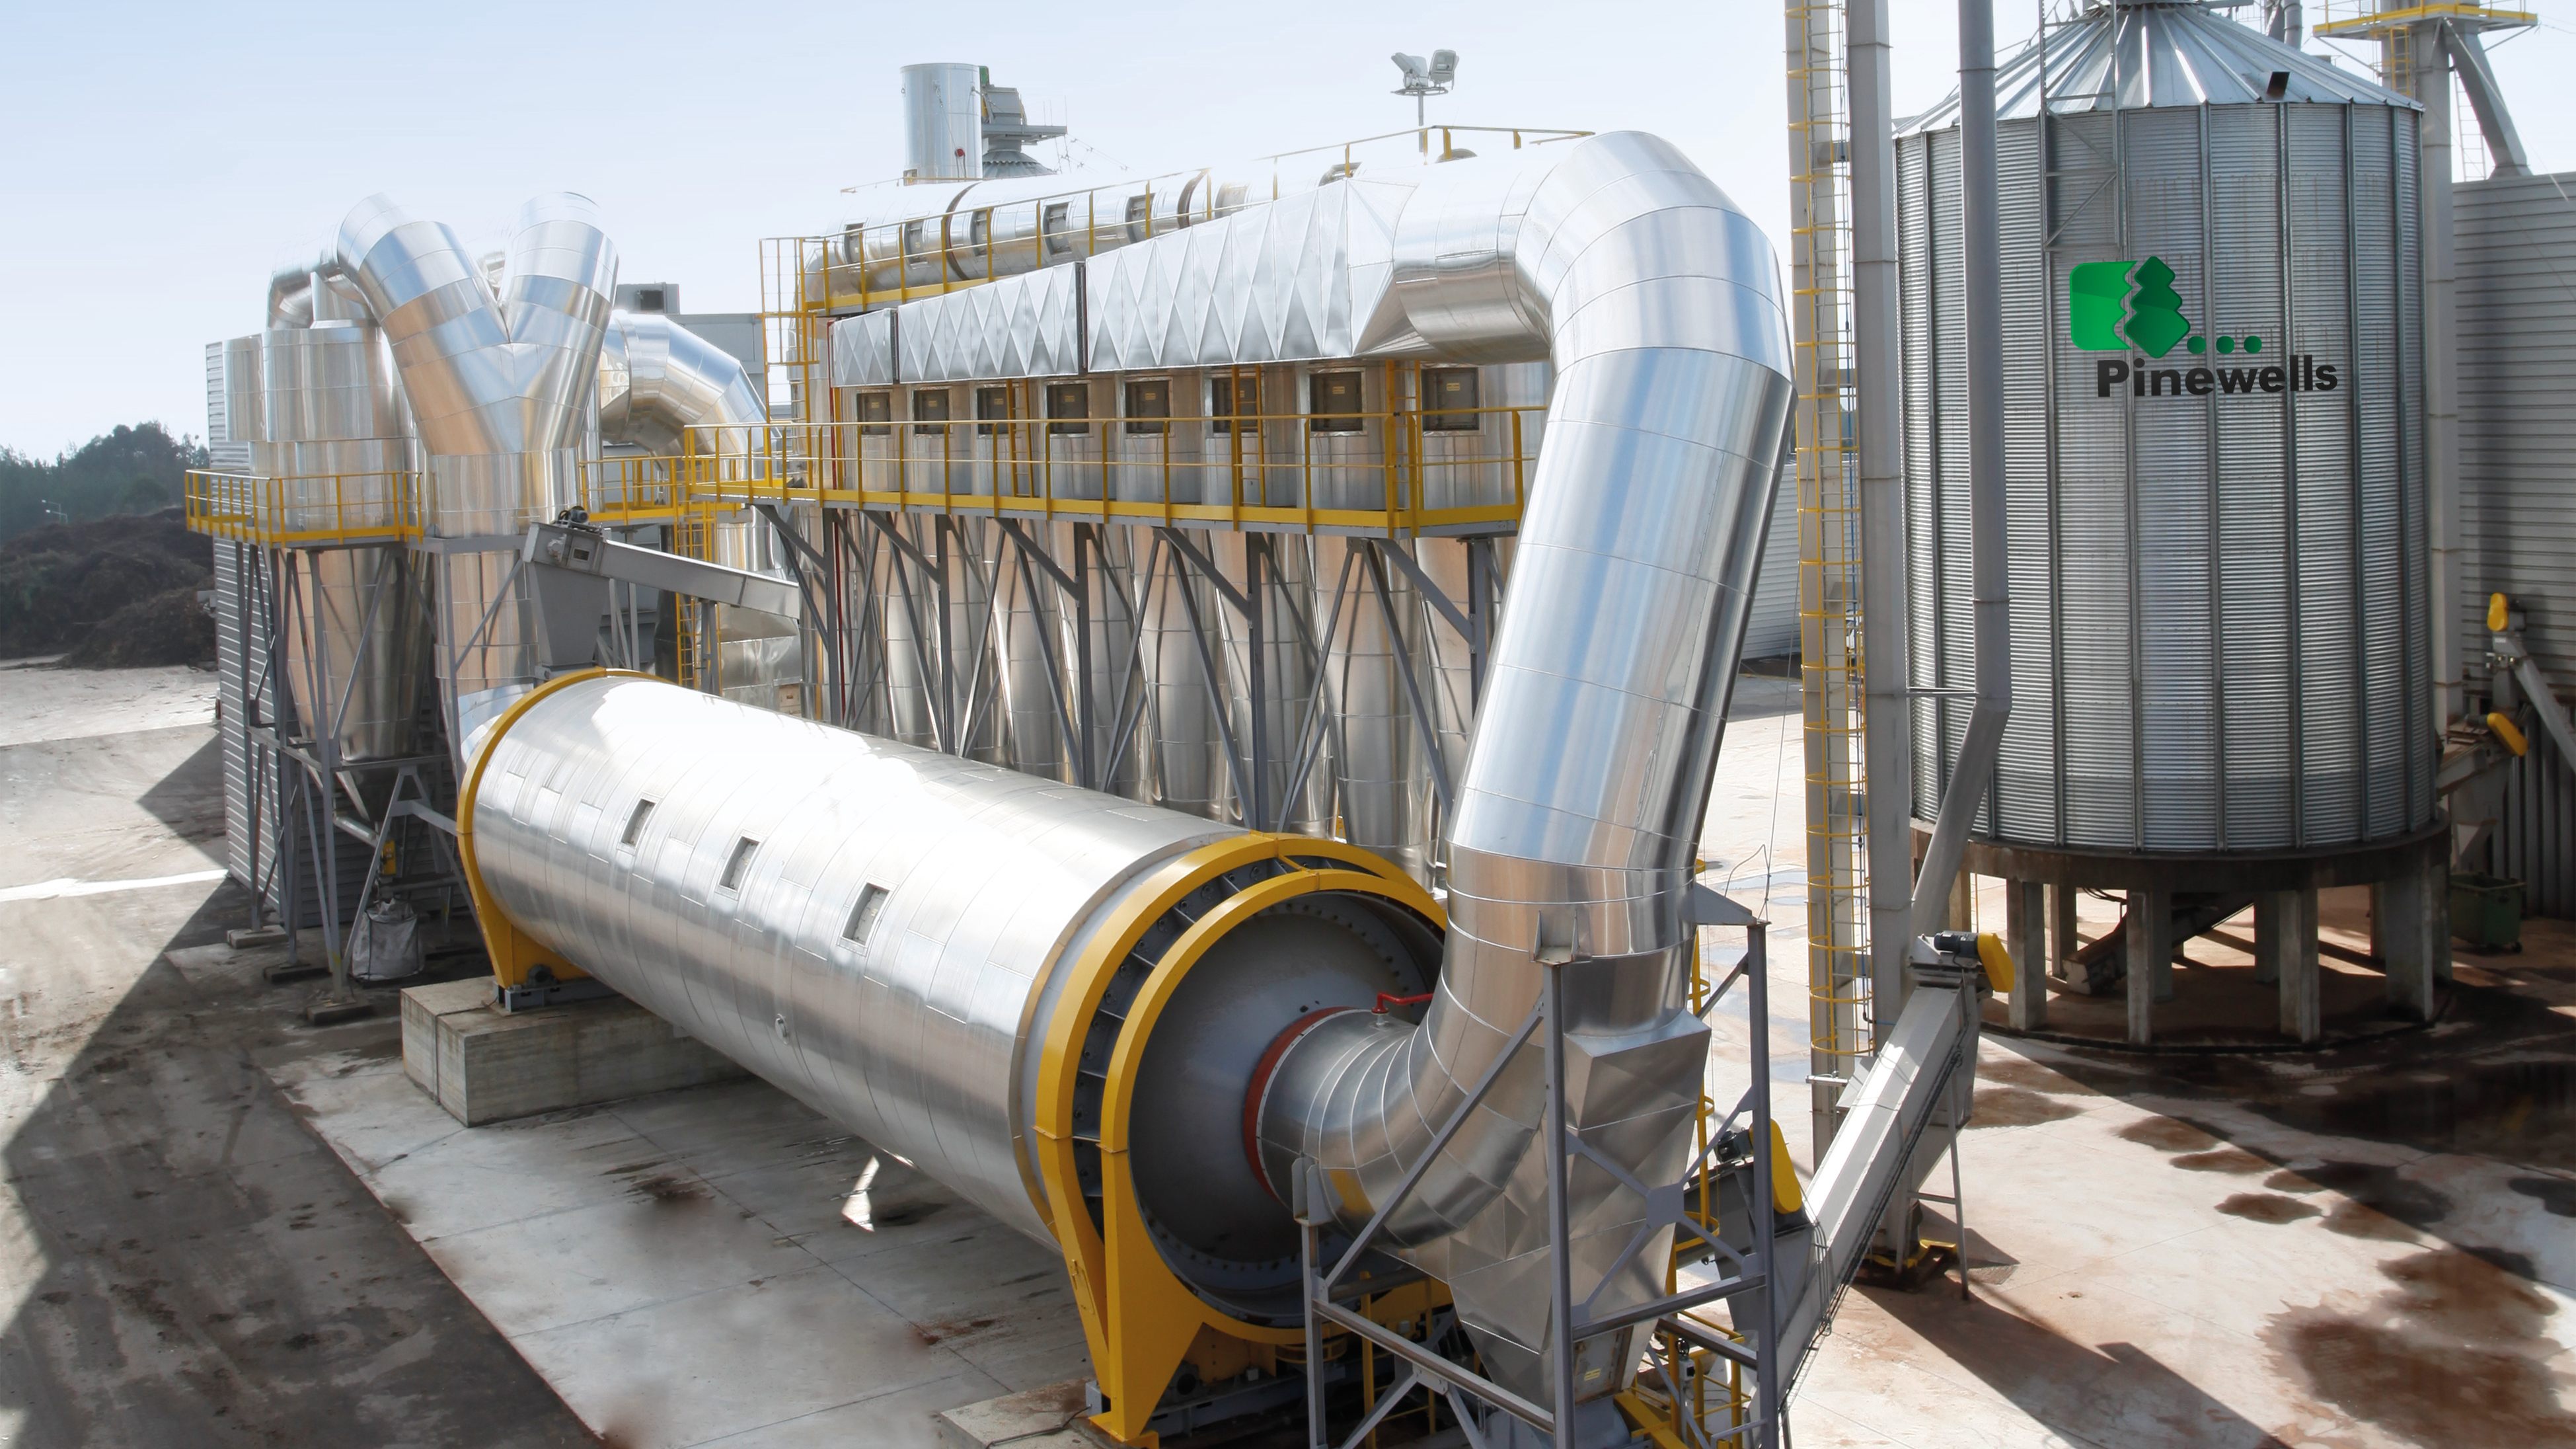
On the state’s western border with Louisiana, near the town of Gloster, Drax’s Amite BioEnergy pellet mill is an important part of this local economy, providing employment and creating a market for low-grade wood.
Amite produces half-a-million metric tonnes of wood pellets annually that not only benefit the surrounding area, but also make a positive impact in the UK, providing a renewable, flexible low carbon source of power that could soon enable carbon negative electricity generation.
However, this is only possible if the pellets are sourced from healthy and responsibly managed forests. That’s why it’s essential for Drax to regularly examine the environmental impact of the pellet mills and their catchment areas to, ultimately, ensure the wood is sustainably sourced and never contributes to deforestation or other negative climate and environment impacts.
In the first of a series of reports evaluating the areas Drax sources wood from, Hood Consulting has looked at the impact of Amite on its surrounding region. The scope of the analysis had to be objective and impartial, using only credible data sources and references. The specific aim was to evaluate the trends occurring in the forestry sector and to determine what impact the pellet mill may have had in influencing those trends, positively or negatively. This included the impact of harvesting levels, carbon stock and sequestration rate, wood prices and the production of all wood products.
The report highlights the positive role that the Amite plant has had in the region, supporting the health of western Mississippi’s forests and its economy.
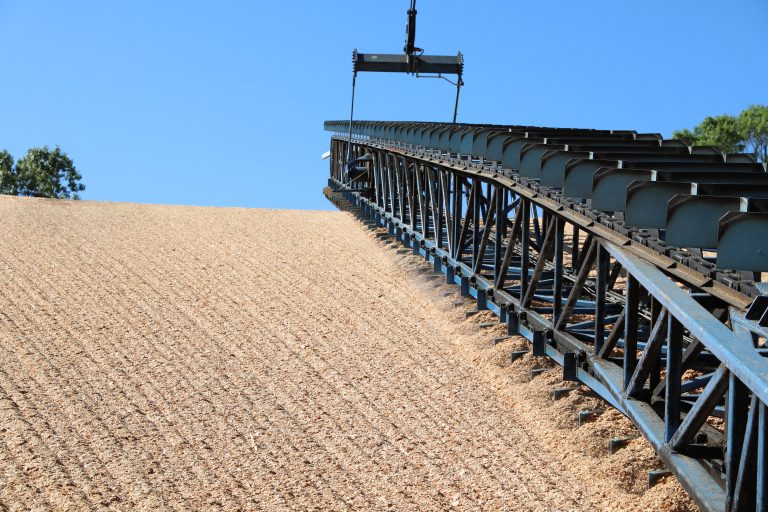
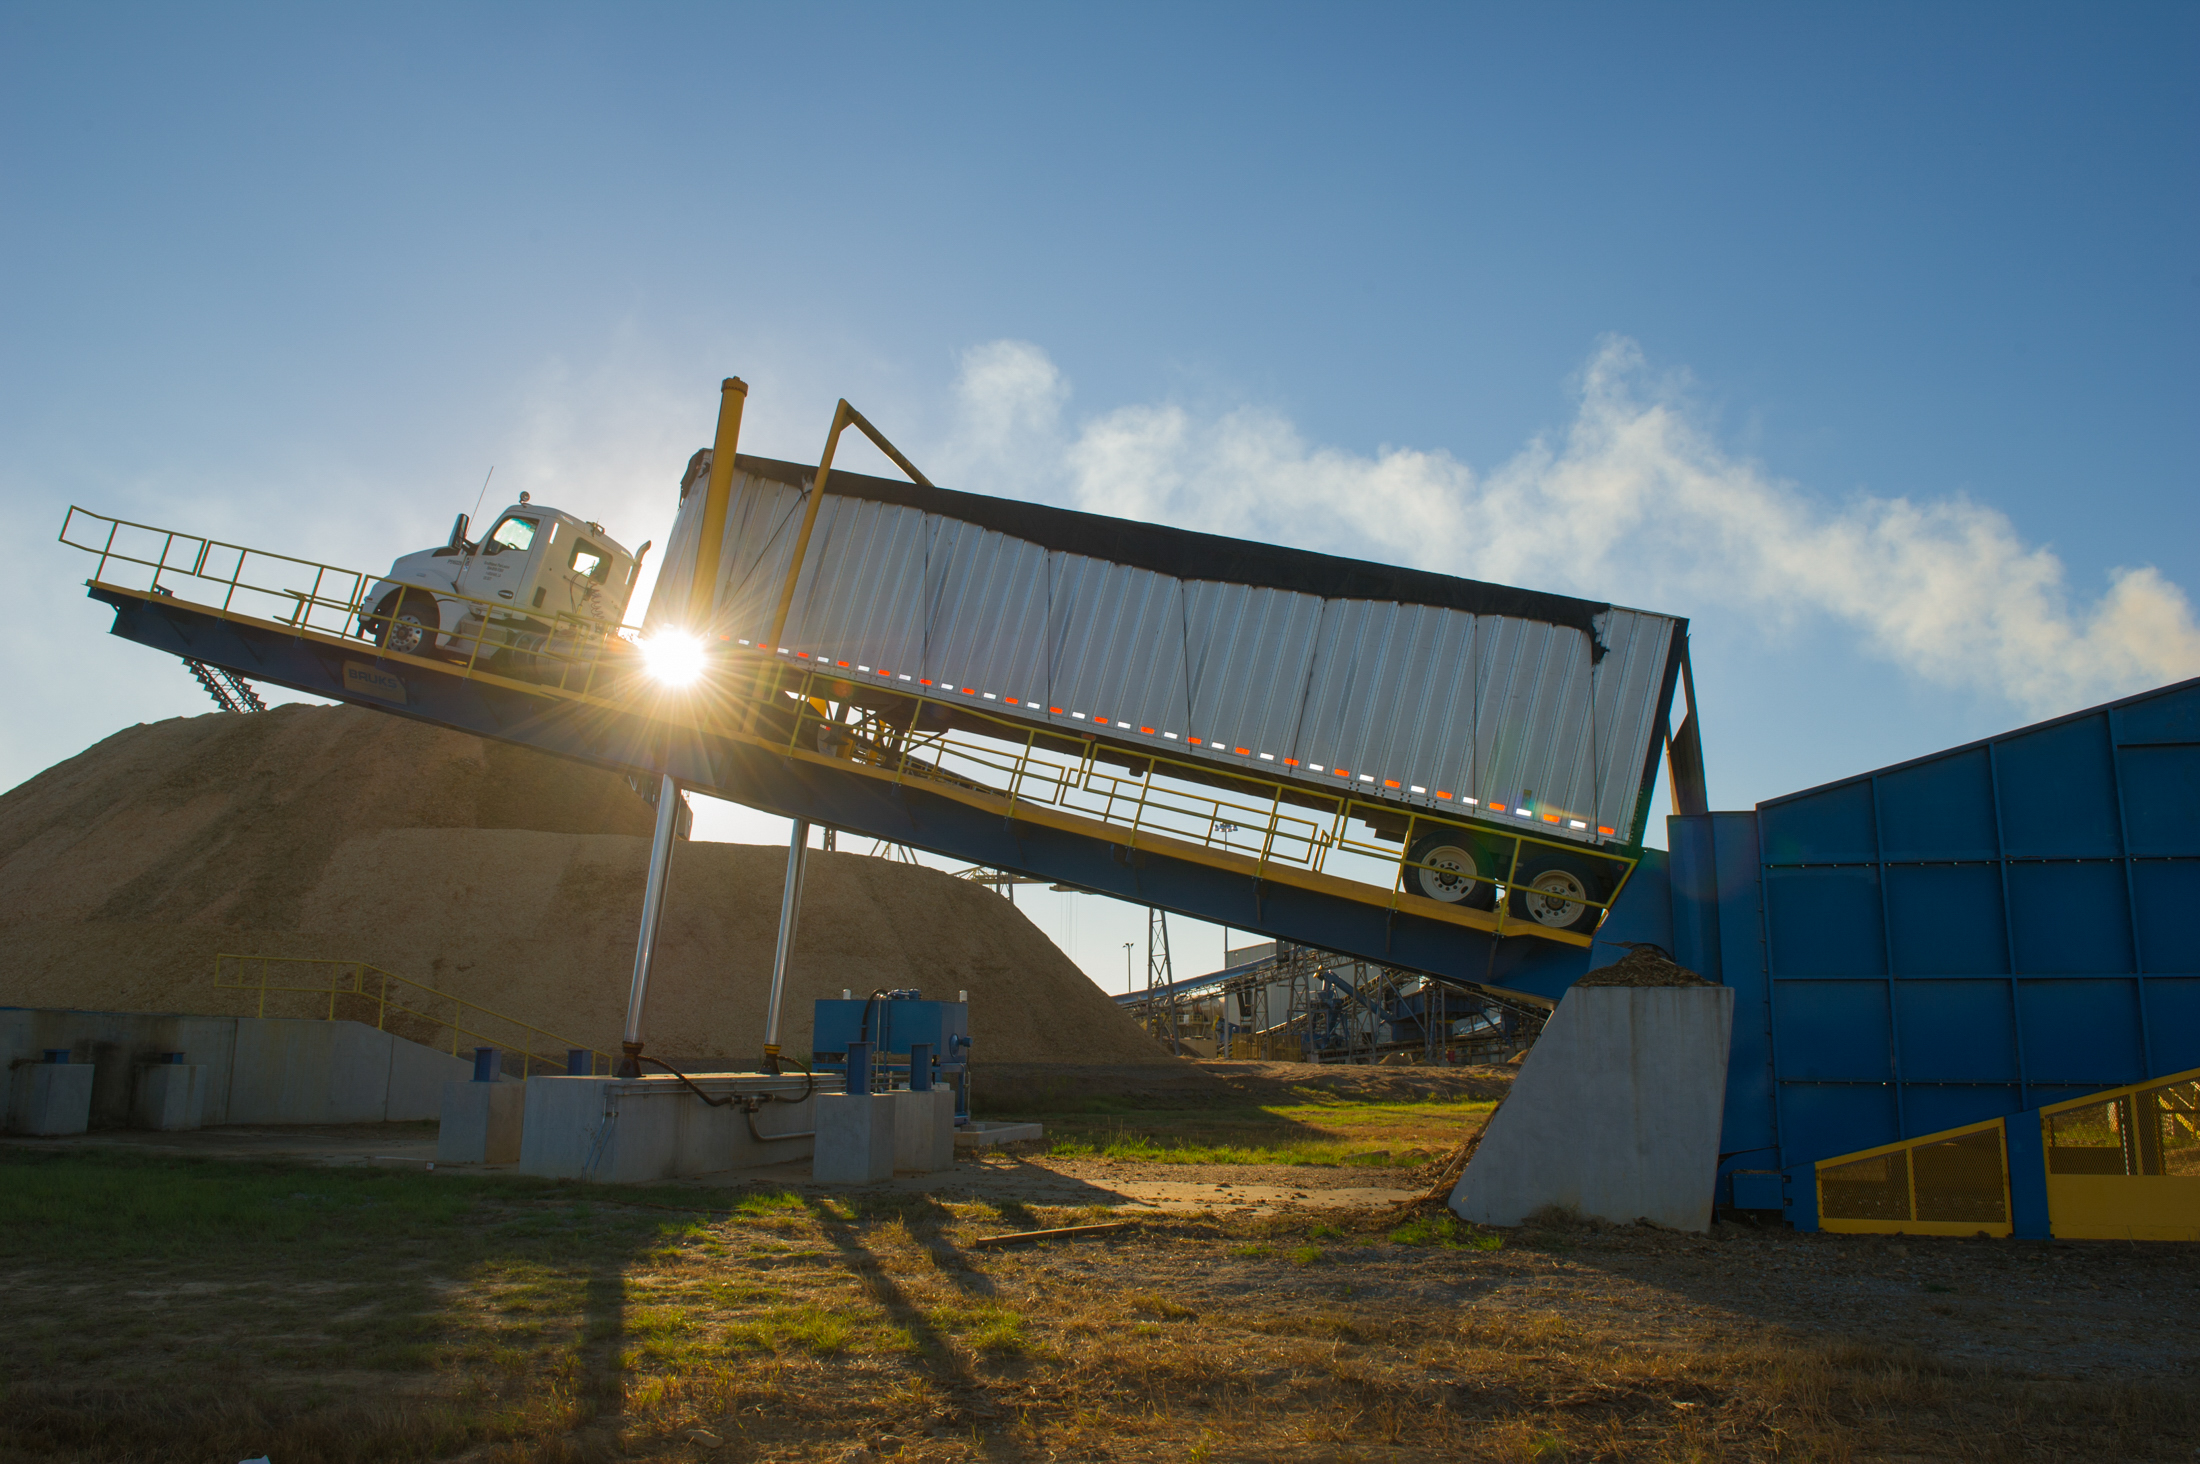
Woodchip pile at Amite BioEnergy (2017)
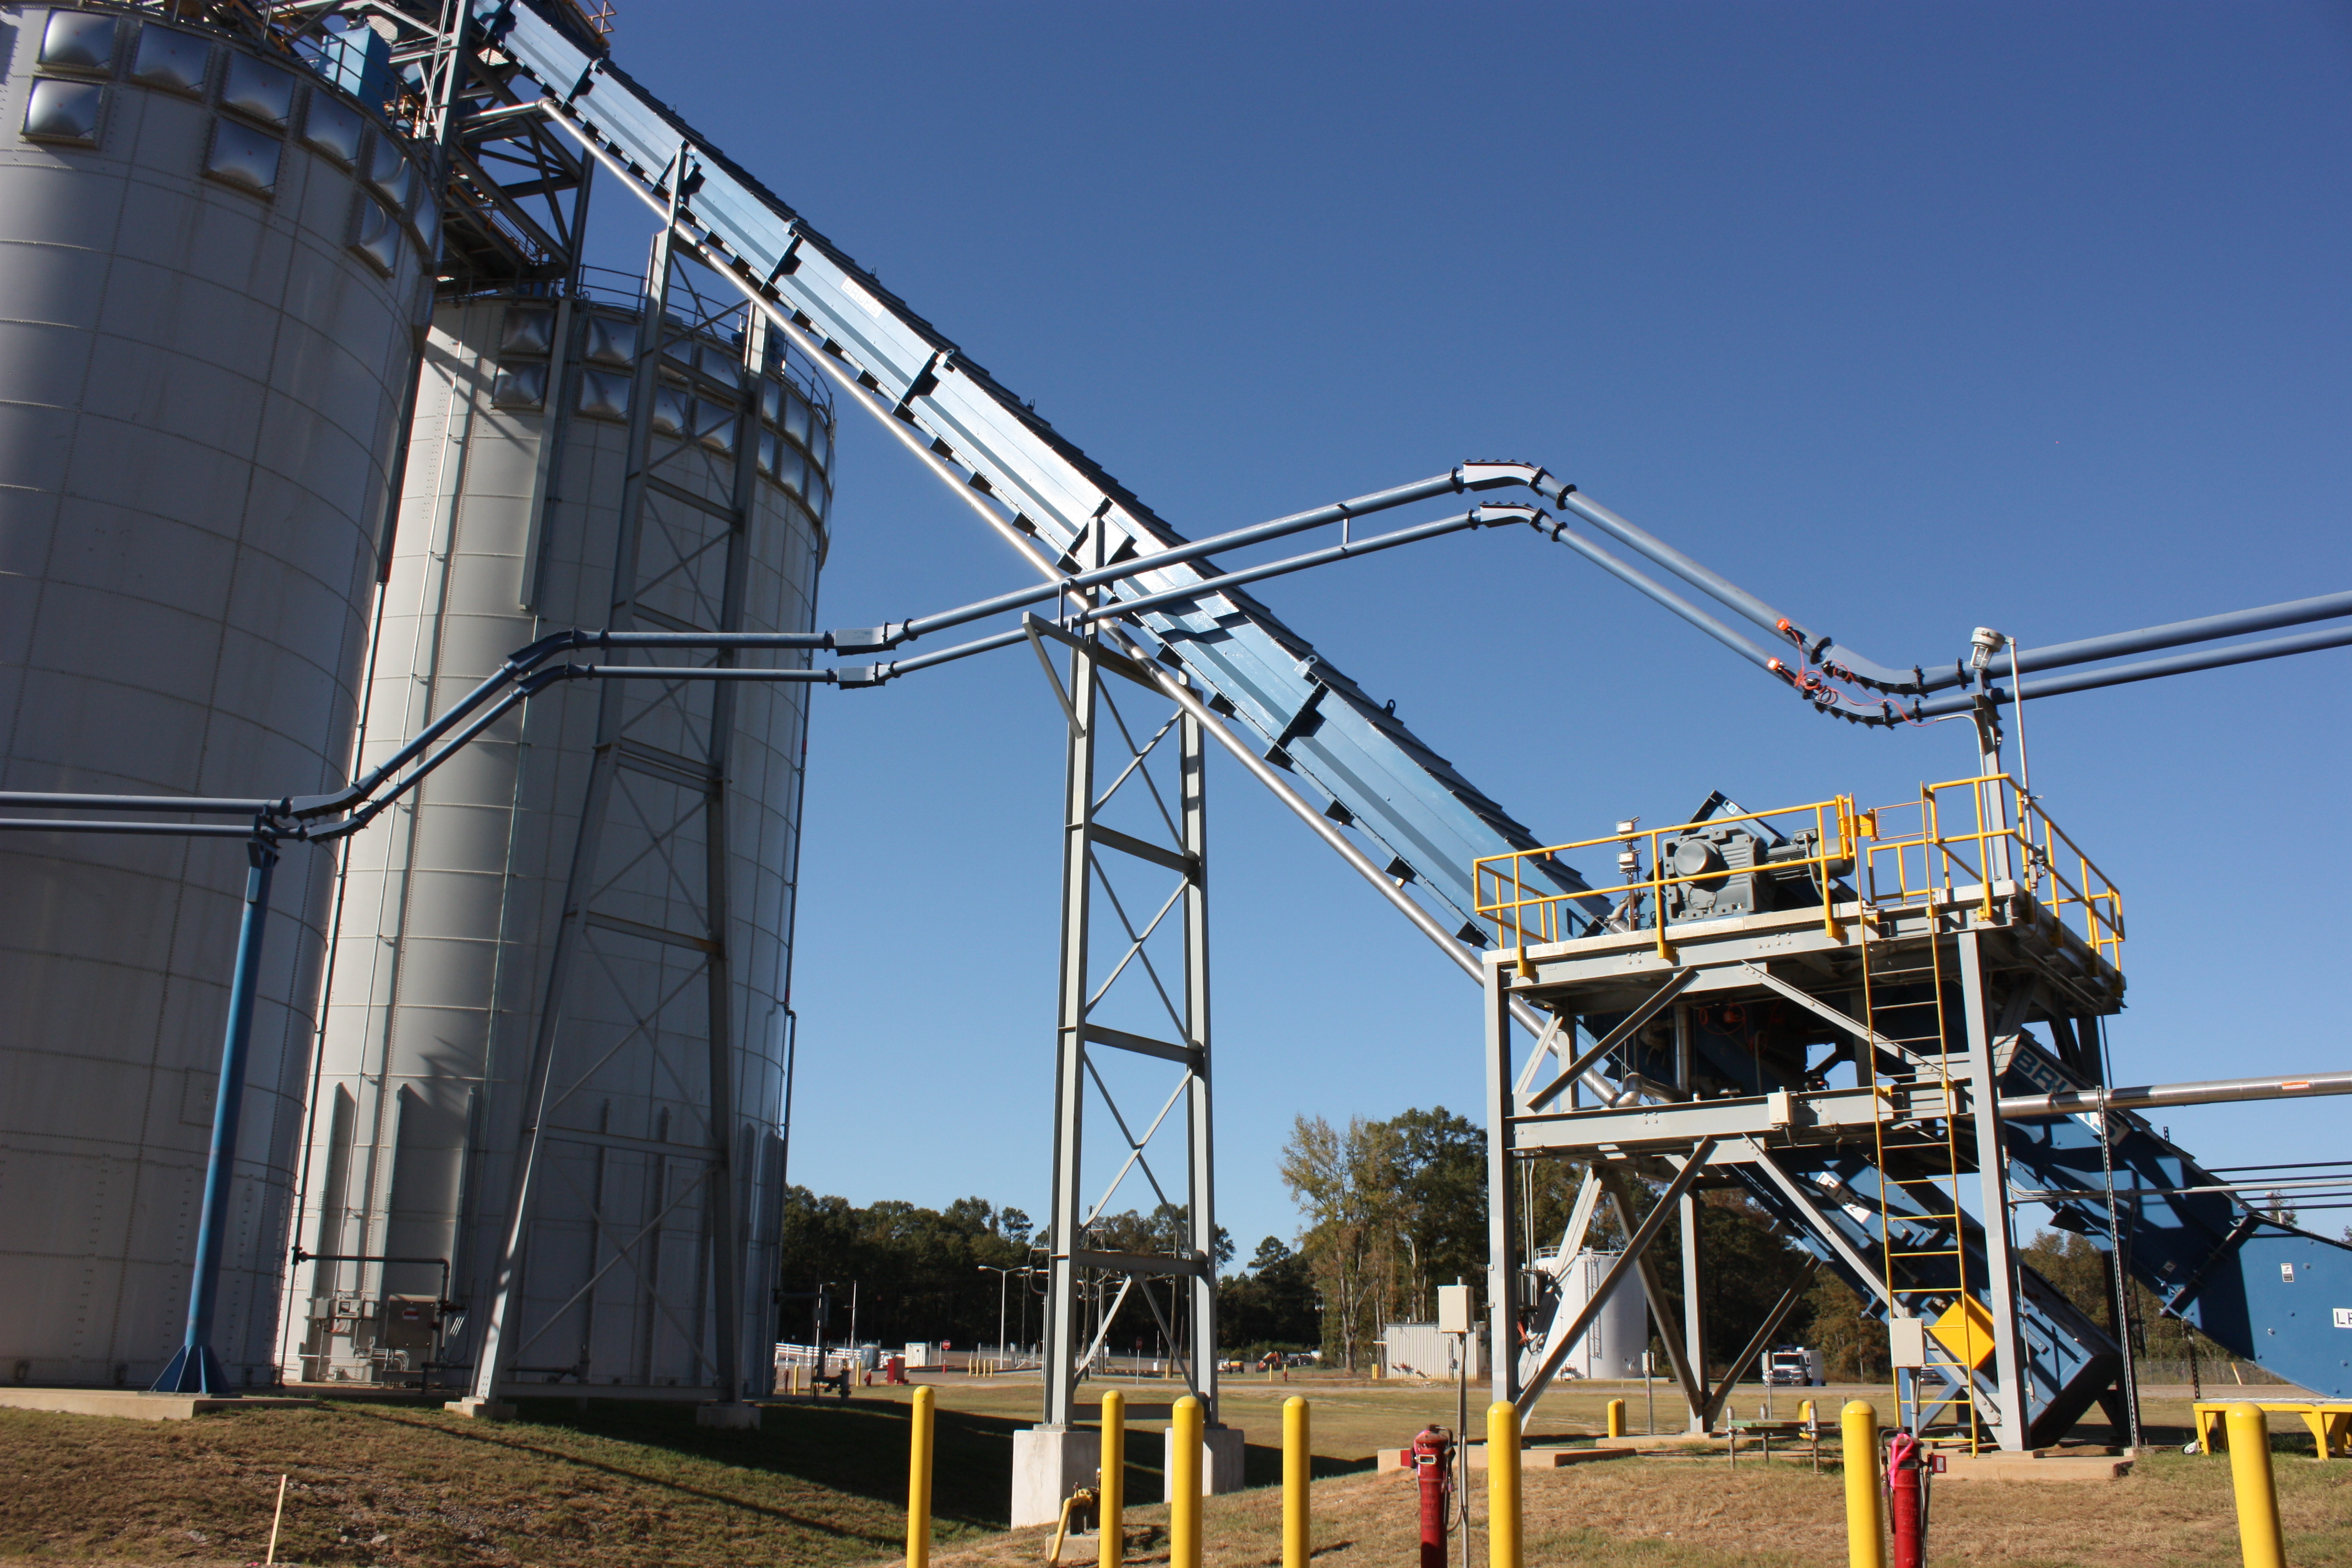
The landscape of the Amite BioEnergy wood pellet plant
Amite BioEnergy’s catchment area – the working forest land from which it has sourced wood fibre since it began operating – stretches roughly 6,600 square kilometres (km2) across 11 counties – nine in Mississippi and two in Louisiana.
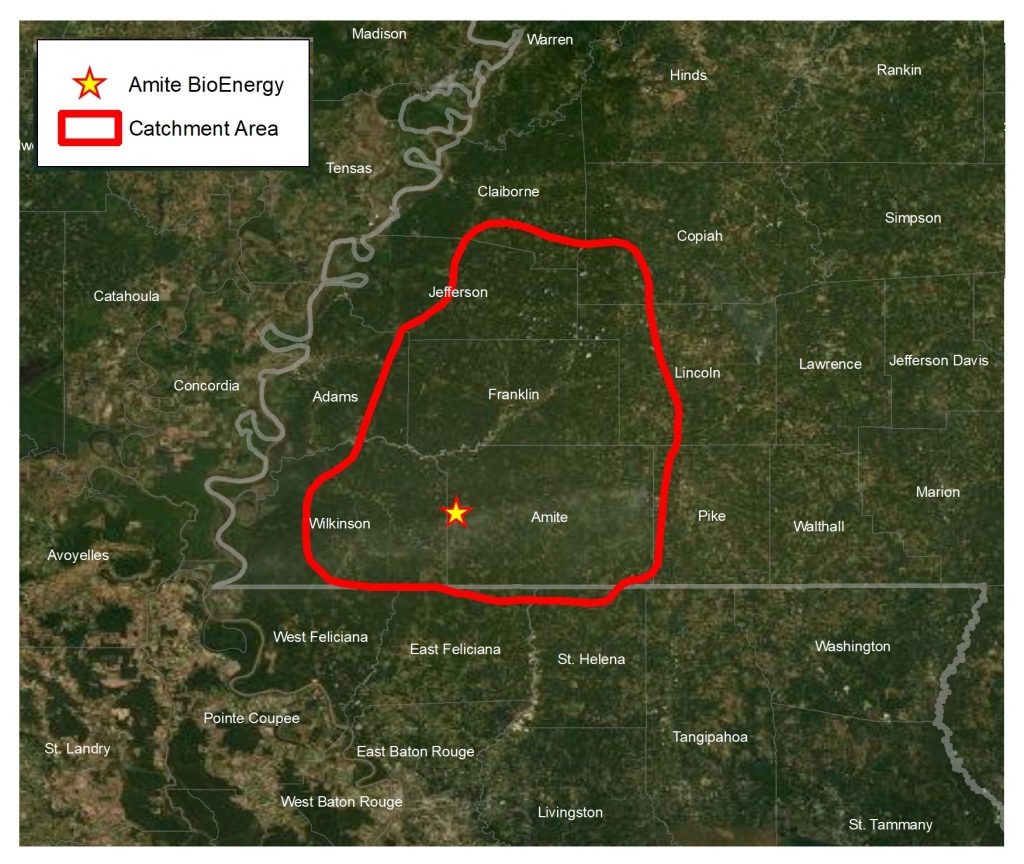
Amite BioEnergy catchment area boundary
US Forest Service data shows that since 2014, when Amite began production, total timberland in this catchment area has in fact increased by more than 5,200 hectares (52 million m2).
An increase in market demand for wood products, particularly for sawtimber, can be one of the key drivers for encouraging forest owners to plant more trees, retain their existing forest or more actively manage their forests to increase production.
Markets for low grade wood, like the Amite facility, are essential for enabling forest owners to thin their crops and generate increased revenue as a by-product of producing more saw-timber.
Around 30% of the annual timber growth in the region is pine pulpwood, a lower-value wood which is the primary source of raw material used at Amite. More than 60% of the growth is what is known as sawtimber – high-value wood used as construction lumber or furniture, or chip n saw (also used for construction and furniture).
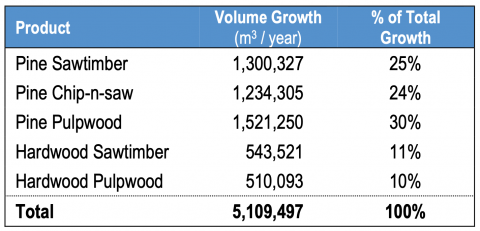
Amite BioEnergy catchment area – net growth of growing stock timber by major timber product. Source: USDA – US Forest Service.
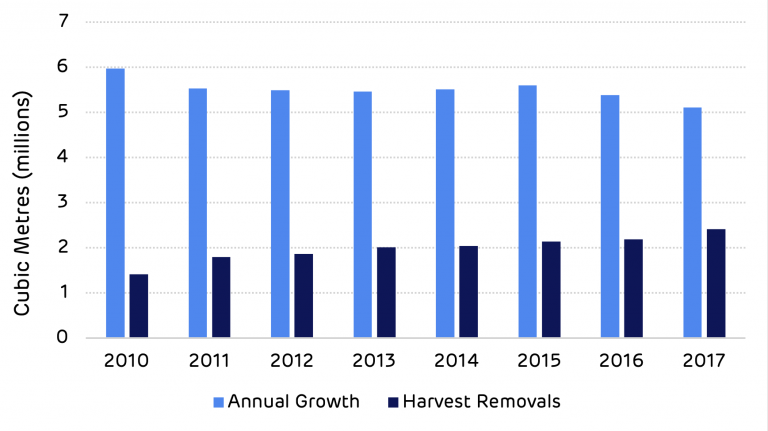
The analysis shows that harvesting levels in each product category are substantially lower than the annual growth (as shown in the table below). This means that every year a surplus of growth remains in the forest as stored carbon.
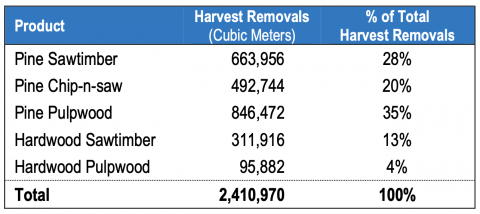
Amite BioEnergy catchment area – harvest removals by major timber product (2017). Source: USDA – US Forest Service.
In 2017, total timber growth was 5.11 million m3 while removals totalled 2.41 million m3 – less than half of annual growth. Of that figure, the pine pulpwood used to make biomass pellets grew by 1.52 million m3 while just 850 thousand m3 was removed.
The table below shows the ratio of removals to growth in the pine forests around Amite. A ratio of 1 is commonly considered to be the threshold for sustainable harvesting levels, in this catchment area the ratio is more than double that amount, meaning that there is still a substantial surplus of annual growth that has not been harvested.

Amite BioEnergy catchment area – annual growth, removals & growth-to-removal ratios by major timber product (2017). Source: USDA – US Forest Service.
Between 2010 and 2017 the total stock of wood fibre (or carbon) growing in the forests around Amite increased by more than 11 million m3. This is despite a substantial increase in harvesting demand for pulpwood.
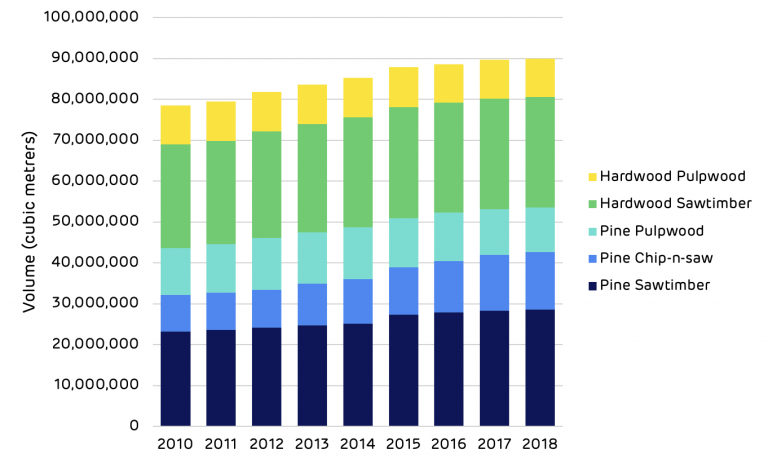
Timber inventory by major timber product (2010-2017); projected values (2018)
The economic argument for sustainability
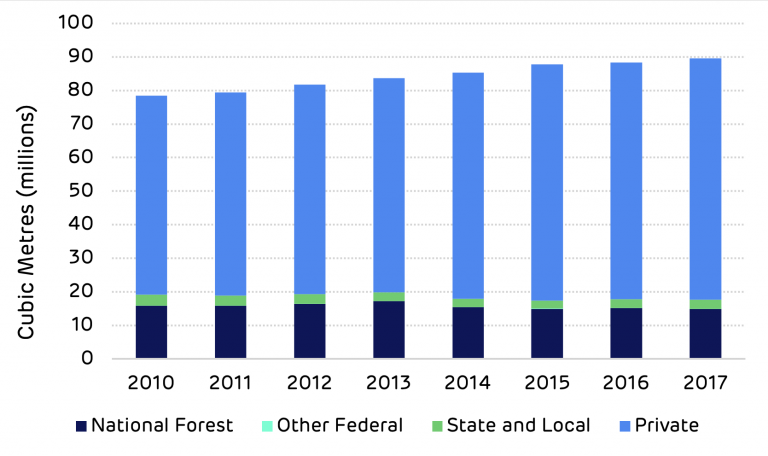
The timberland of the Amite BioEnergy catchment area is 85% privately owned. Among the tens of thousands of smaller private landowners are larger landowners like forestry business Weyerhaeuser; companies that manage forest land on behalf of investors like pension funds; and private families. For these private owners, as long as there are healthy markets for forest products forests have an economic value. Without these markets some owners may choose to convert their forest to other land uses (e.g. for urban development or agriculture).
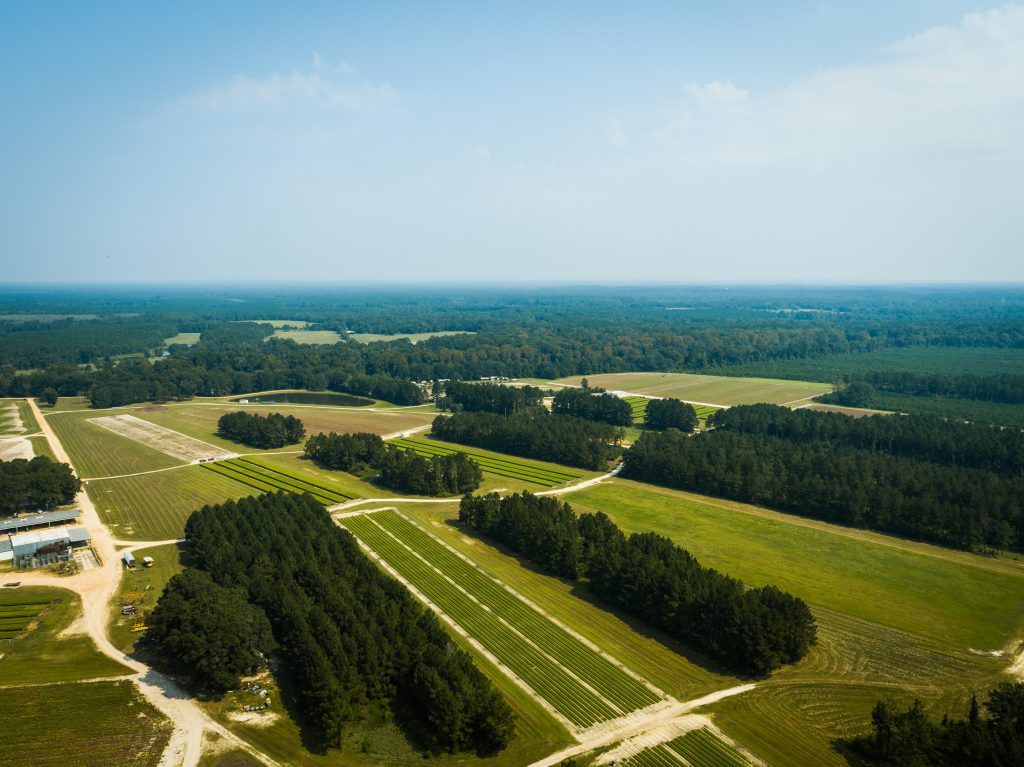
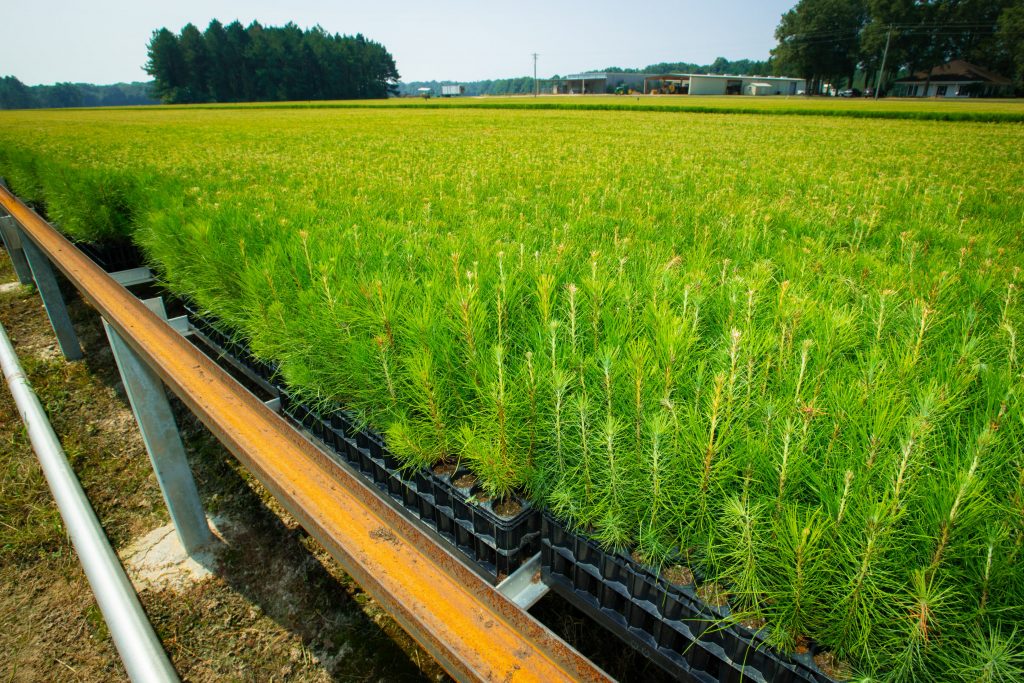
More than a billion tree saplings have been grown at Weyerhaeuser’s Pearl River Nursery in Mississippi. The facility supplies these young trees to be planted in the Amite catchment area and across the US South.
Strong markets lead to increased investment in better management (e.g. improved seedlings, more weeding or fertilisation, thinning and selecting the best trees for future saw-timber production).
“Thinning pulpwood is part of the forest management process,” explains Dr Harrison Hood, Forest Economist and Principal at Hood Consulting. “Typically, with pine you plant 500 to 700 trees per acre. That density helps the trees grow straight up rather than outwards.”
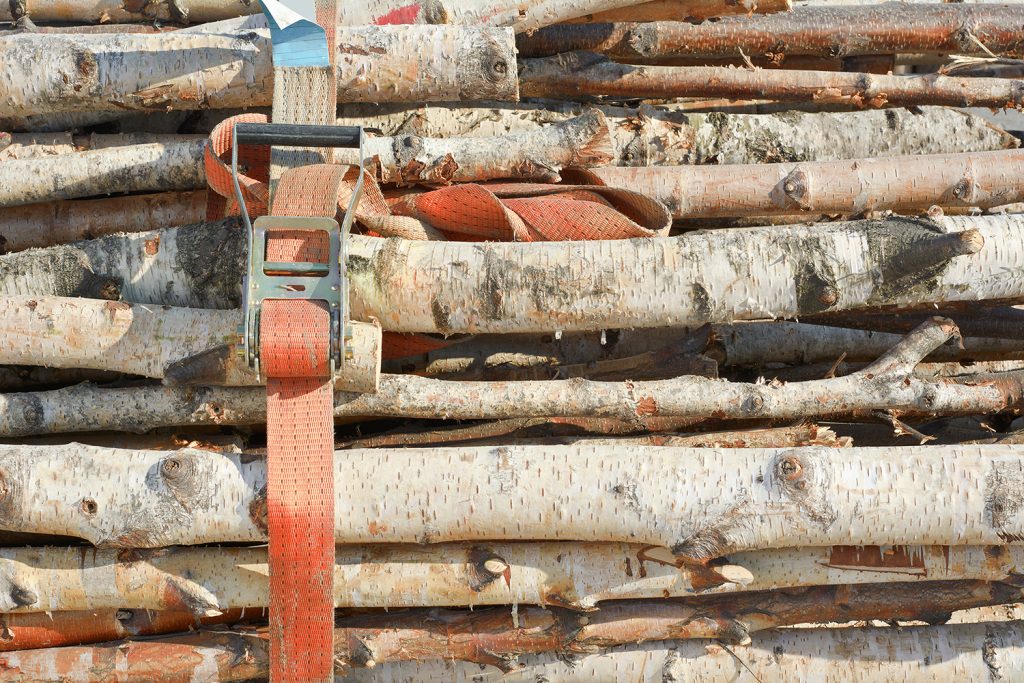
But once the trees begin to grow beyond a certain point, they can crowd one another, and some trees will be starved of water, nutrients and sunlight. It is therefore essential to fell some trees to allow the others to grow to full maturity – a process known as thinning.
“At final harvest, you’ve got about 100 trees per acre,” continues Dr Hood. “You remove the pulpwood or the poor-quality trees to allow the higher-quality trees to continue to grow.”
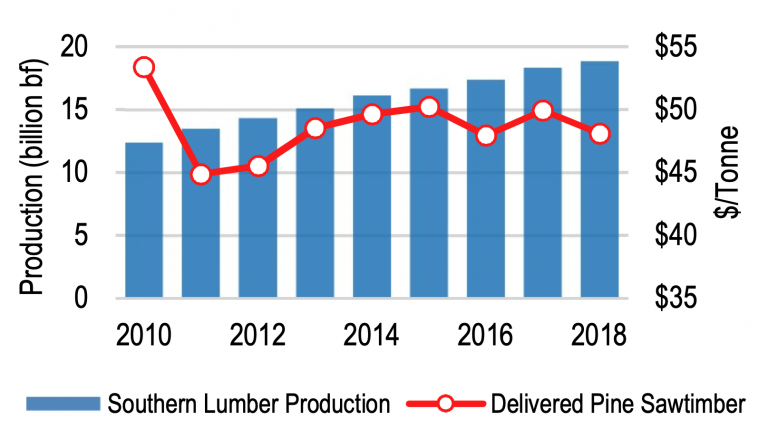
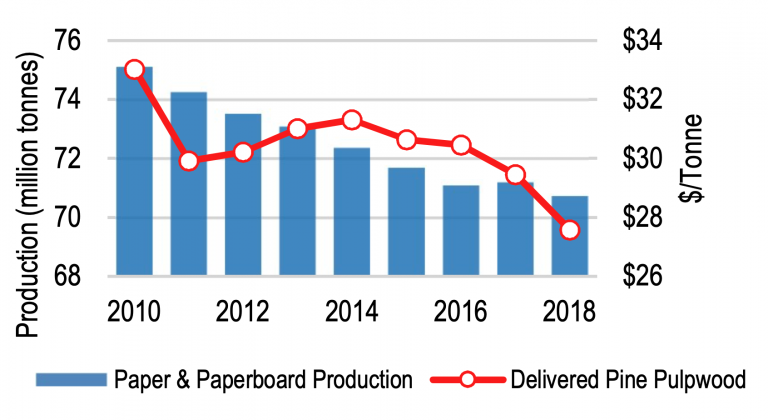
These thinnings have typically been used as pulpwood to make things like paper, but with the slight decline of this industry over the last few decades there’s been a need to find new markets for it. Paper production in the Amite catchment area has declined since 2010 (as shown on the chart on the right), whilst demand for saw-timber (lumber) has been increasing following the economic recovery after the recession of 2008.
- Southern pine lumber production vs. Amite BioEnergy catchment area delivered pine sawtimber price. Source: Southern Forest Products Association, American Forest & Paper Association, TimberMart-South
- US paper & particleboard production vs. Amite BioEnergy cartchment area delivered pine pulpwood price. Source: Southern Forest Products Association, American Forest & Paper Association, TimberMart-South
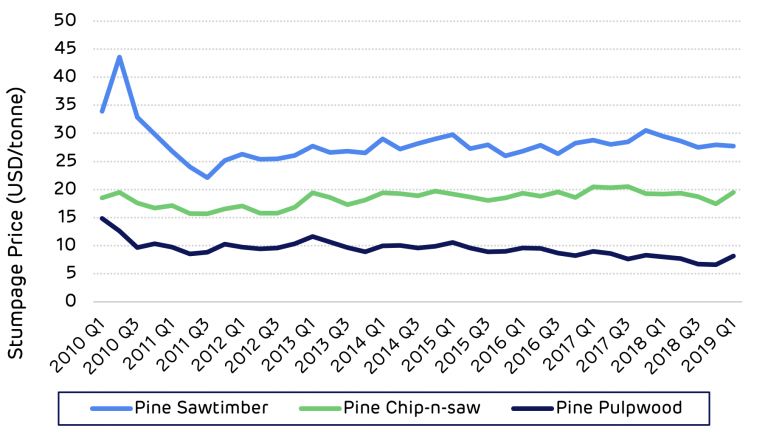
Producing saw-timber, without a market for thinnings and low-grade wood is a challenge. The arrival of a biomass market in the area has created a renewed demand – something that is even more important at the current time, when there is an abundance of forest, but wood prices are flat or declining slightly.
“Saw-timber prices haven’t moved much over the last six to eight years,” explains Dr Hood. “They’ve been flat because there’s so much wood out there that there’s not enough demand to eat away at the supply.”
Pulpwood consumers such as Amite BioEnergy create demand for pulpwood from thinning, allowing landowners to continue managing their forests while waiting for the higher value markets to recover. Revenue from pulpwood helps to support forest owners, particularly when saw-timber prices are weak.
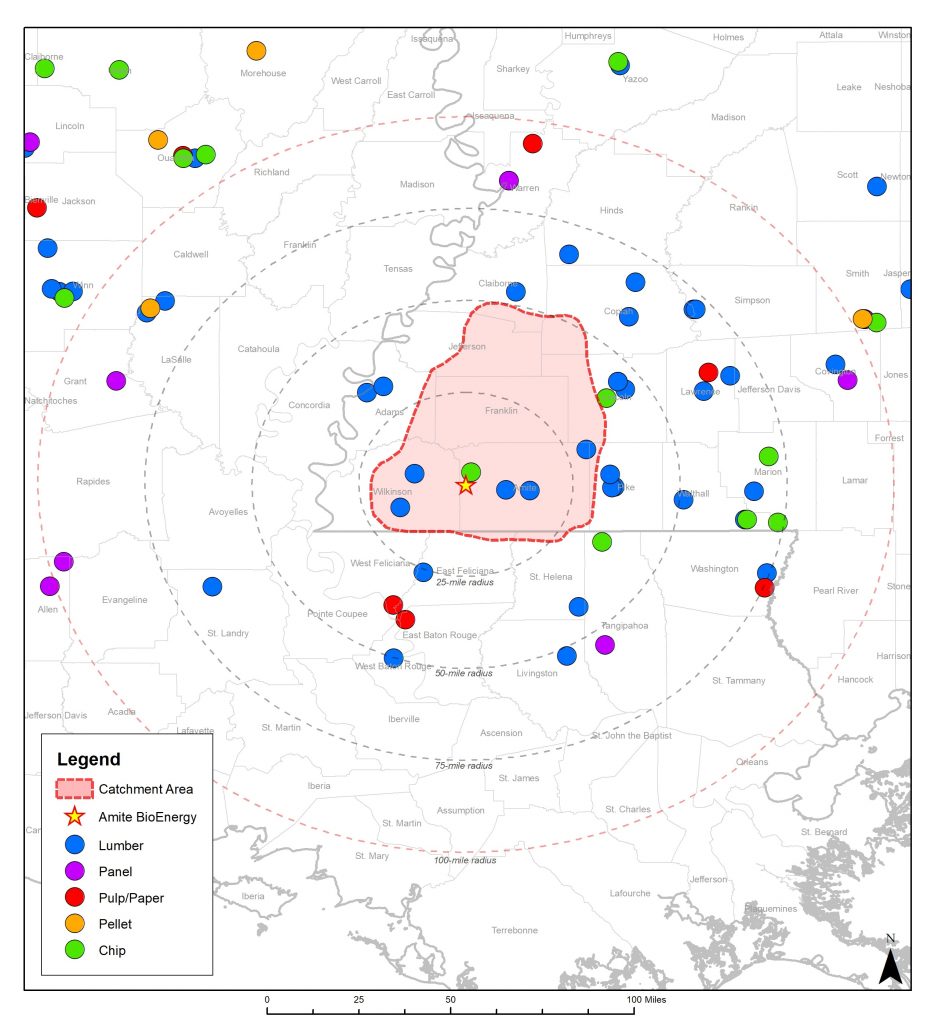
Amite BioEnergy catchment area mill map (2019)
“There’s so much pulpwood out there,” says Dr Hood. “You need a buyer for pulpwood to allow forests to grow and mature into a higher product class and to keep growing healthy forests.”
The picture of the overall forest in the catchment area is of healthy growth and, crucially, a sustainable environment from which Drax can responsibly source biomass pellets for the foreseeable future.


