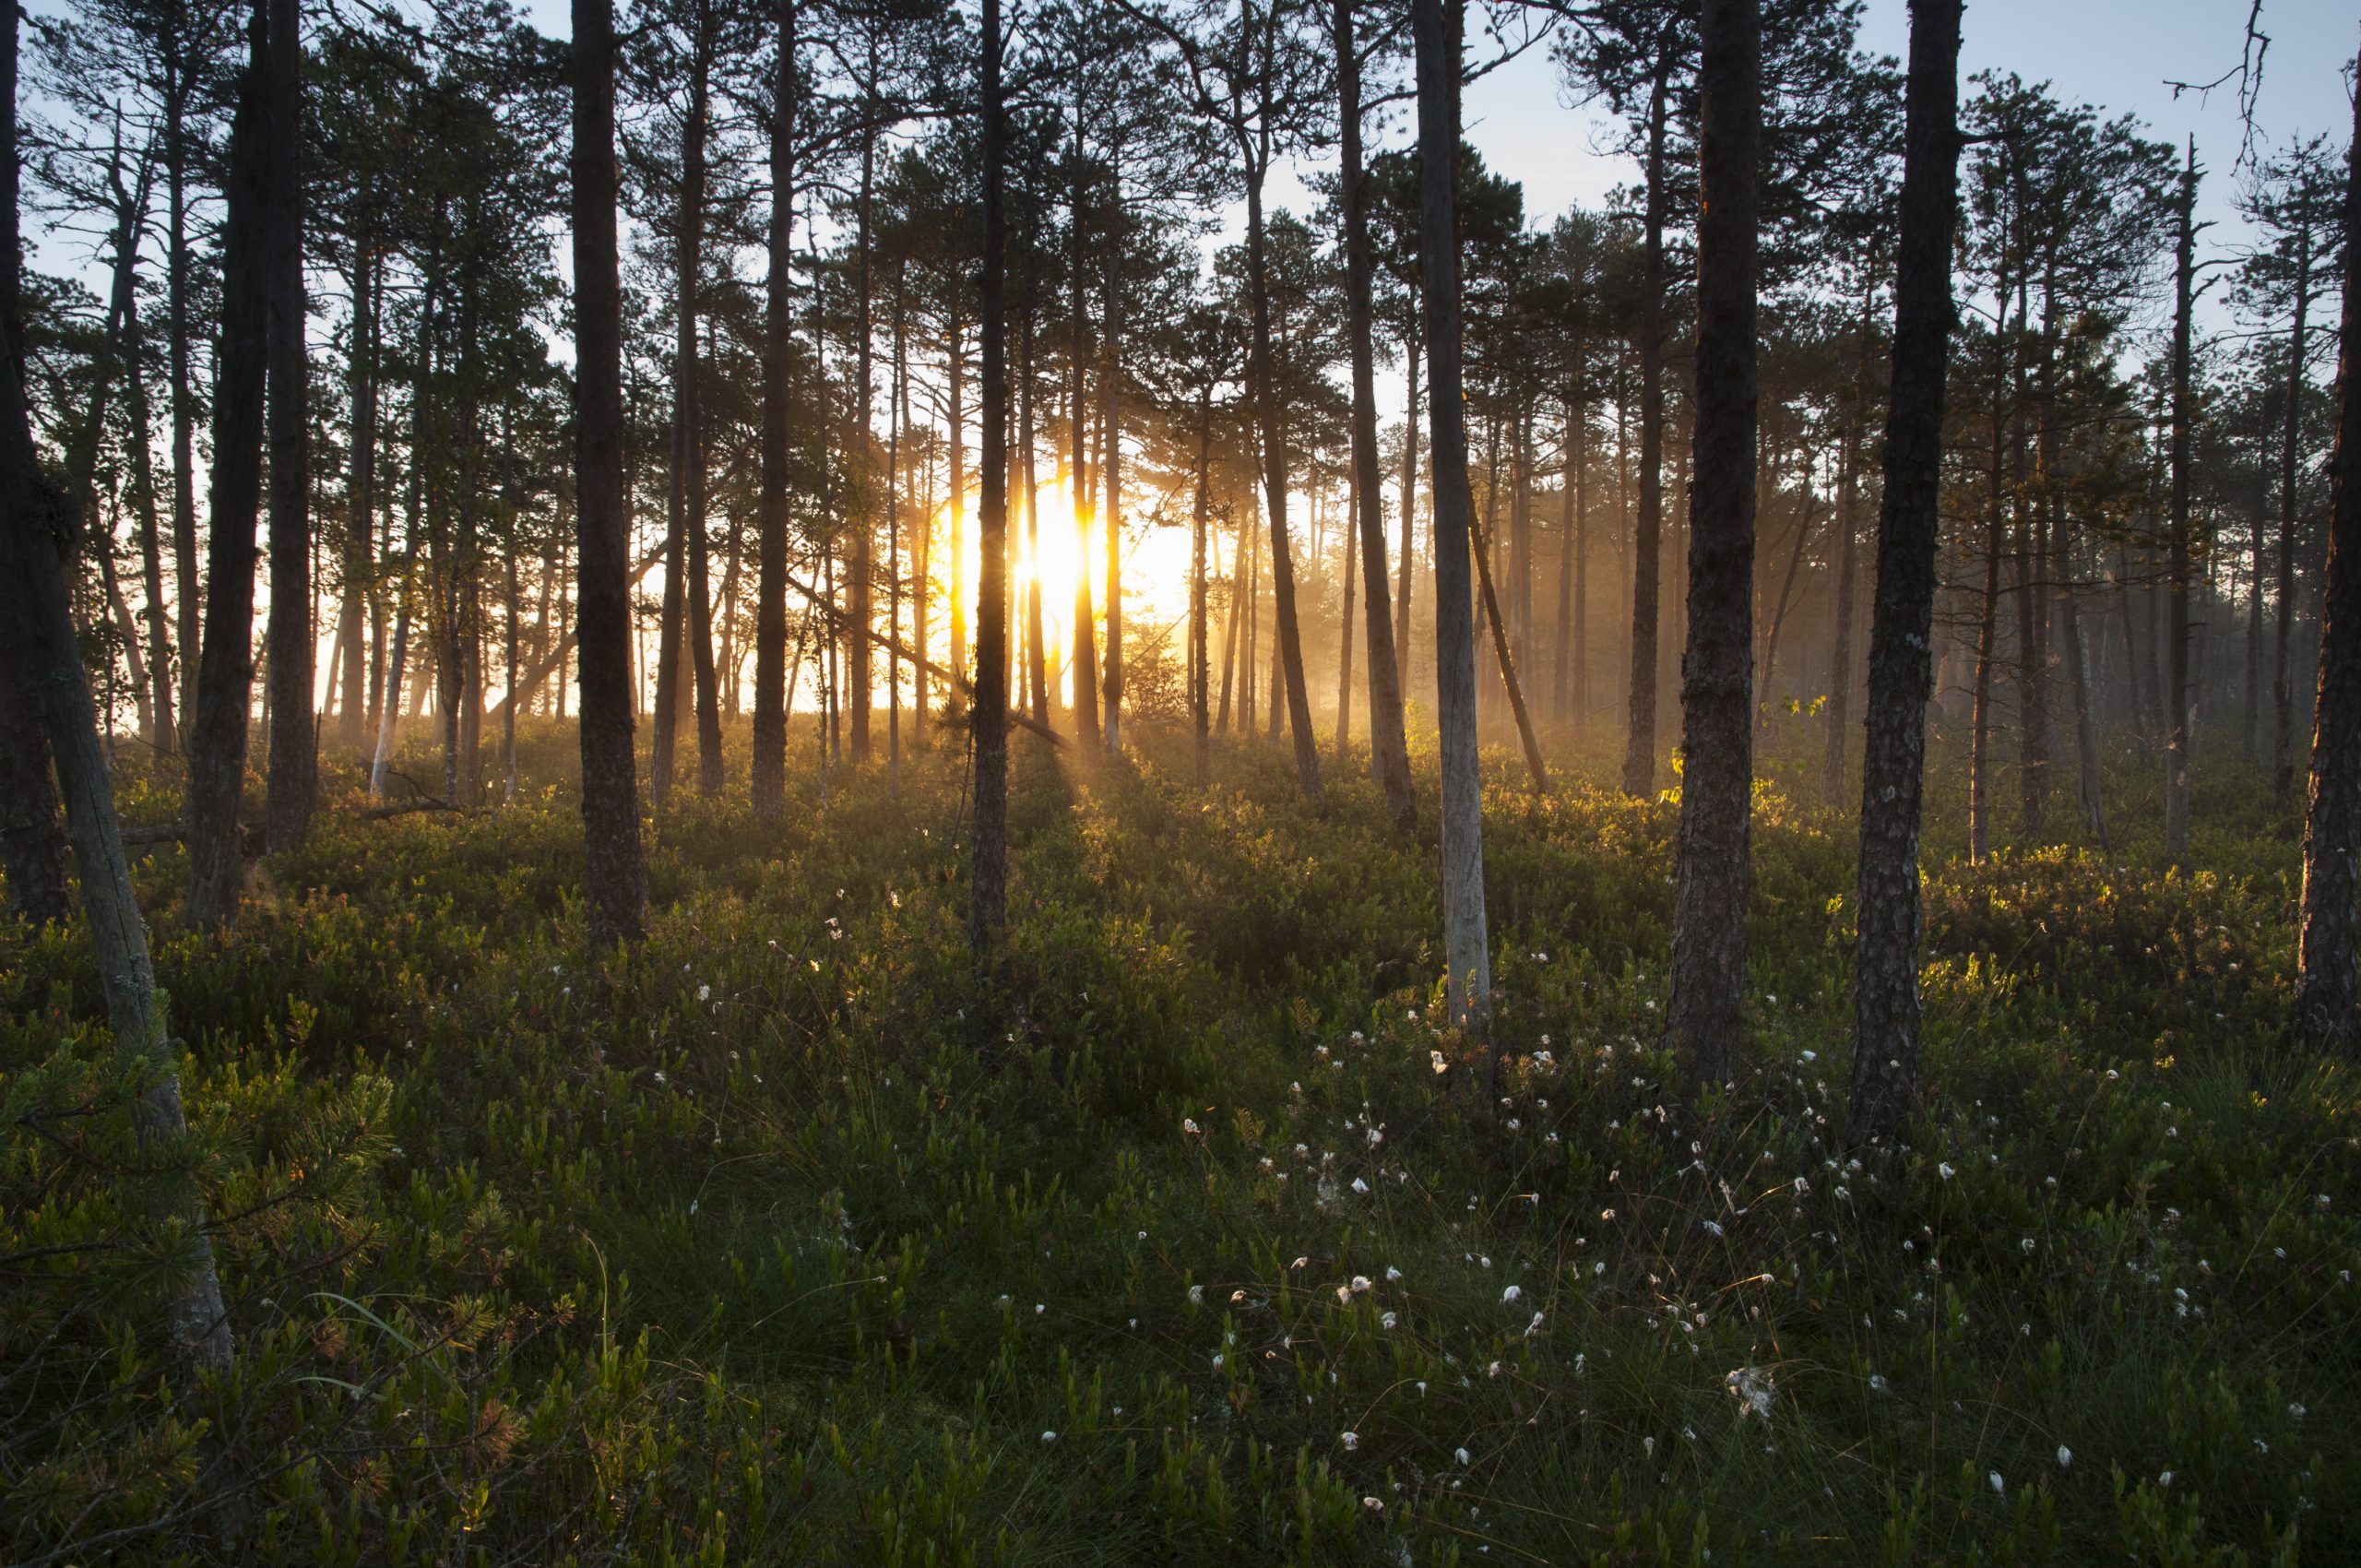


Increased timberland, increased carbon stored in the forest, robust prices and new markets benefiting forest owners and forest workers, are among the findings of a report by Hood Consulting.
This fourth in a series of catchment area analyses for Drax looks at the area surrounding three pellet plants operated by Enviva: Ahoskie, Northampton and Southampton.
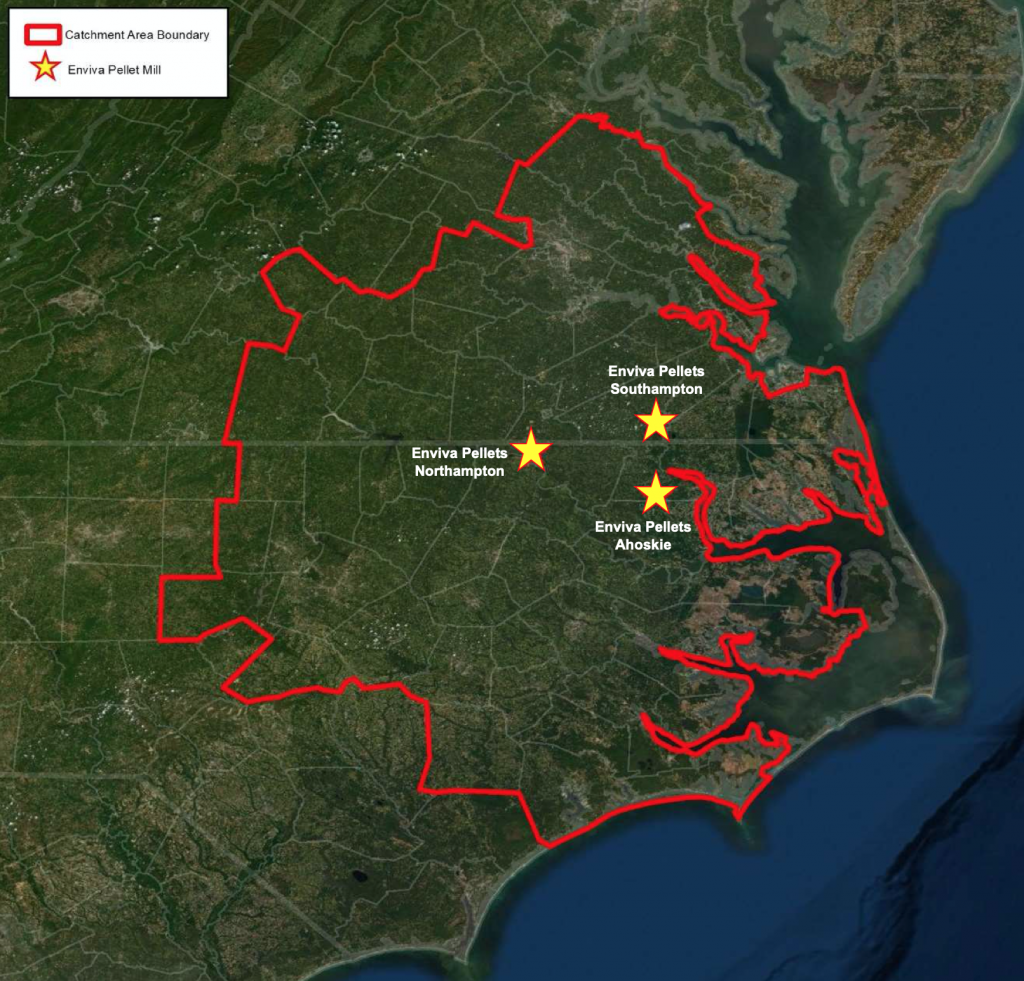
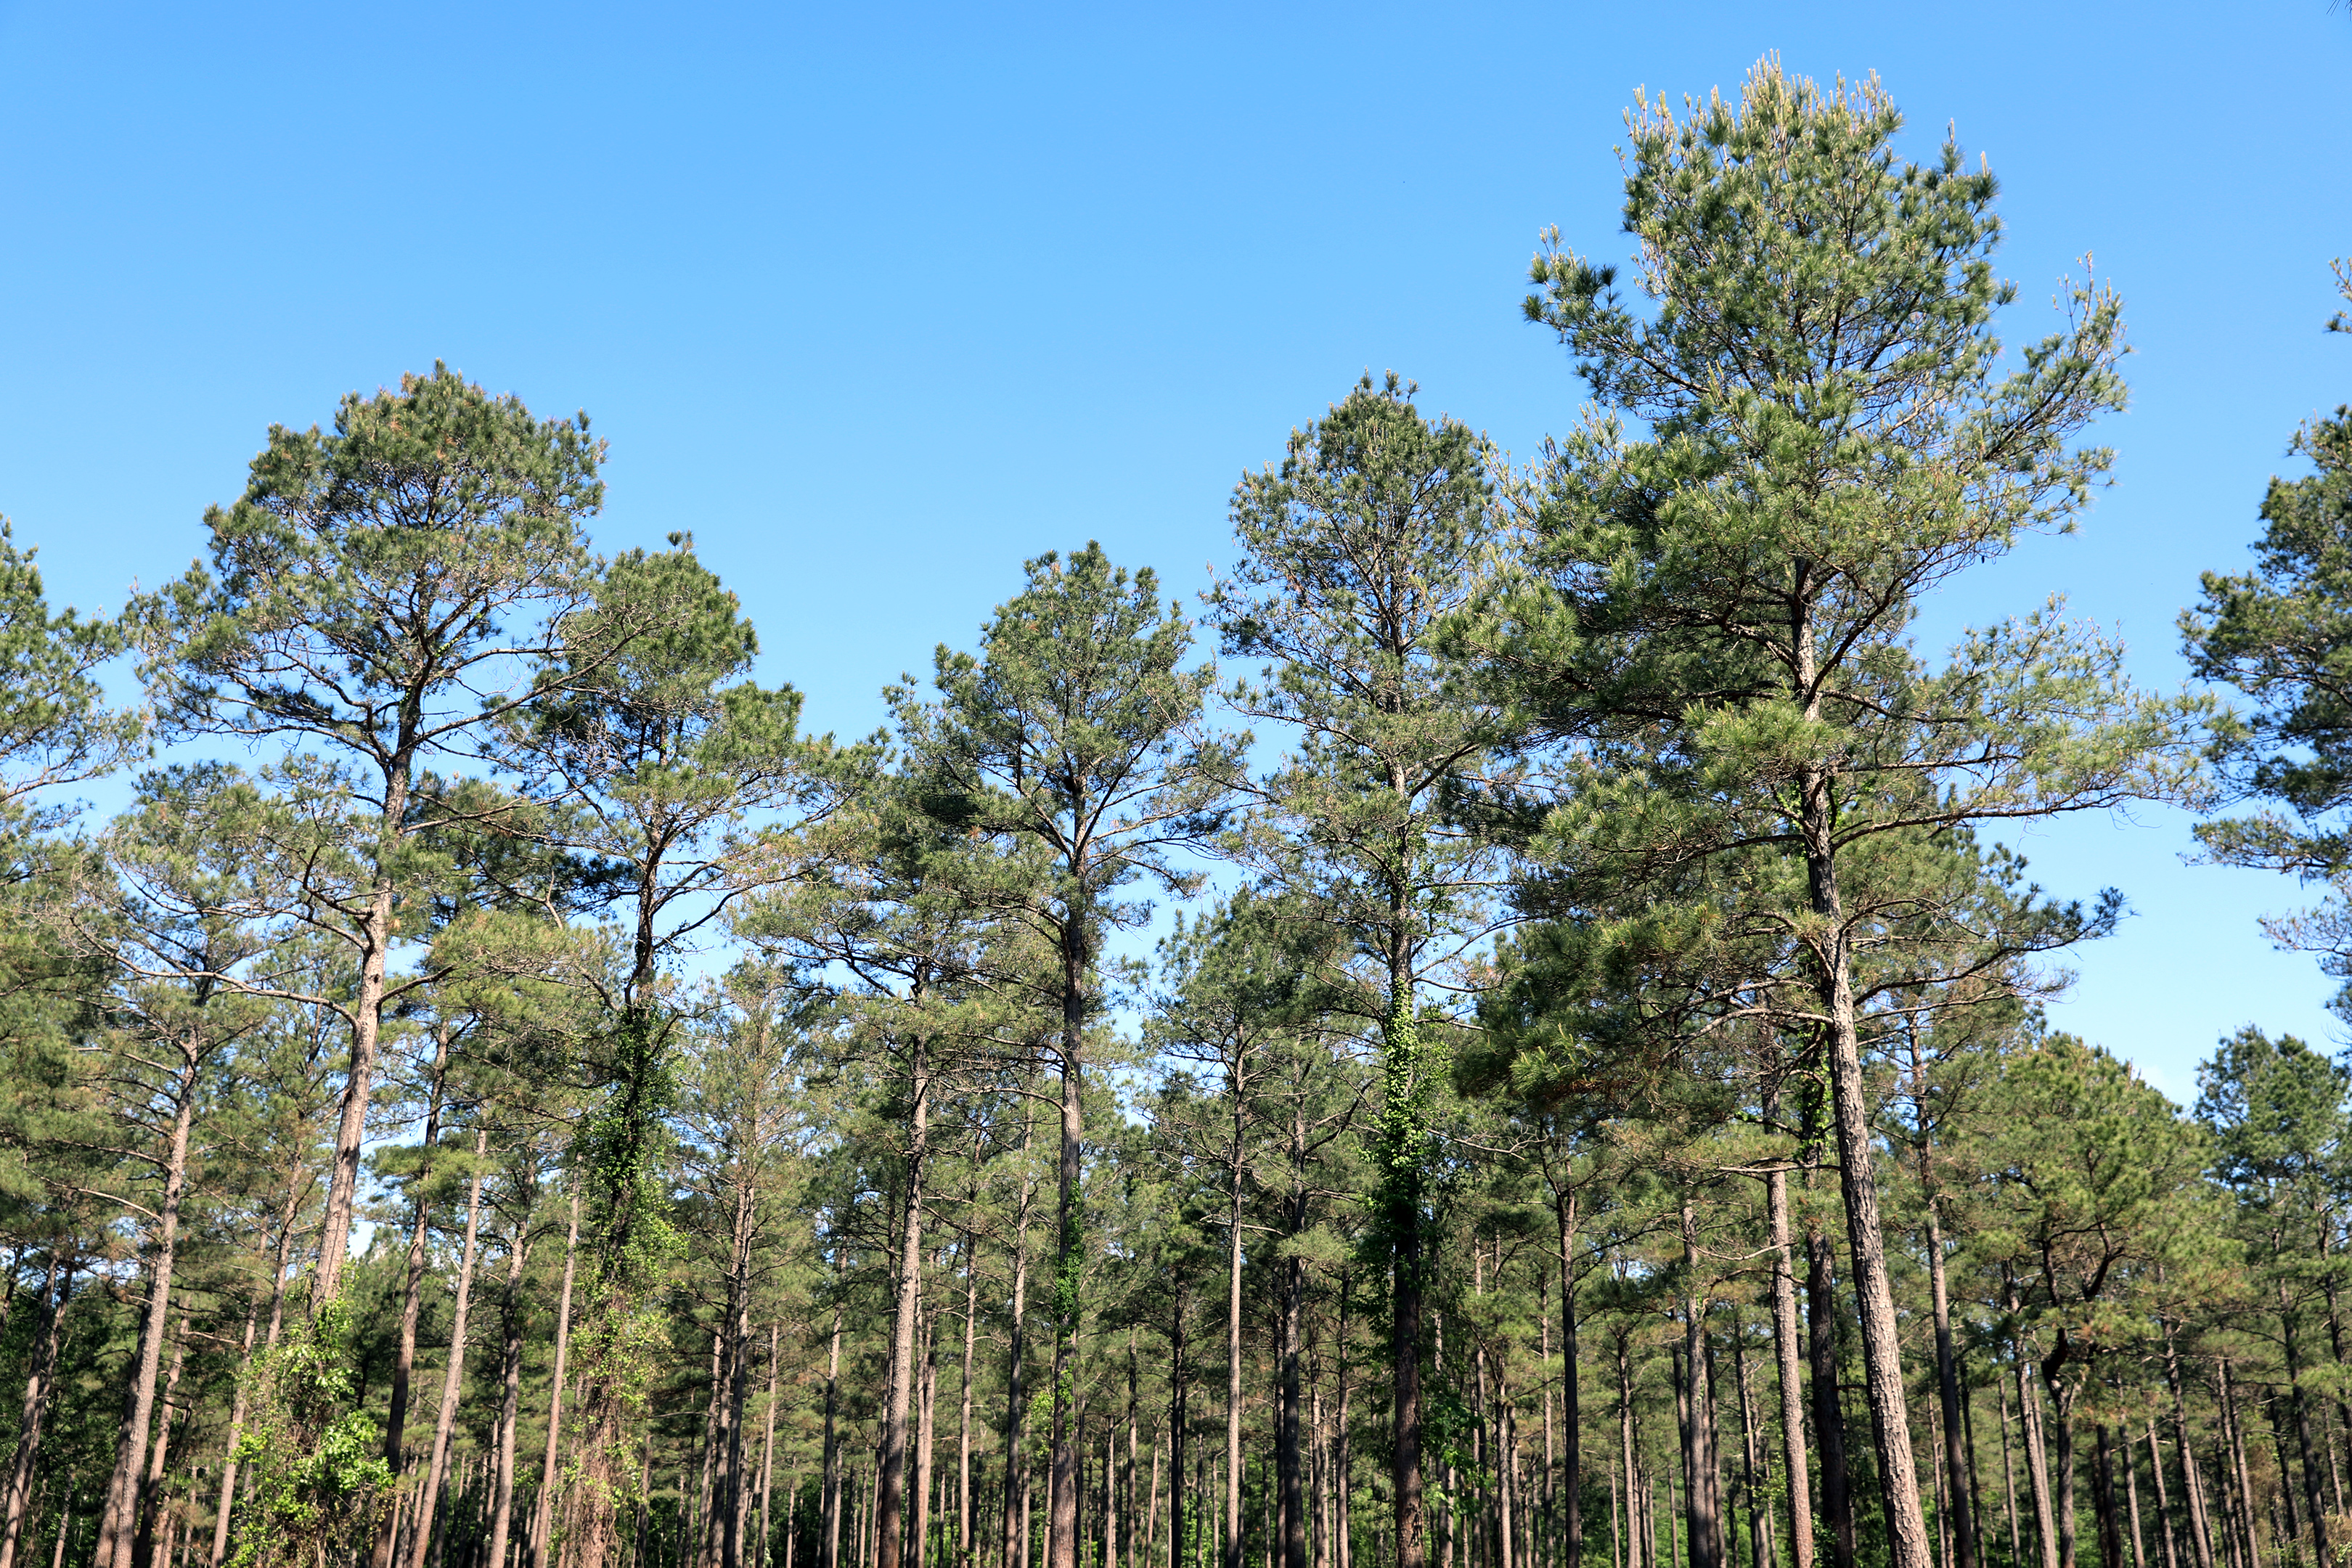
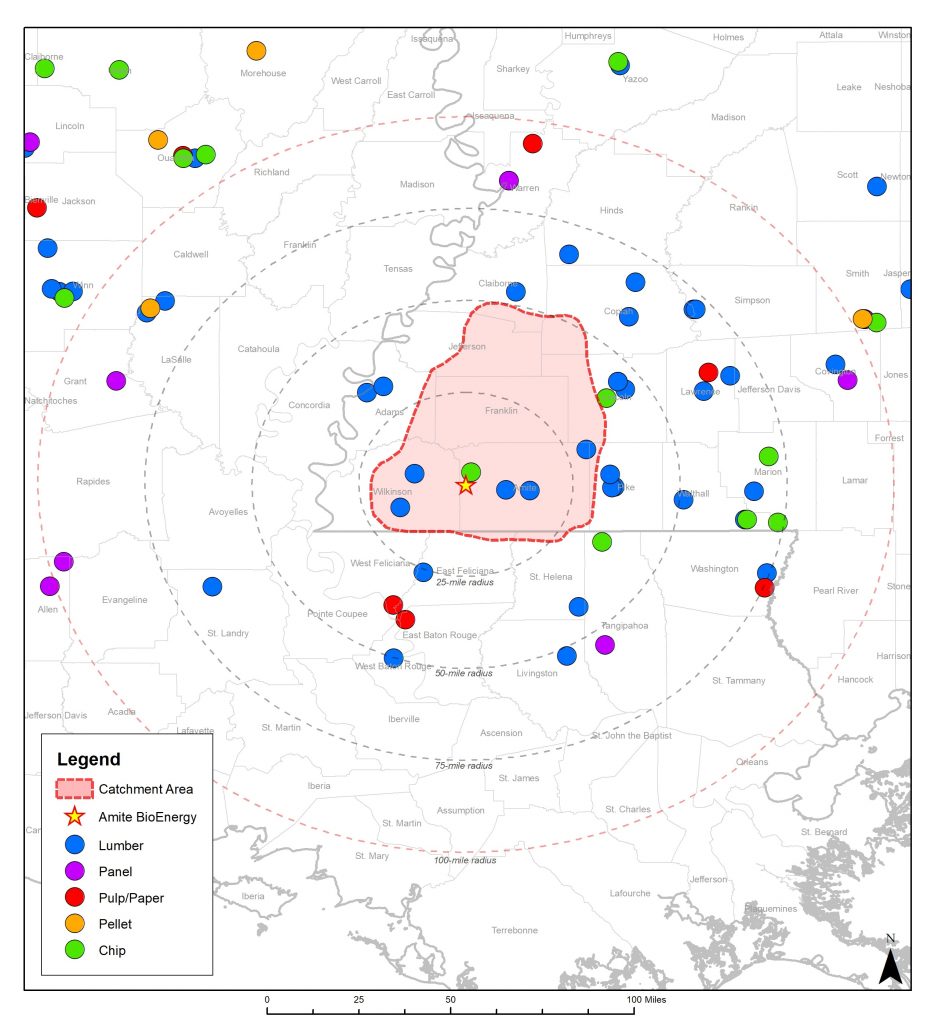
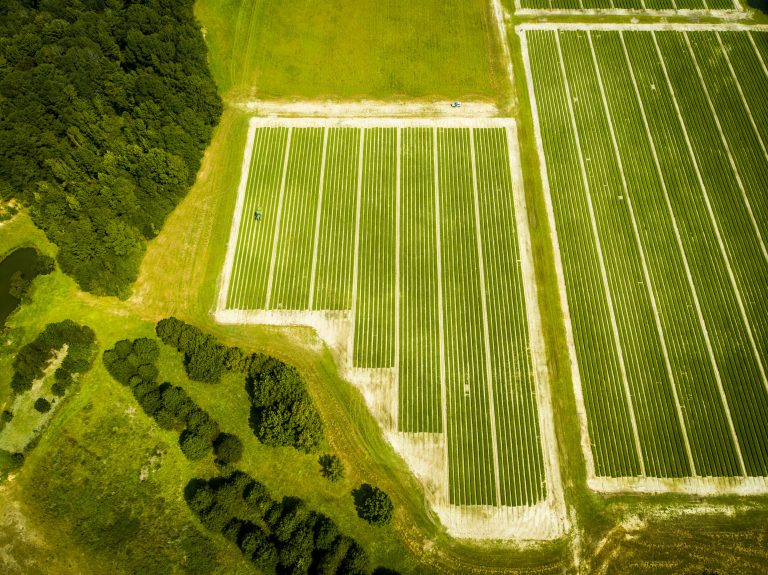
Enviva catchment area in Virginia and North Carolina
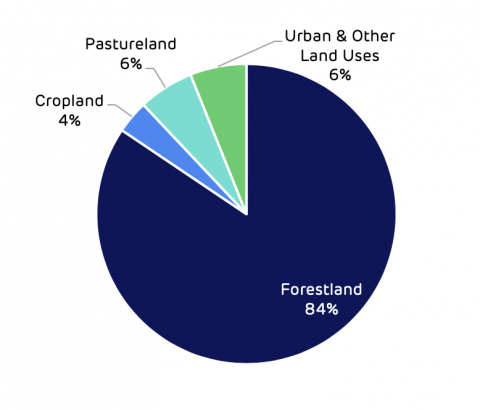
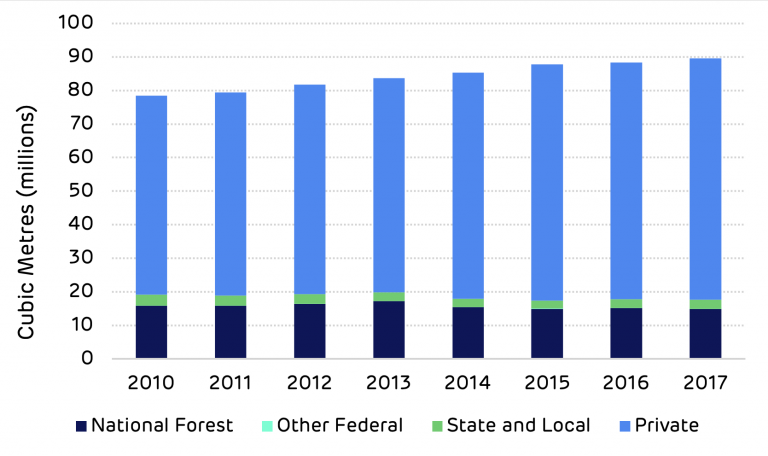
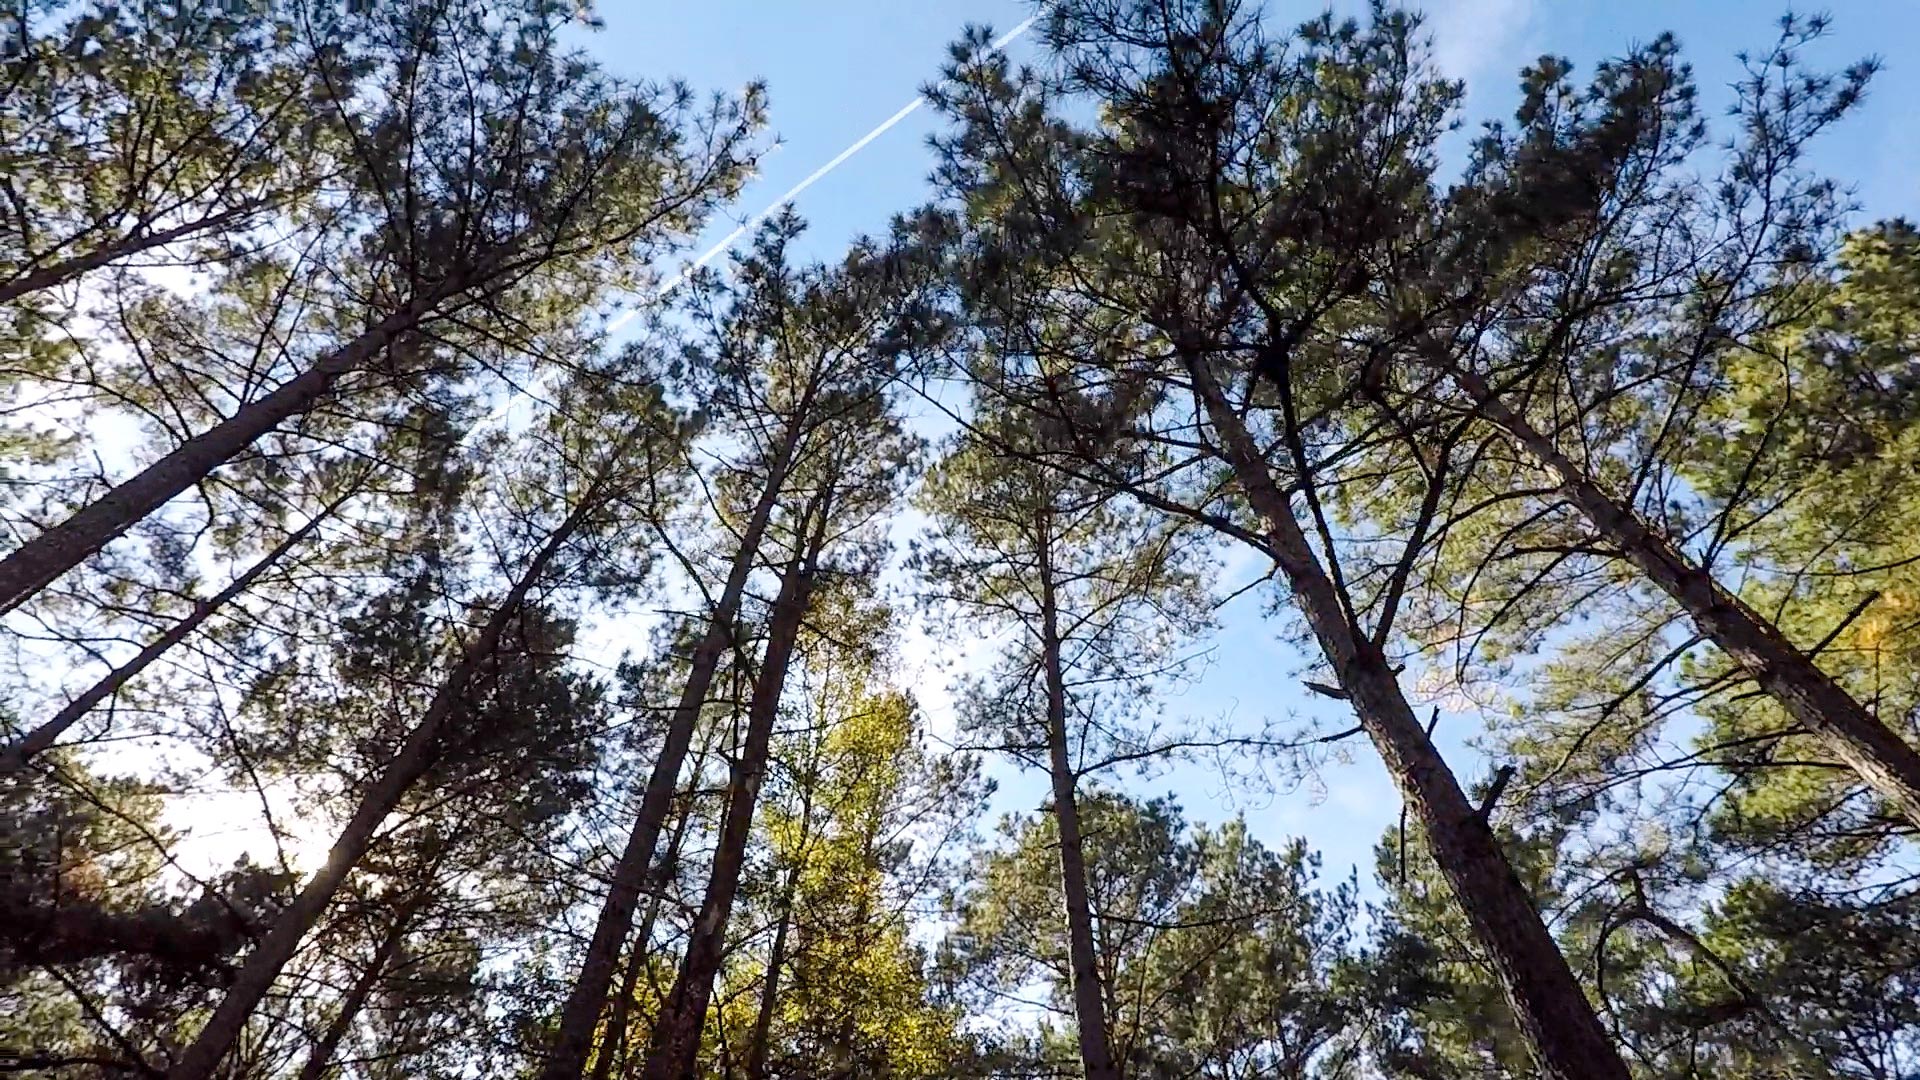
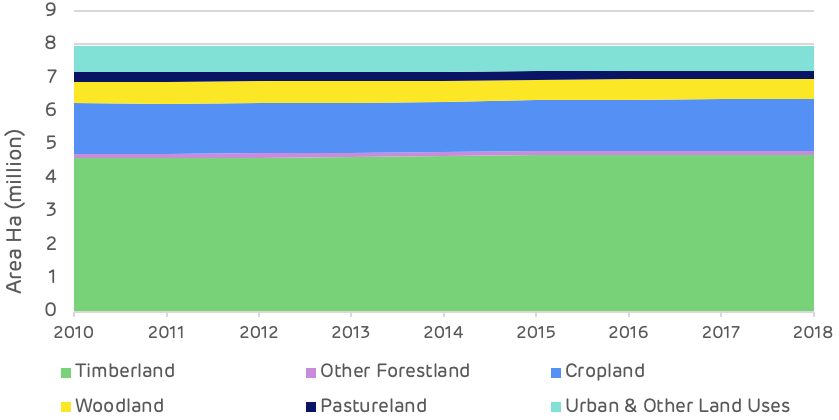
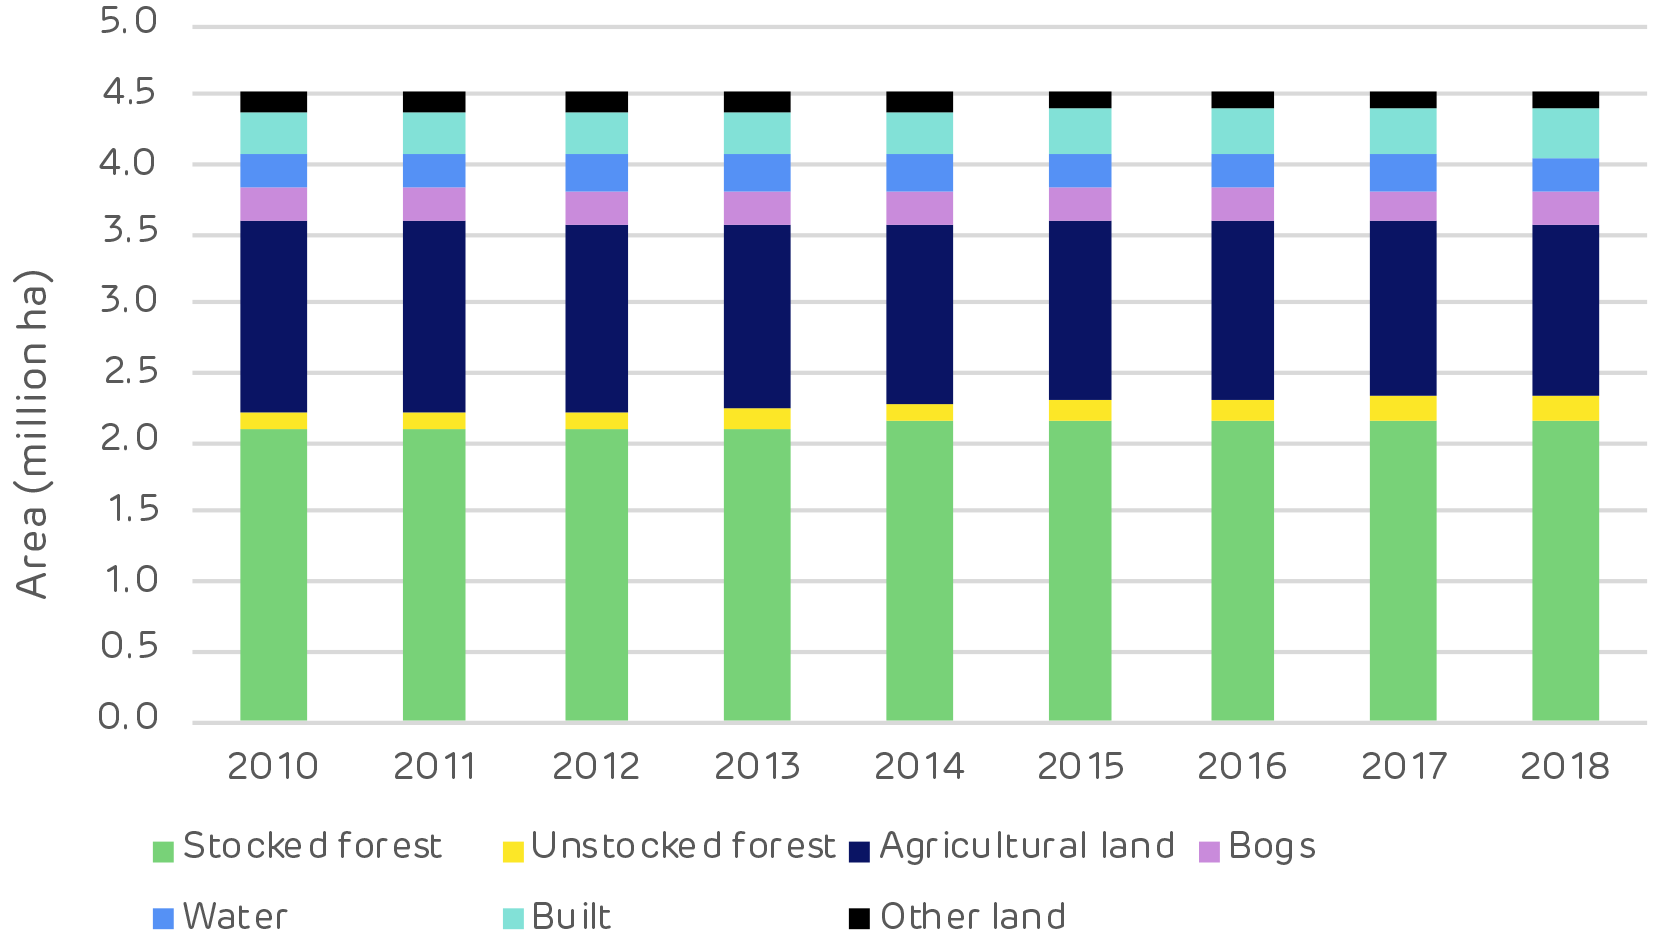
Forests and woodlands represent 68% of the total area at just over 5.4 million hectares (ha) with 87% of this area classified as timberland. The area of timberland (actively managed productive forest) has increased by around 89,000 ha since 2010 and there have been some significant changes in forest type.
The overall area of forest has increased and there is no evidence of deforestation occurring.
Land use by area
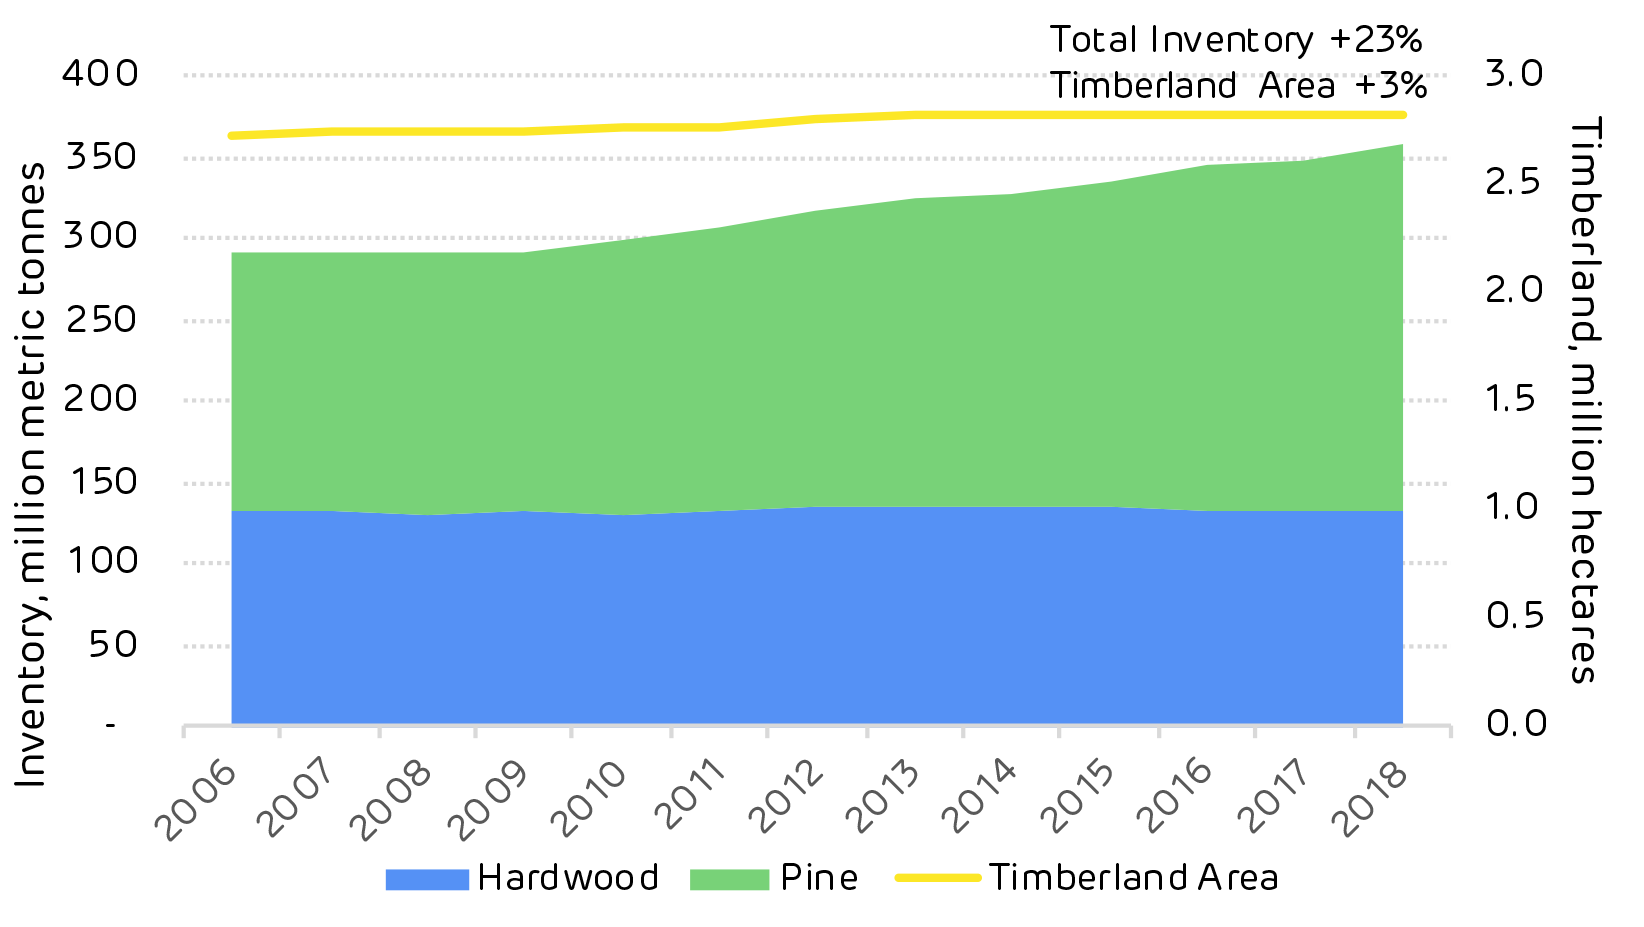
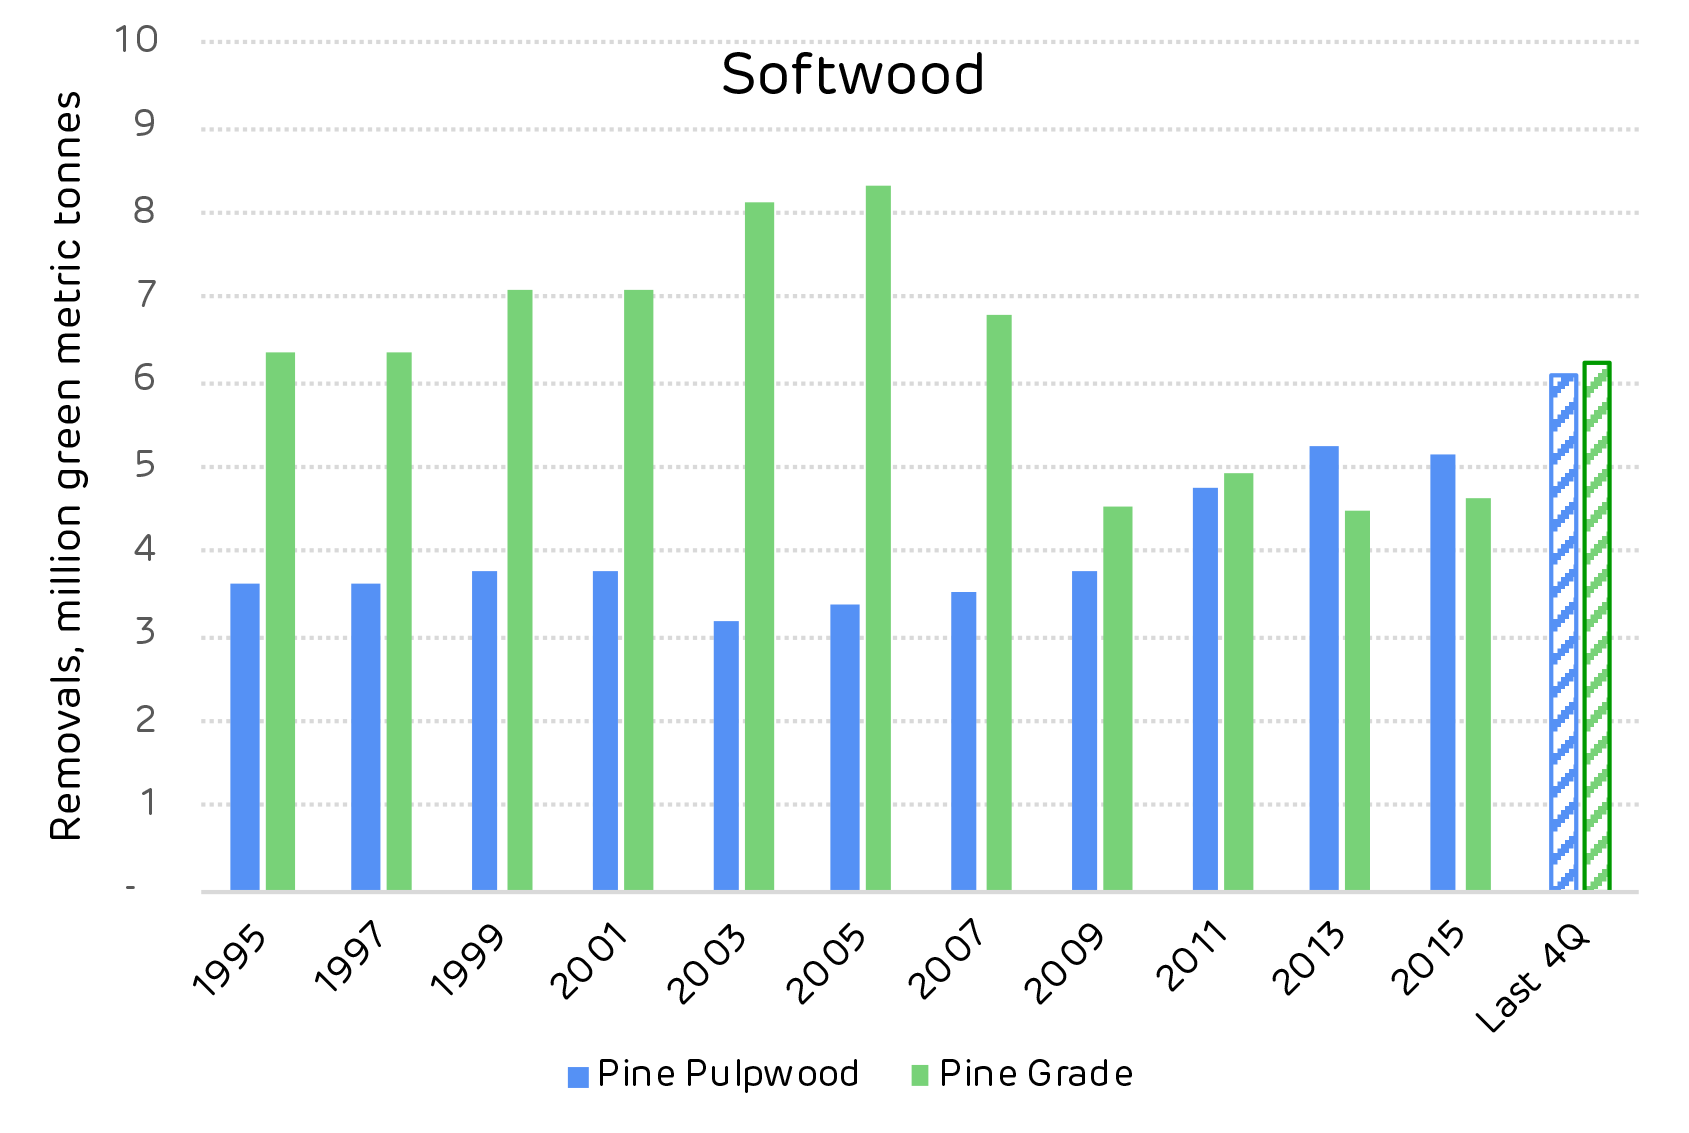
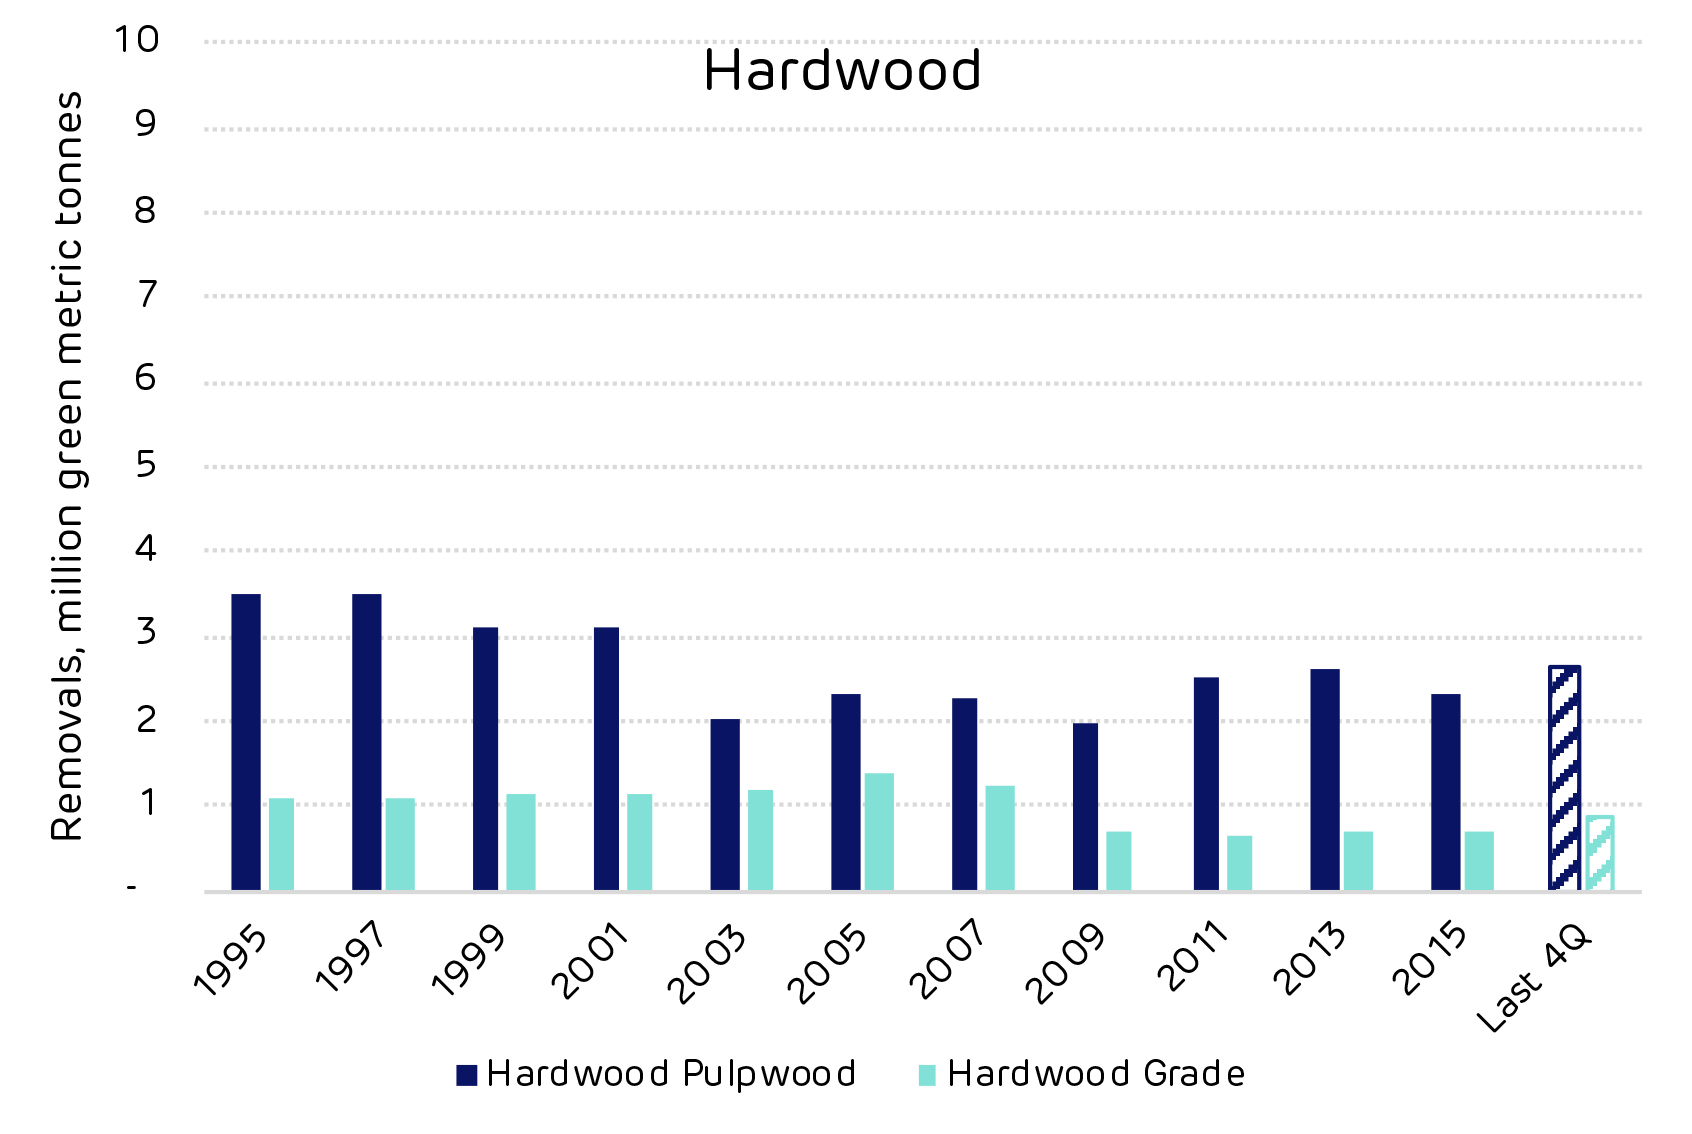
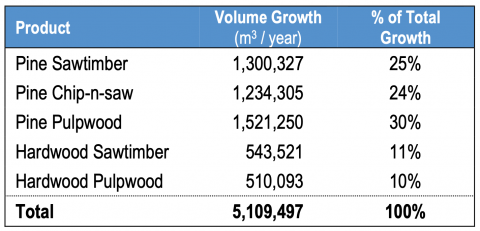
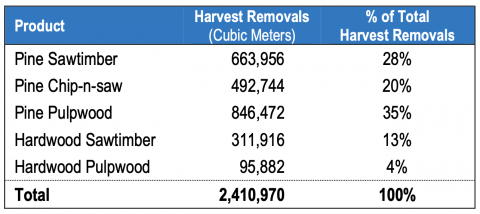
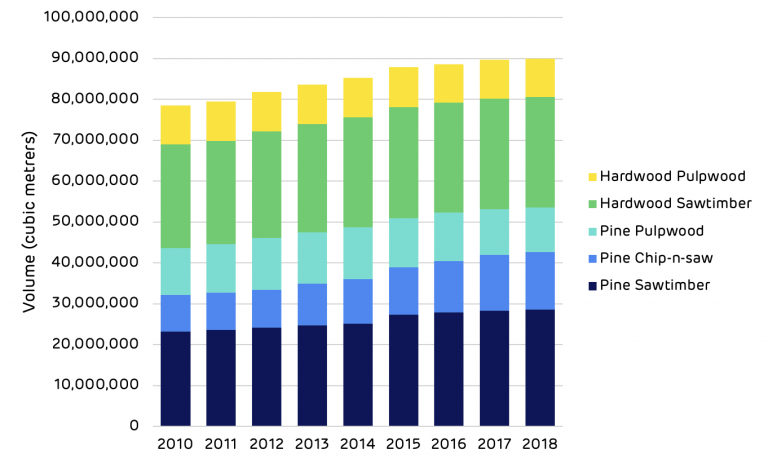
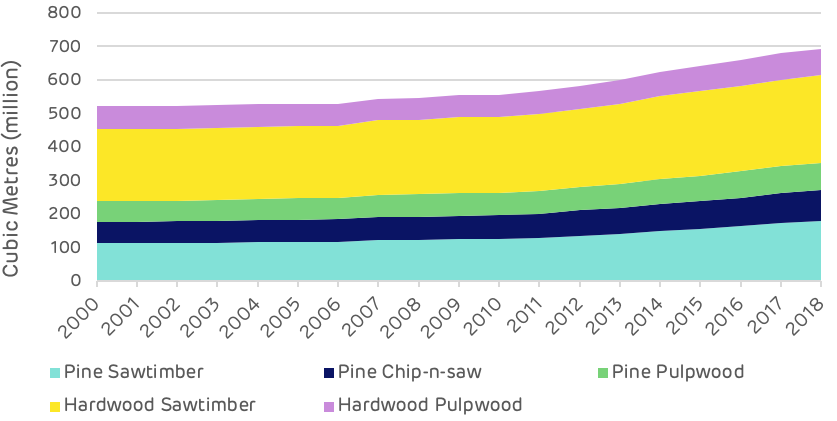
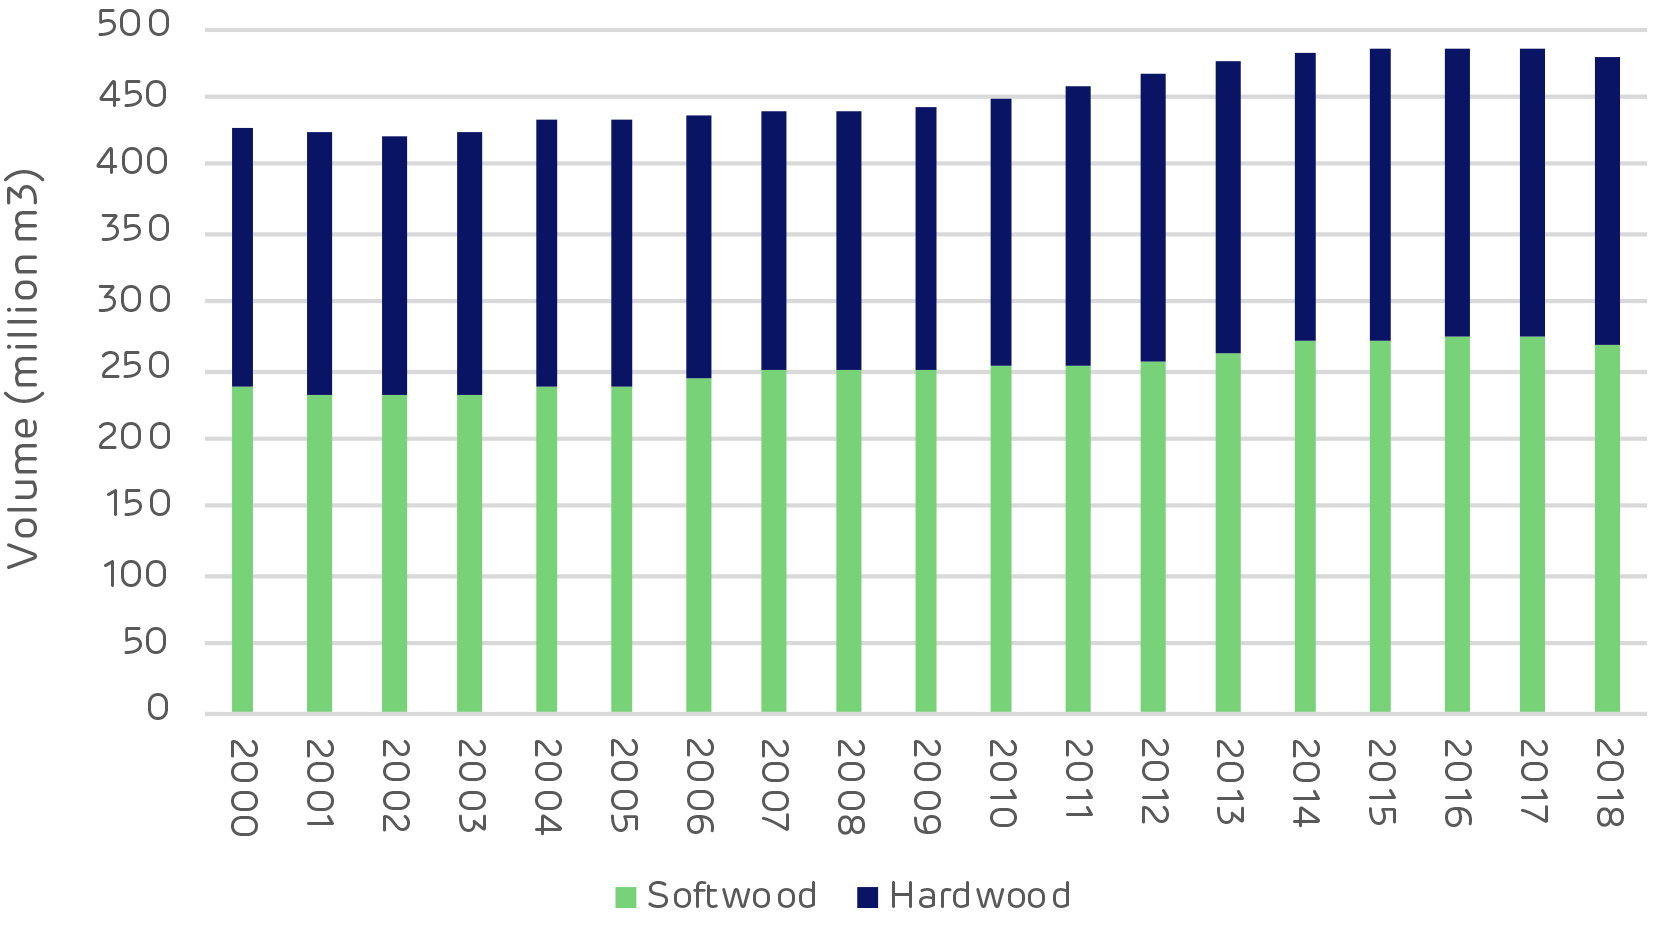
Since 2000, the total volume of standing timber in the catchment area has increased by 170 million cubic metres (m3). Sixty five percent of this increase has occurred since 2012, indicating a growing/maturing forest resource and an expanding forest area. Most of the increase in volume has been in the saw-timber categories for both pine and hardwood, although the hardwood pulpwood size class has also increased by nearly 10 million m3 since 2012 following a small decline between 2000 and 2012.
Timber inventory by product category
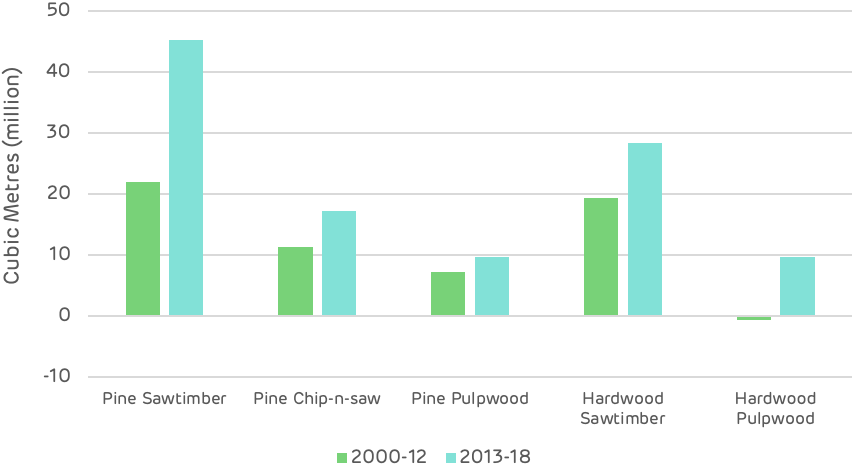
The increased demand from the three Enviva pellet mills, beginning operation in 2012 in the Chesapeake region, appears to have had no negative impact of the accumulation of forest carbon in the growing stock of the region. Since this time, all categories of timber product have increased.
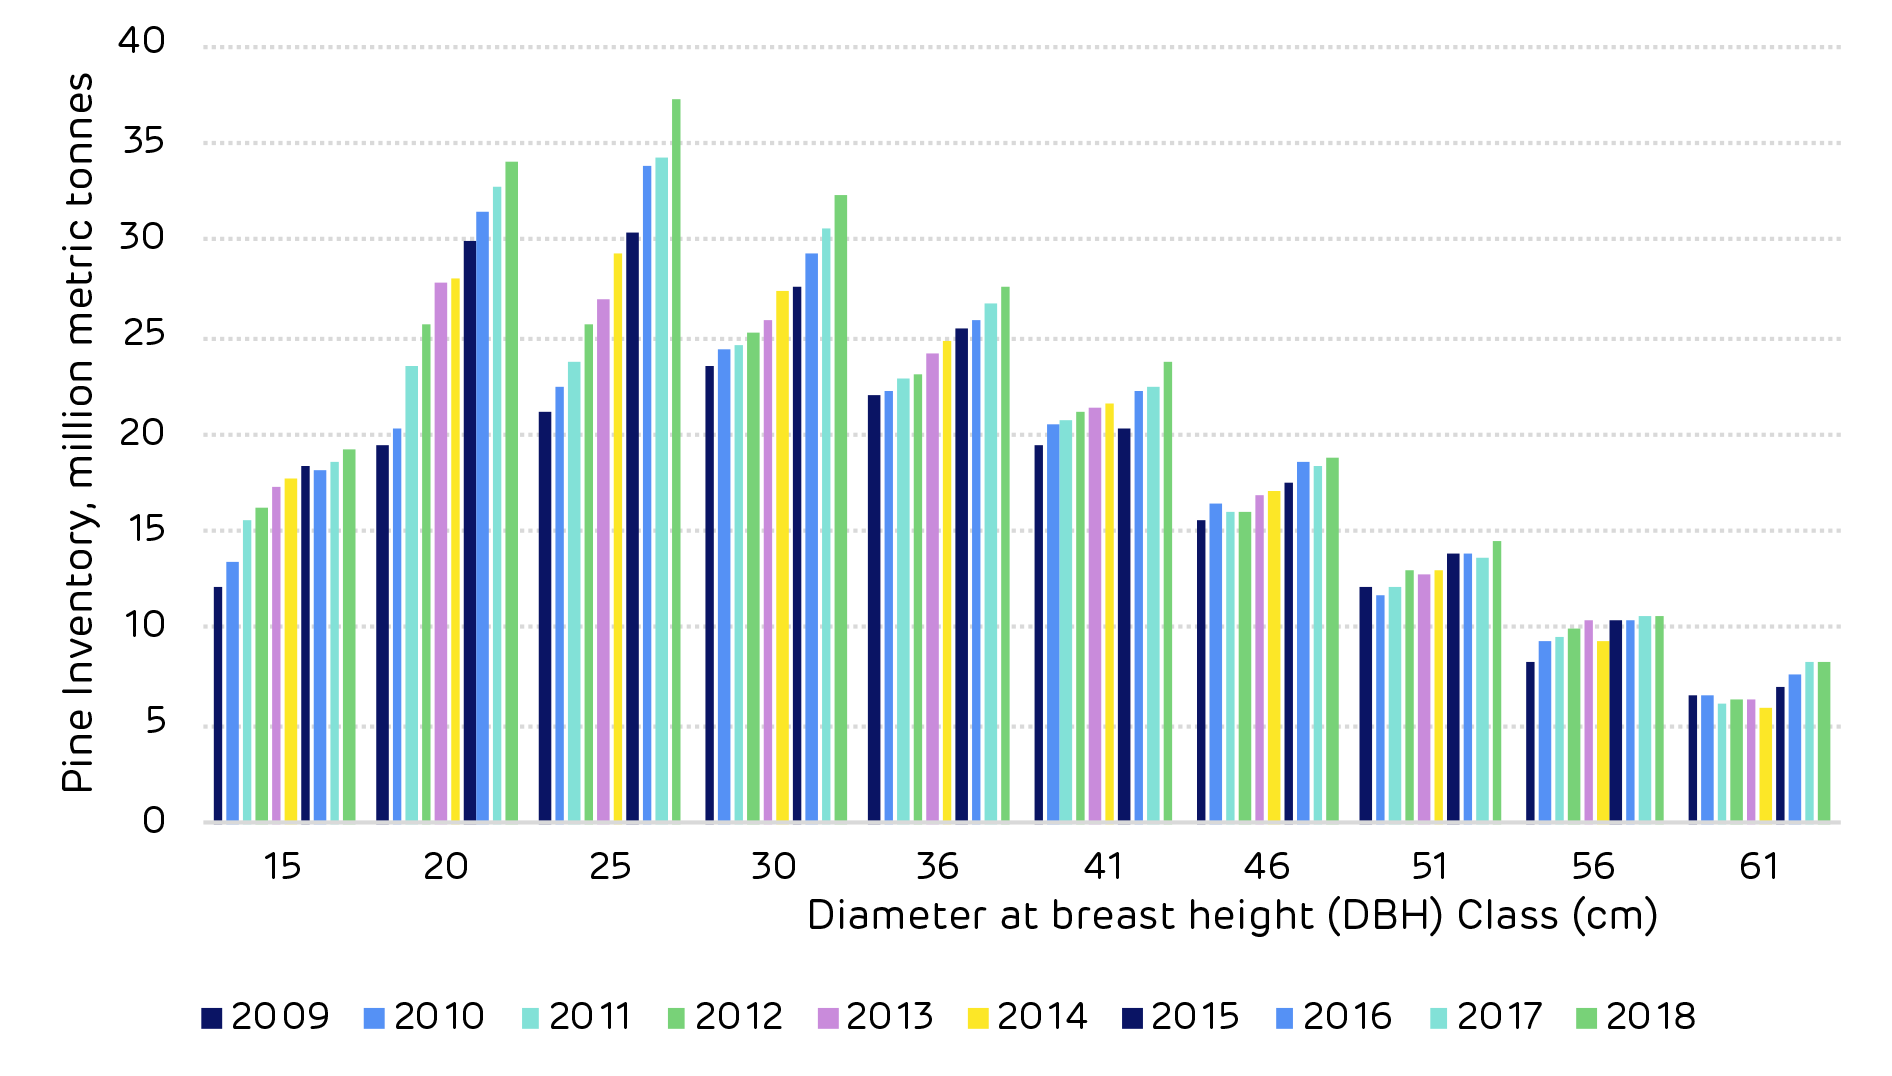
Timber inventory by product category – pre and post-Enviva
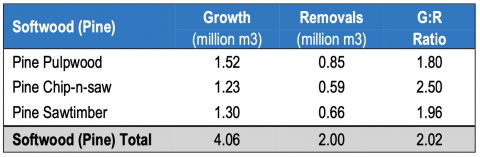
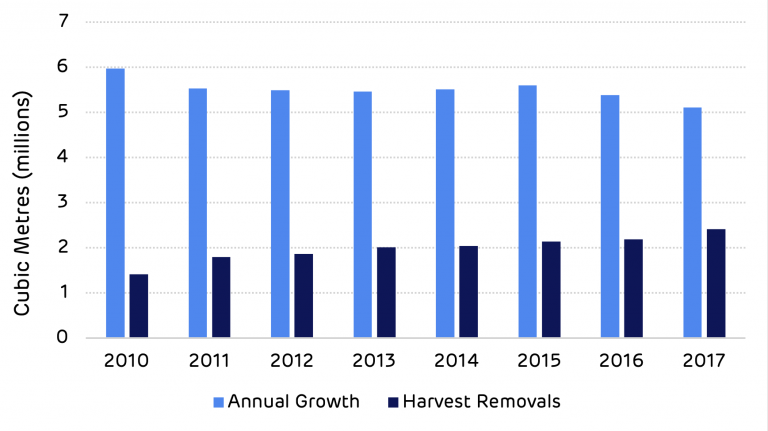
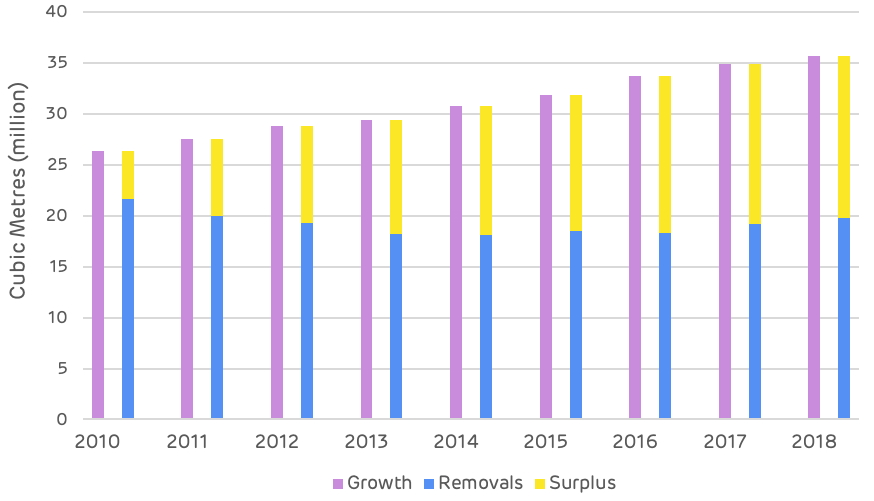
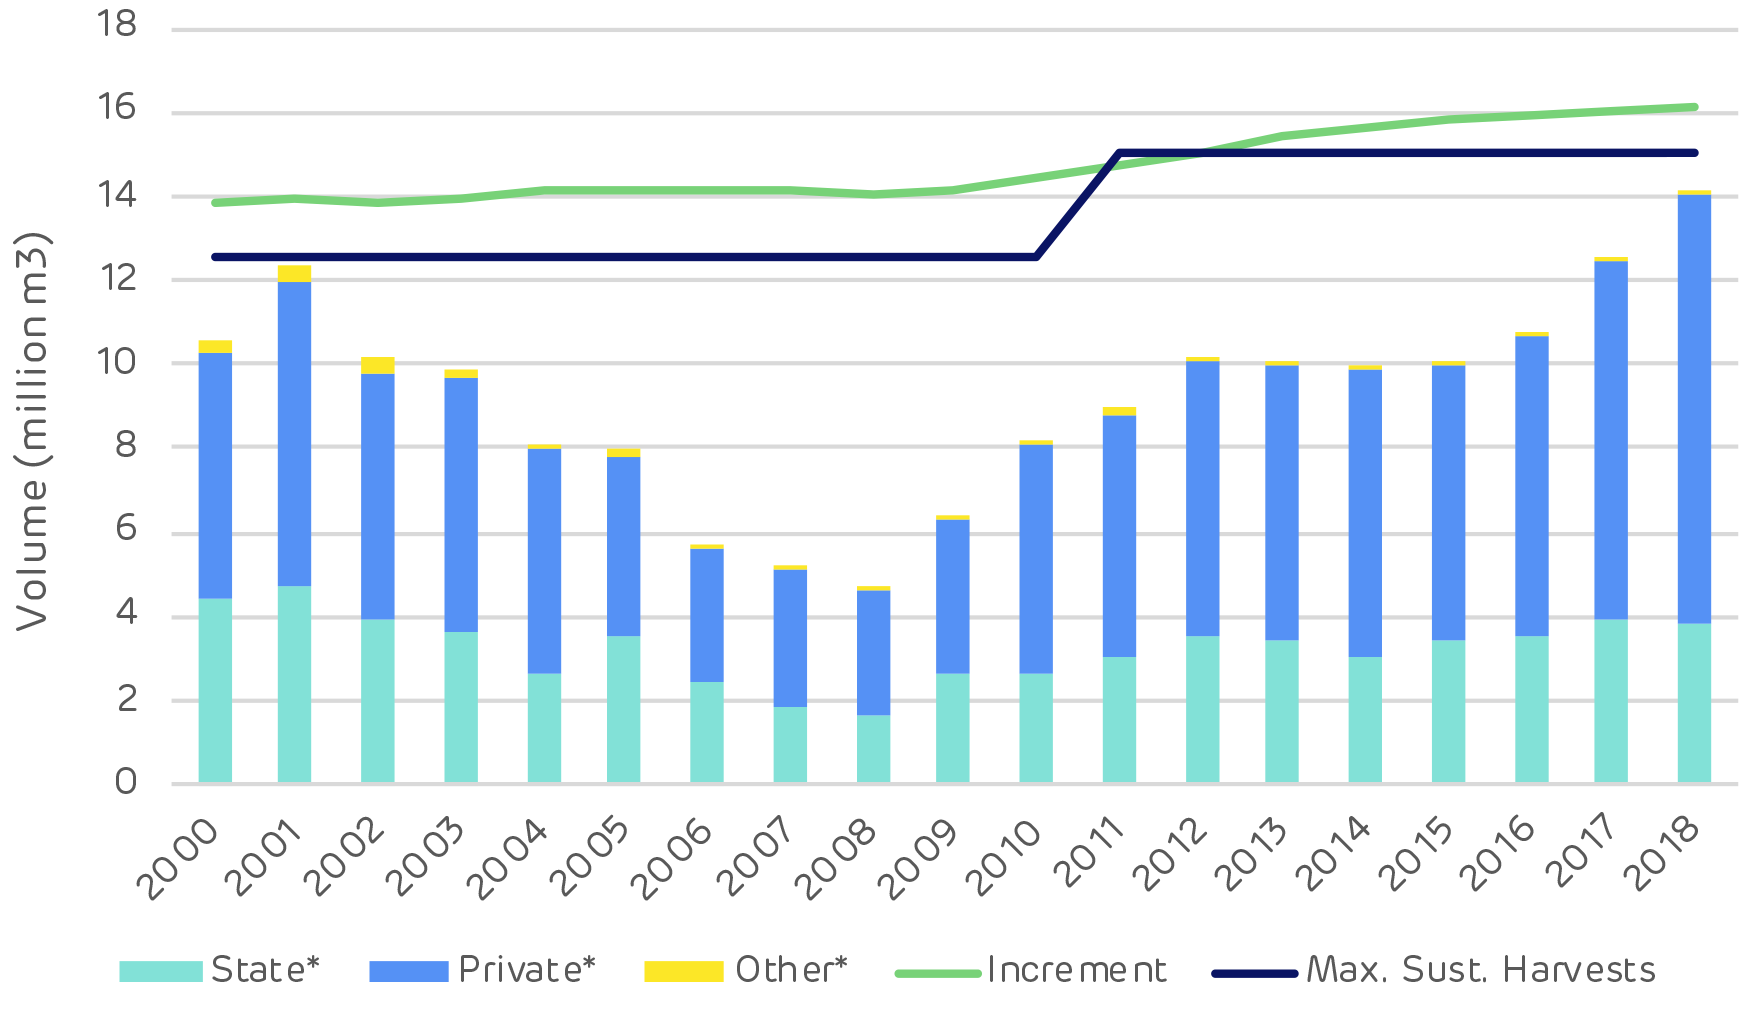
This increase in inventory is also reflected in the comparison of average annual growth to removals. The surplus of un-cut growth has increased substantially since 2010 from 4.7 million m3 per year to 15.9 million m3 p.a. Over this period annual growth has increased by 35.5% whereas removals have decreased by 8.6%.
Annual growth vs. removals and surplus volume
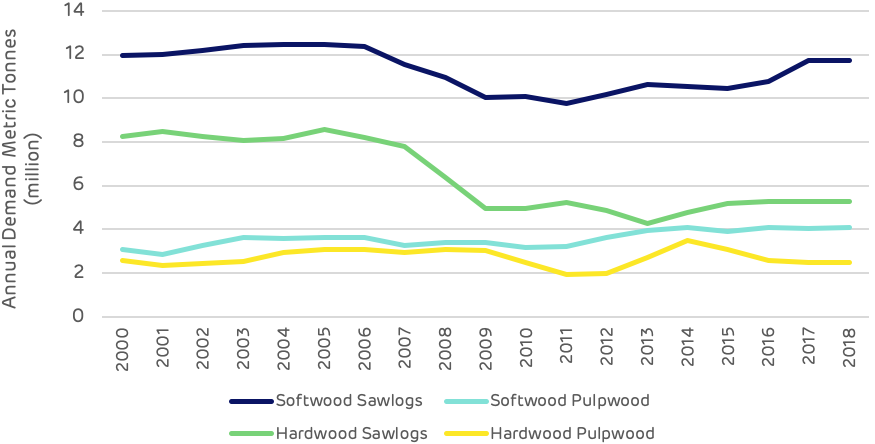
Demand for timber products has fluctuated since 2000. The global financial crisis in 2008-09 impacted all product categories, but particularly pine and hardwood saw-timber where there was a combined drop of over five million tonnes in 2010 compared to 2000. This was a loss of over 20% of total annual demand in the catchment area. Pine saw-timber has now recovered to pre-crisis levels, but hardwood demand has remained low. Hardwood pulpwood demand also declined around this time, with the closure and decline of existing pulp mills in the catchment area. Demand had fallen by one million tonnes p.a. by 2011 prior to the Enviva pellet mills opening. From 2012 the new biomass demand enabled the hardwood pulpwood market to recover to pre-crisis levels with demand in 2018 at almost exactly the same level as in 2000.
Annual demand by product category
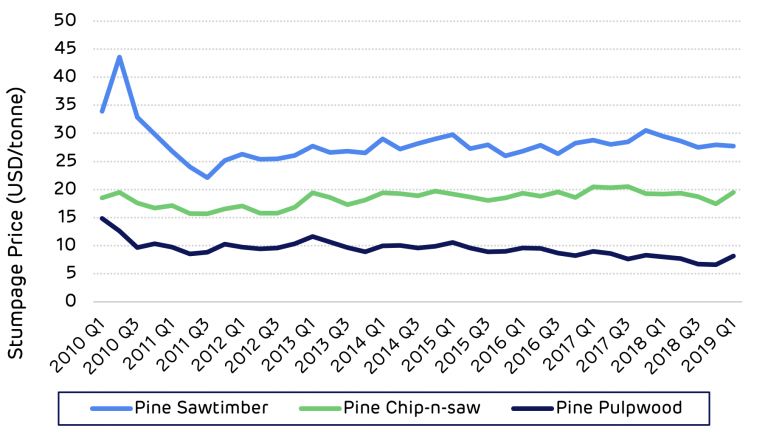
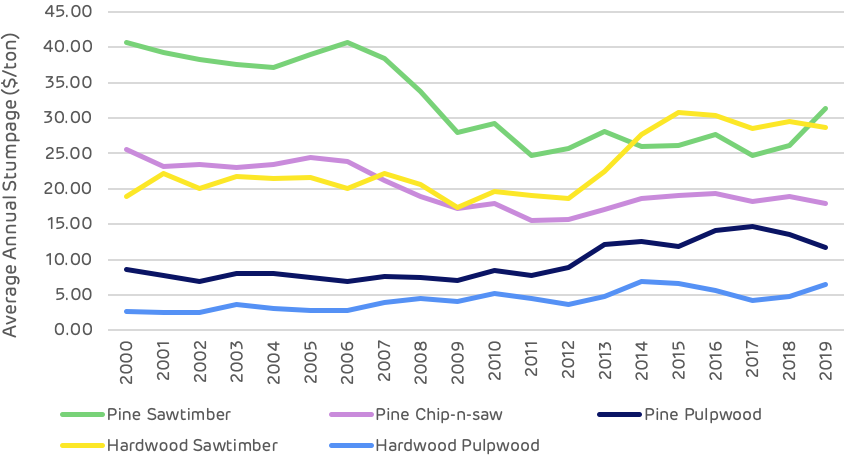
This fluctuation in demand is reflected in the average annual stumpage price data shown on the chart below, this is the value that the forest owner gets for each product. The trends are generally as expected, with the exception of the hardwood saw-timber price, which has increased substantially despite a decrease in demand. This is due to supply chain issues, reduced capacity of loggers and access to land.
Average annual stumpage prices
Detailed below is an edited version of the consultant’s review and analysis of key issues in the catchment area.
The full version can be found in the main report.
Is there any evidence that bioenergy demand has caused the following?
Deforestation
No. US Forest Service (USFS) data shows the opposite. The total area of timberland in the Enviva Chesapeake catchment area has increased an estimated 82,818 hectares (+1.8%) since Enviva Pellets Ahoskie commenced full production in 2012.
A change in management practices (rotation lengths, thinnings, conversion from hardwood to pine)?
No / Inconclusive. Changes in management practices have occurred in the catchment area since 2012, but there is little evidence to suggest that bioenergy demand has caused these changes. Conversion of hardwood and mixed pine-hardwood timberland to planted pine timberland has occurred in the catchment area.
Diversion from other markets
No / Inconclusive. Since 2012, pulpwood demand not attributed to bioenergy has decreased 19%; however, this decrease is largely attributed to decreased demand from the pulp/paper sector. Also, demand for softwood and hardwood sawlogs have increased an estimated 14% and 7%, respectively, since 2012.
An unexpected increase in wood prices
No / Inconclusive. The increase in hardwood biomass demand coincided with price increases of 10-24% for delivered hardwood pulpwood. These price increases were likely linked to a combination of both supply chain issues (shortage of local loggers following pulp/paper mill closures in the region) and elevated prices offered by Enviva to ensure guaranteed wood supply for the first several years of operation, as prices for delivered hardwood pulpwood and hardwood chips proceeded to decline 16% and 9%, respectively, from 2014 to2017 once the market stabilised.
Since 2014, prices for pine products have held flat even though softwood raw material purchases (demand) by Enviva have more than doubled. In this catchment area, changes in pine pulpwood and pine chip prices are largely driven by demand attributed to the pulp/paper sector.
A reduction in growing stock timber
No. Total growing stock inventory in the catchment area increased 19% from 2012 through 2018. Over this period, inventories increased as follows for each of the five major timber products: +33% for pine sawtimber, +23% for pine chip-n-saw, +14% for pine pulpwood, +12% for hardwood sawtimber, and +14% for hardwood pulpwood.
The increase in timber inventory can be linked to a combination of increased forest area (additional hectares = additional inventory) and annual harvest levels below the sustainable yield capacity of the catchment area forest (i.e. annual growth has continued to exceed annual removals, resulting in increased inventory levels).
A reduction in the sequestration rate of carbon
No. US Forest Service data shows the average annual growth rate of growing stock timber has increased slightly since 2012. Increased timber growth rates/carbon sequestration rates can be linked to a combination of changes in species composition and silvicultural practices.
Softwood (pine) grows at a much quicker rate compared to hardwood species, and in the Enviva Chesapeake catchment area, pine timberland area increased from 43.6% of total timberland area in 2011 to 46.0% in 2018. Also, improvements in silviculture have continued to enhance growth and overall productivity. Together, these factors help explain how average per hectare volume growth increased from 5.9 m3 in 2011 to 7.7 m3 in 2018.
An increase in harvesting above the sustainable yield capacity of the forest area
No. In 2018, the latest available, growth-to-removals ratio for pine and hardwood pulpwood, the timber products utilised by bioenergy, equalled 2.49 and 2.76, respectively (a value greater than 1.0 indicates sustainable harvest levels). Even with the increased harvesting required to satisfy bioenergy demand, harvest levels remain well below the sustainable yield capacity of the catchment forest area.
What has been the impact of bioenergy demand on?
Timber growing stock inventory
Neutral. Total wood demand increased an estimated 14% from 2012-2018, and much of that increase can be attributed to increased demand from bioenergy. In this catchment area, inventories are so substantial that increases in demand from bioenergy, as well as from other sources, have not been great enough to offset annual timber growth. Total growing stock inventory has continued to increase – an average of 2.9% per year since Enviva first entered this market in 2012.
Timber growth rates
Neutral. Timber growth rates have increased for pine sawtimber, pine chip-n-saw, pine pulpwood, and hardwood pulpwood since 2012; hardwood sawtimber growth rates have declined slightly. Evidence suggests these overall increases in growth rates are linked to changes in age class distribution (i.e. a younger forest), not due to changes in bioenergy demand
Forest area
Positive / Neutral. Total forest (timberland) area in the catchment area increased nearly 83,000 hectares (+1.8%) from 2012 through 2018, the latest available. Our analysis of biomass demand and forest area found a strong positive correlation between these two variables but also a moderately strong correlation between softwood sawlog demand and forest area.
Wood prices
Neutral / Negative. The additional wood demand placed on this market by Enviva from 2012-2014 coincided with a 19% increase in delivered pine pulpwood price and a 24% increase in delivered hardwood pulpwood price. Pine and hardwood chip prices also increased 10-11% over this period. Analysis found evidence that increases in hardwood pulpwood and hardwood chip prices can be linked to increases in total hardwood pulpwood demand. However, given that hardwood bioenergy demand has accounted for over 75% of total hardwood pulpwood demand in the catchment area since 2014, it is reasonable to conclude that hardwood pulpwood demand attributed to bioenergy has had some level of impact on delivered hardwood pulpwood and hardwood chip prices.
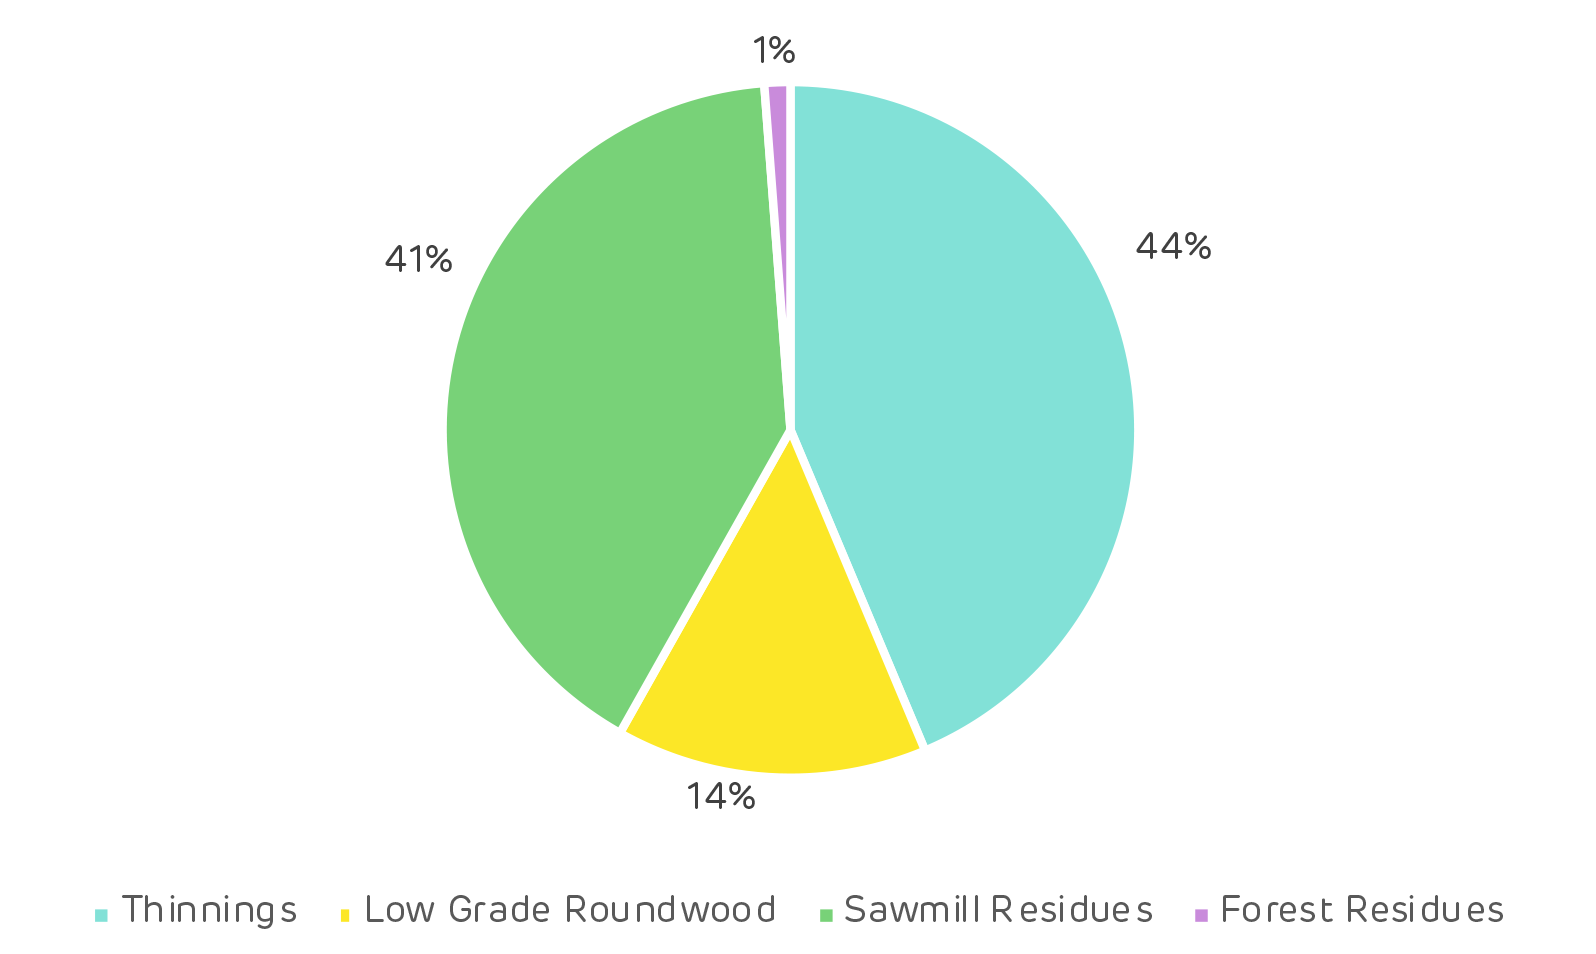
Markets for solid wood products
Positive. In the Enviva Chesapeake catchment area, demand for softwood and hardwood sawlogs used to produce lumber and other solid wood products increased 15% and 9%, respectively, from 2012-2018. A by-product of the sawmilling process are sawmill residuals – a material utilied by Enviva’s three mills to produce wood pellets. With the increased production of both softwood and hardwood lumber, so too has come an increase in sawmill residuals, some of which has been purchased/consumed by Enviva.
Not only has Enviva benefited from the greater availability of this by-product, but lumber producers have also benefited, as Enviva’s three mills have provided an additional outlet for these producers and their by-products.
Forest landowners
Positive. Increased demand attributed to bioenergy has been a positive for forest landowners in the Chesapeake catchment area. Not only has bioenergy provided an additional outlet for pulpwood (particularly hardwood pulpwood), but the increase in pulpwood prices as a result of an overall increase in both softwood and hardwood pulpwood demand has transferred through to landowners (improved compensation).
Specifically, since 2013 (the first year all three Enviva pellet mills were operating), hardwood pulpwood stumpage price – the price paid to landowners – has averaged roughly $5.60 per ton in the Chesapeake catchment area. This represents a 47% increase over the approximately $3.80 per ton averaged by hardwood pulpwood stumpage in the catchment area over the 10 years prior (2003-2012). Similarly, pine pulpwood stumpage price has averaged $12.95 per ton in the catchment area since 2013, up 67% from the 2003-2012 average of $7.75 per ton.


 It’s clear that care homes require extra support at this time. We are offering energy bill relief for more than 170 small care homes situated near our UK operations for the next two months, allowing them to divert funds to their other priorities such as PPE, food or carer accommodation.
![Reforestation in Estonia. * Note: Since 2014 it has not been compulsory for private and other forest owners to submit reforestation data. [Click to view/download]](https://www.drax.com/wp-content/uploads/2020/03/figure_3.13.png)
![Species mix in Estonian forests [Click to view/download]](https://www.drax.com/wp-content/uploads/2020/03/figure_3.3.png)
![Comparison of sawlog and pulpwood prices [click to view/download]](https://www.drax.com/wp-content/uploads/2020/03/Picture-1.pdf2_-1.png)