


Today we completed a transformational deal – our acquisition of Canadian biomass pellet producer Pinnacle Renewable Energy.
I’m very excited about this important acquisition and welcoming our new colleagues to the Drax family – together we will build on what we have already achieved, having become the biggest decarbonisation project in Europe and the UK’s largest single site renewable power generator as a result of us using sustainable biomass instead of coal.
The deal positions Drax as the world’s leading sustainable biomass generation and supply business – making us a truly international business, trading biomass from North America to Europe and Asia. It also advances our strategy to increase our self supply, reduces our biomass production costs and creates a long-term future for sustainable biomass – a renewable energy source that the UN’s IPCC says will be needed to achieve global climate targets.
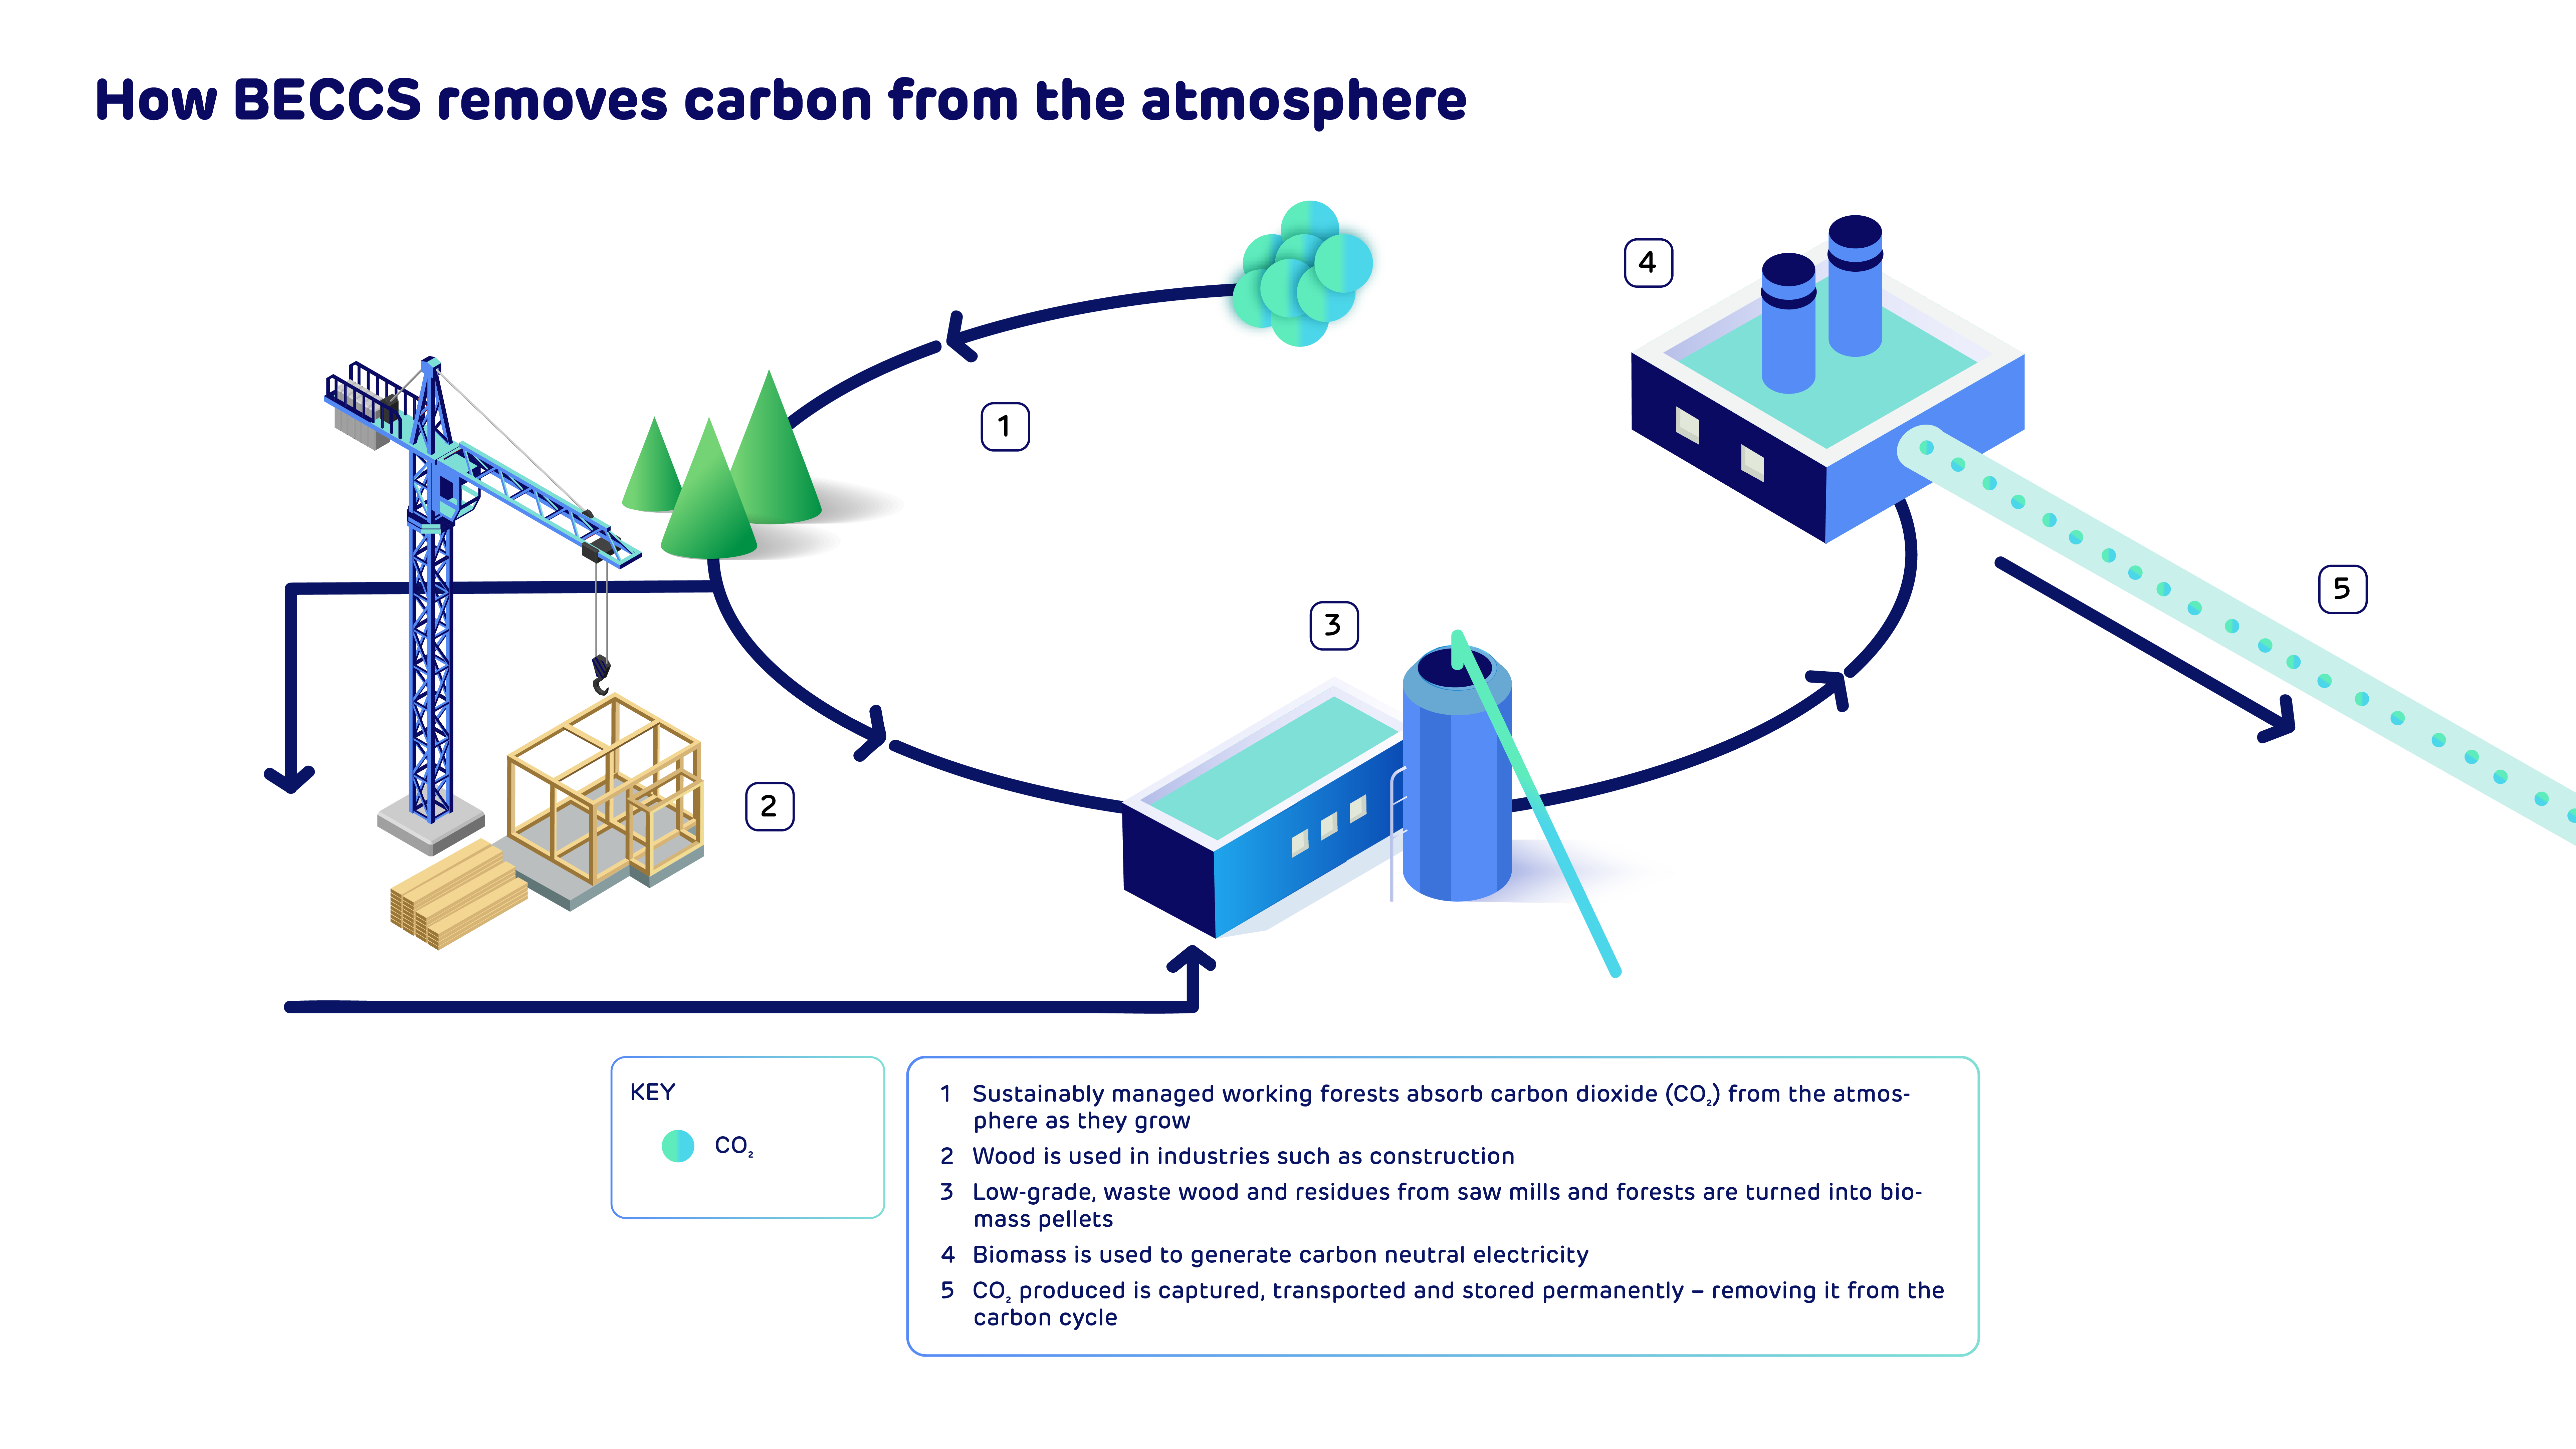
It’s also an important milestone in Drax’s ambition to become a carbon negative company by 2030 and play an important role in tackling the global climate crisis with our pioneering negative emissions technology BECCS.
That’s because increasing our annual production capacity of sustainable biomass while also reducing costs helps pave the way for our plans to use bioenergy with carbon capture and storage (BECCS) at Drax.
Negative emissions from BECCS are vital to address the global climate emergency while also providing the renewable electricity needed for a net zero economy, supporting jobs and clean growth in a post-Covid recovery.
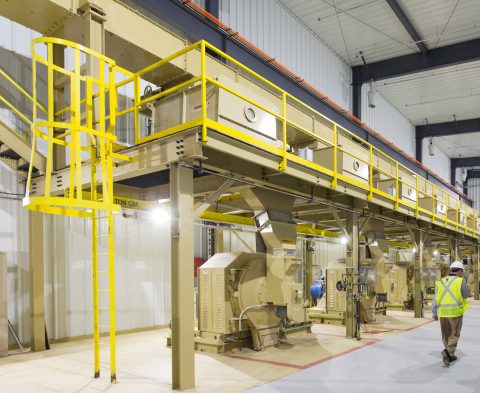
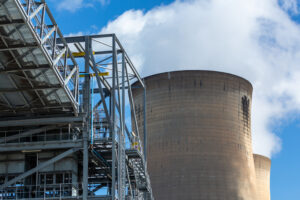
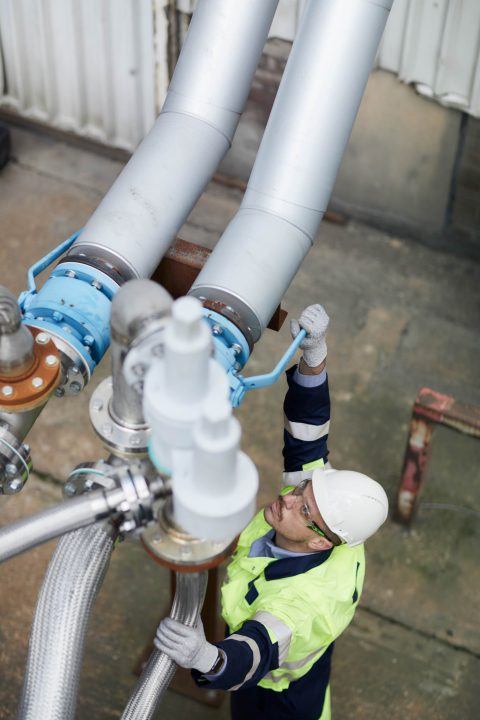
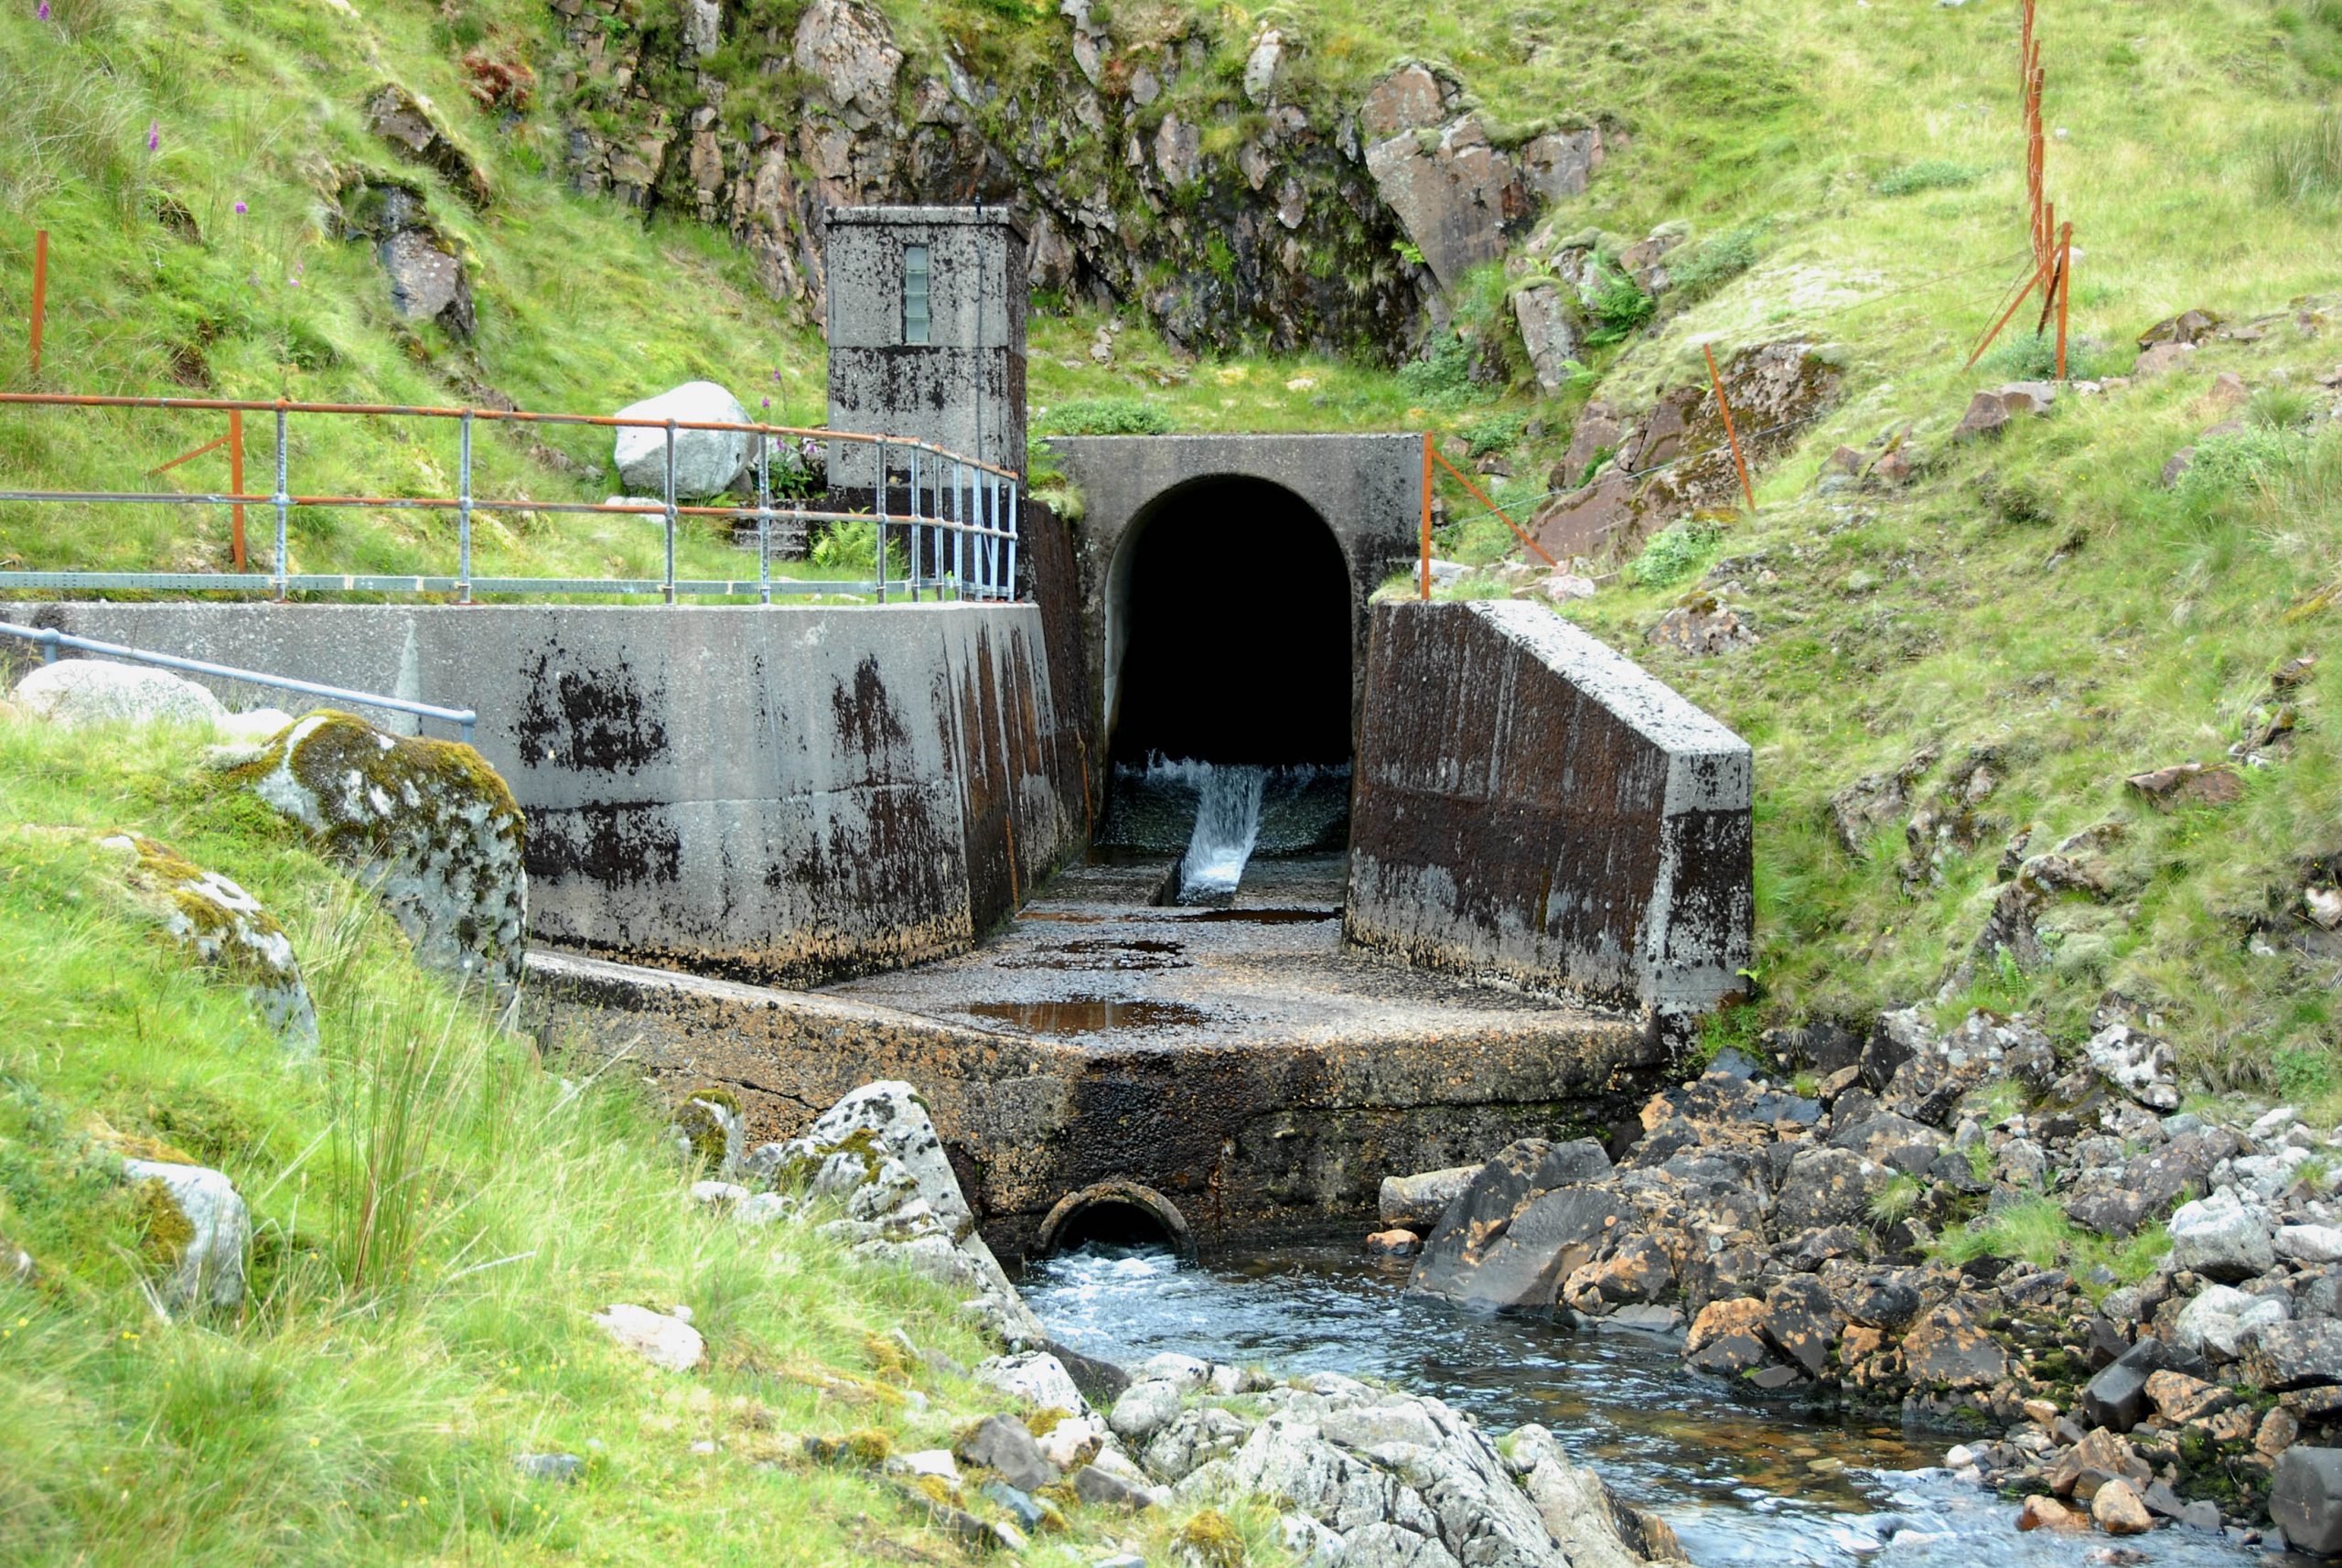
Inside a Pinnacle pellet mill
We already know Pinnacle well – it is one of our key suppliers and the company is a natural fit with Drax.
Our new colleagues have a wealth of operational and commercial expertise so I’m looking forward to seeing what we can achieve together.
We will benefit from Pinnacle’s scale, operational efficiency and low-cost fibre sourcing, that includes a high proportion of sawmill residues. In 2019, Pinnacle’s production cost was 20% lower than Drax’s.
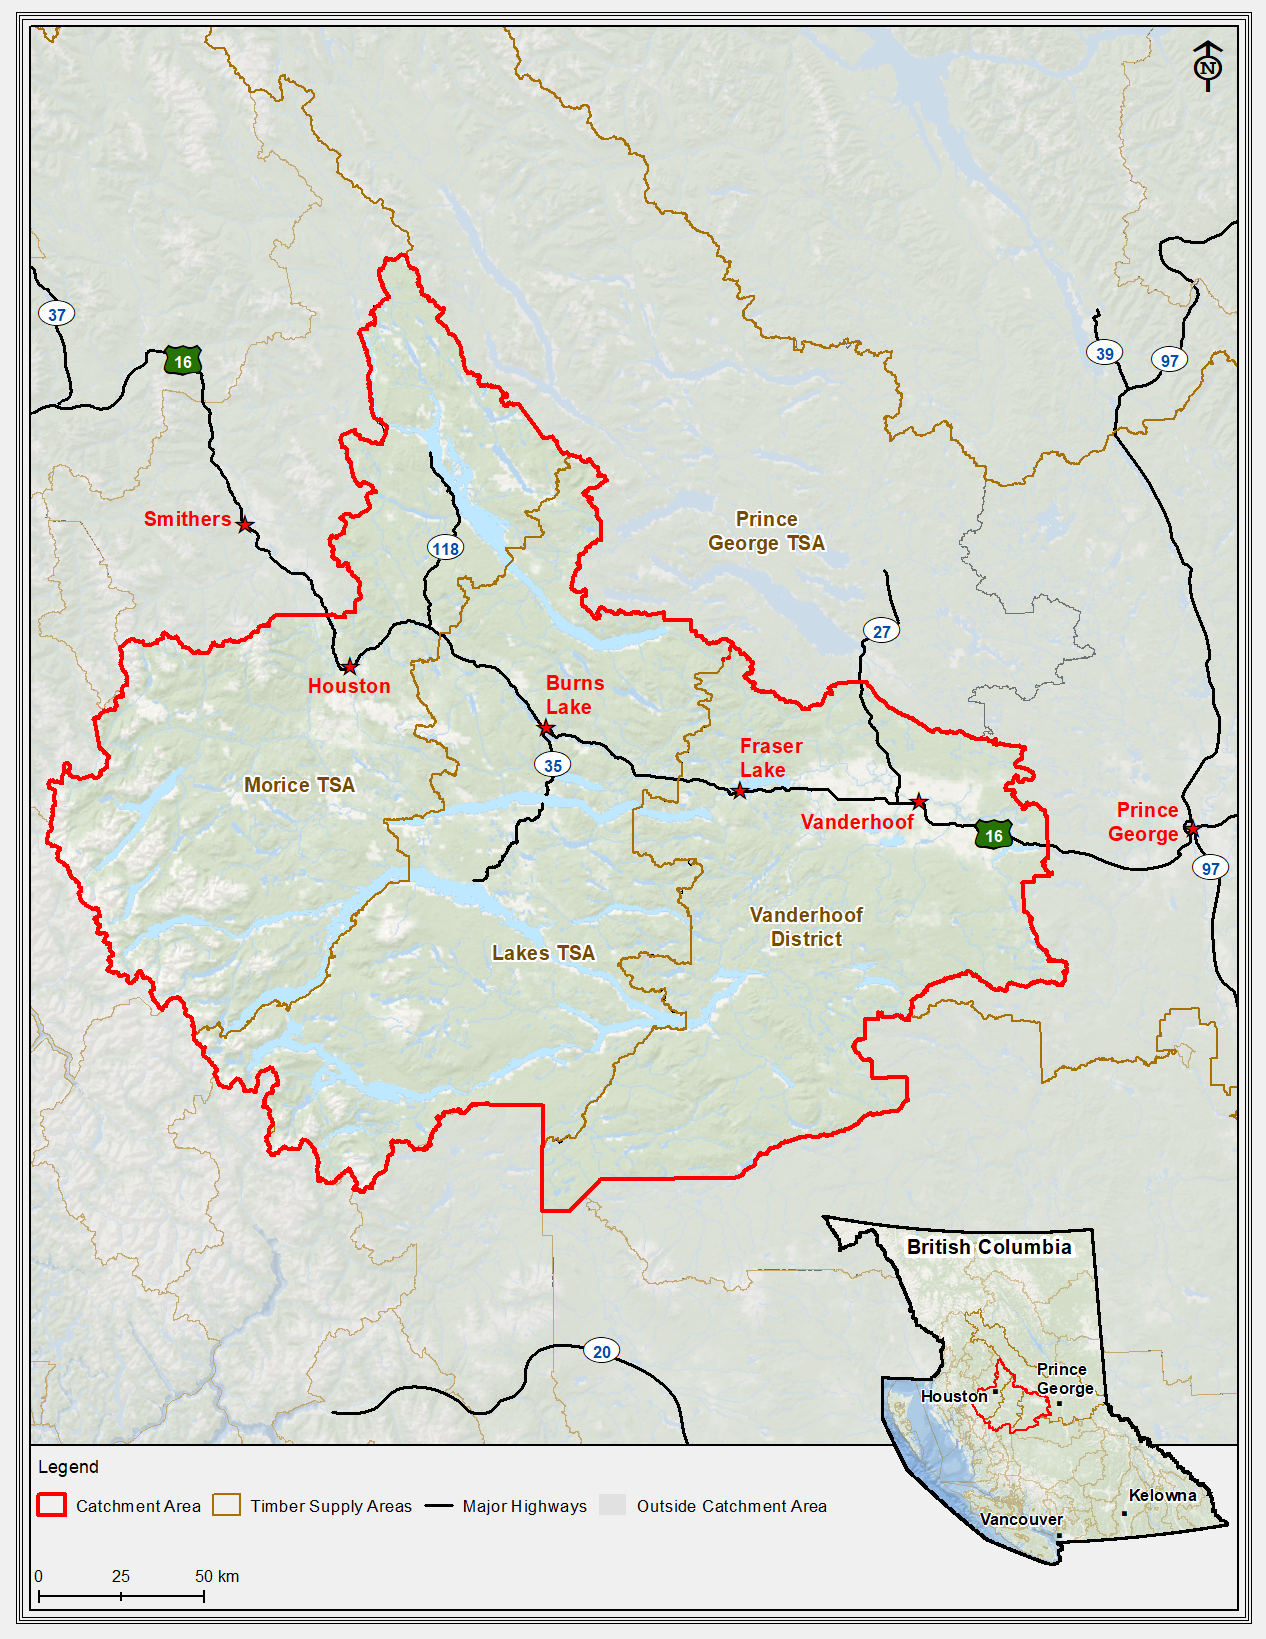
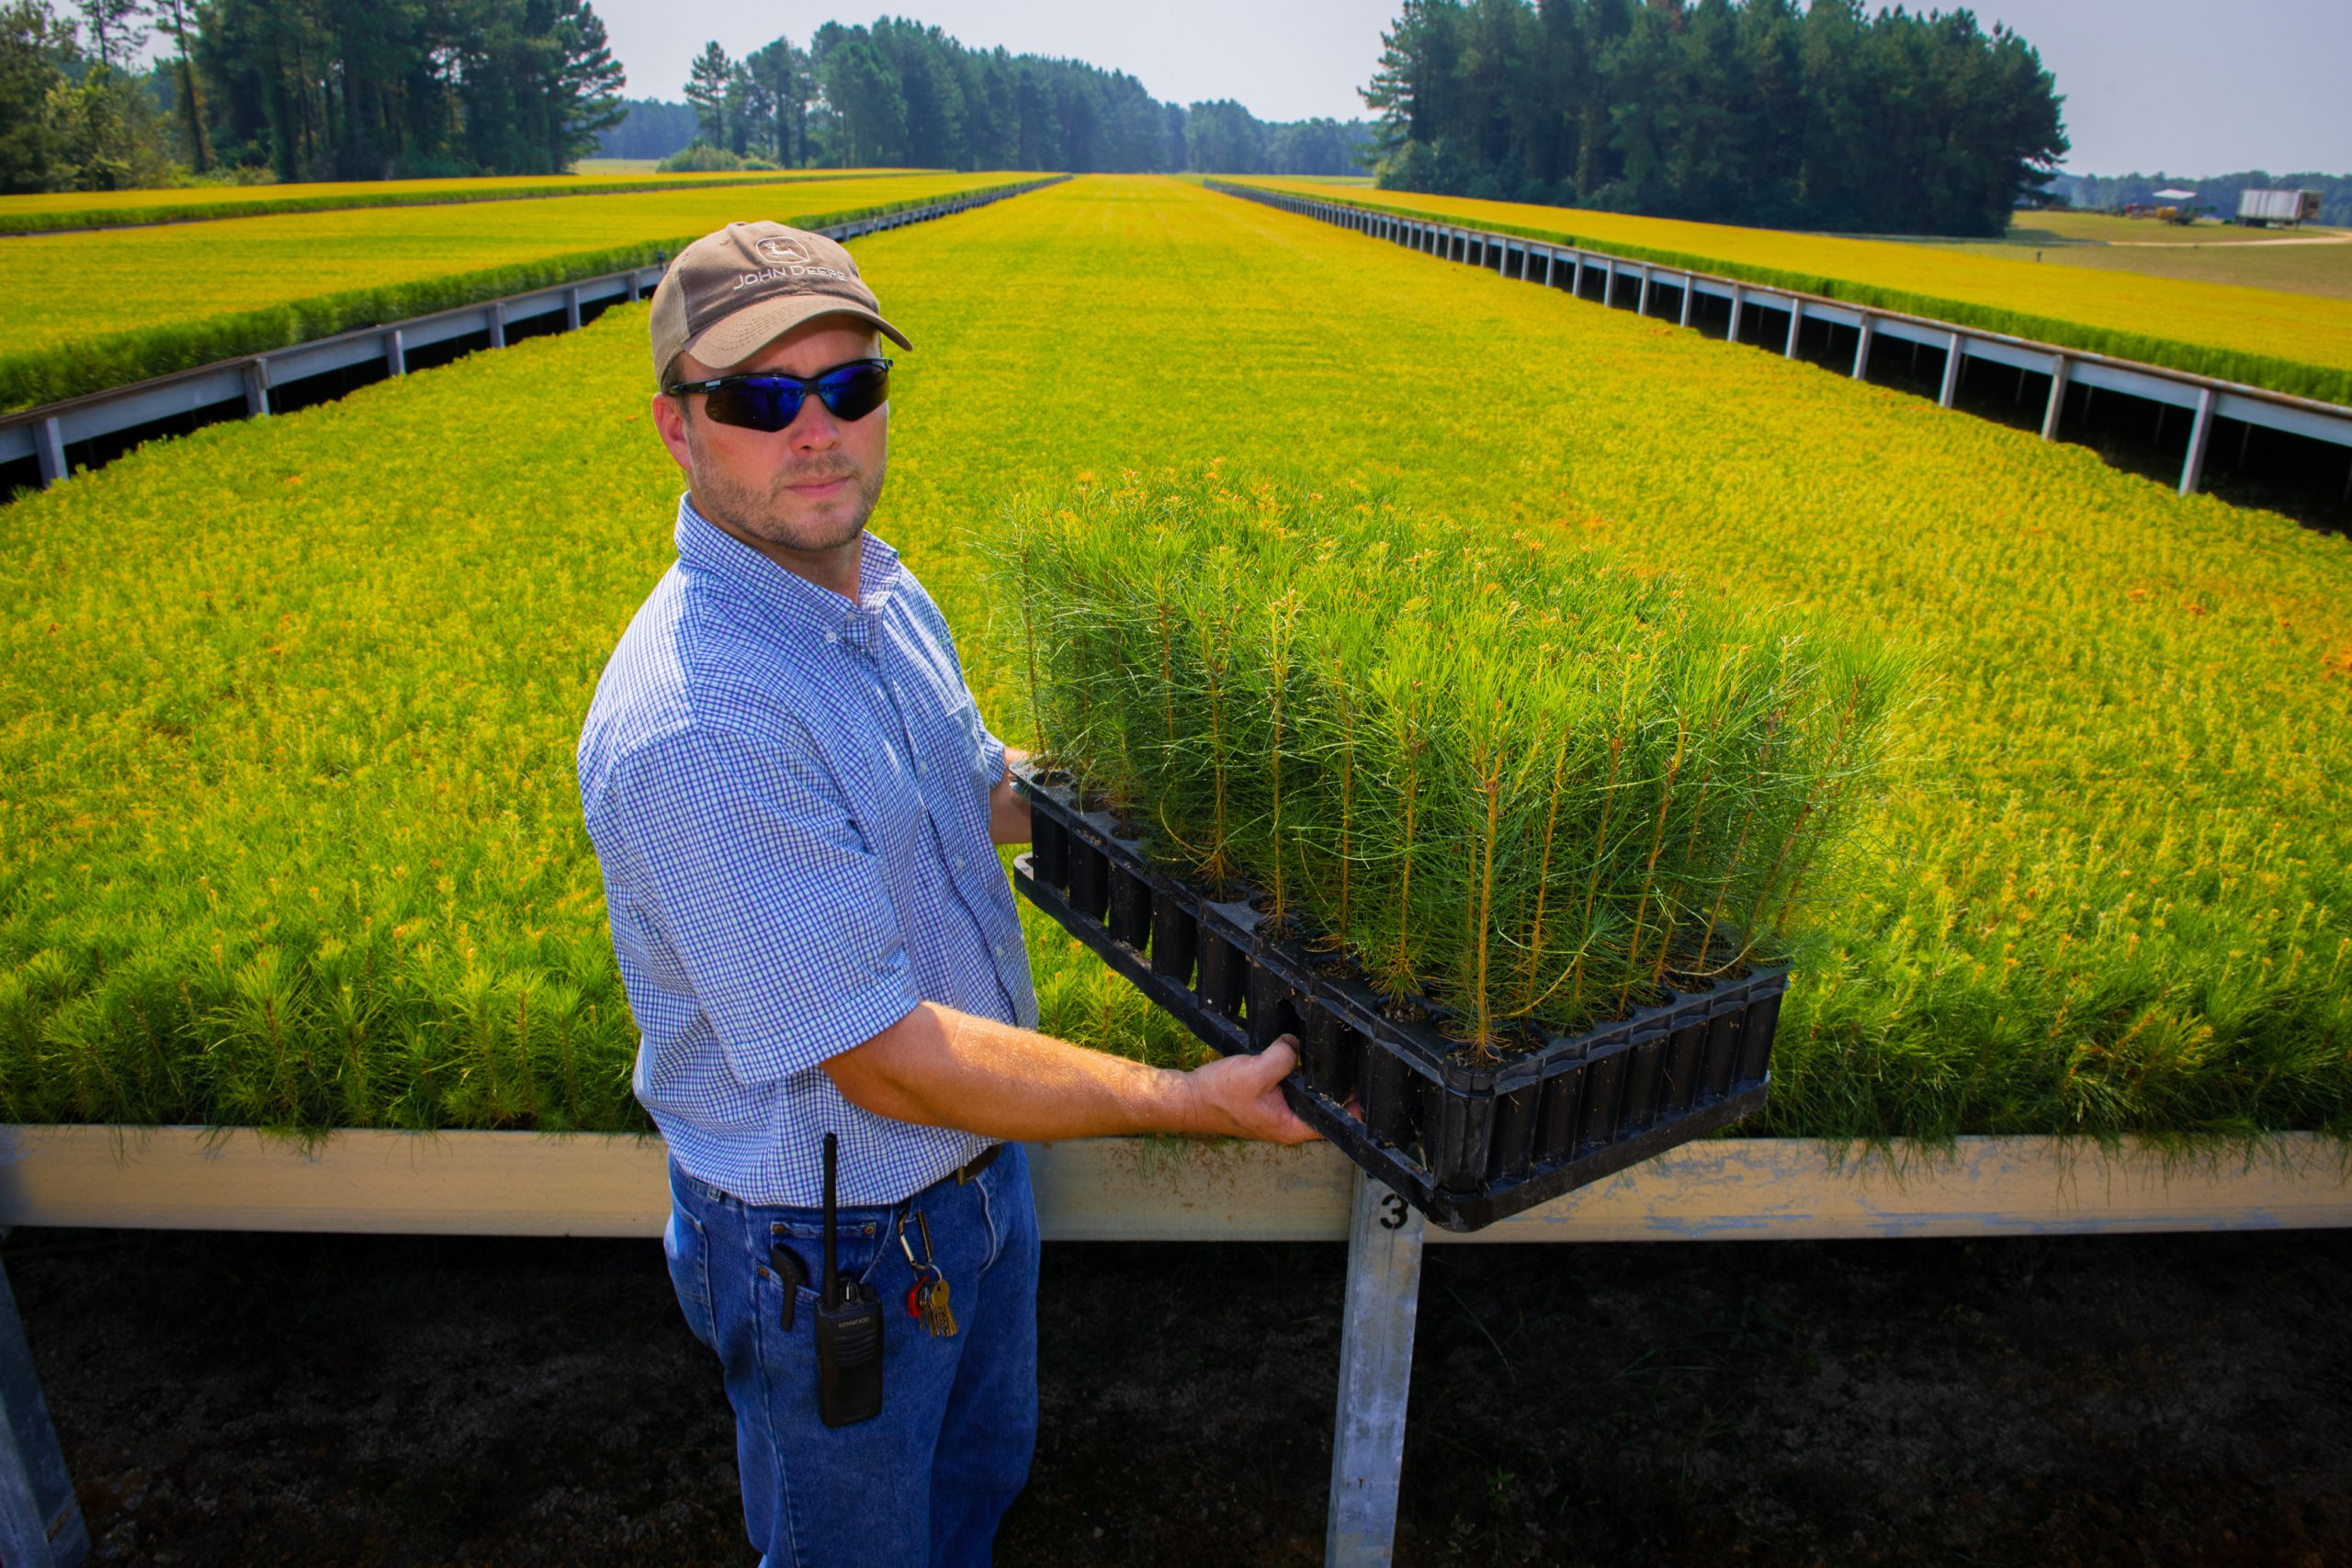
Completing this deal will increase our annual production capacity to 4.9 million tonnes of sustainable biomass pellets at 17 plants in locations across Western Canada and the US South – up from 1.6Mt now.
It also expands our access to three major North American fibre baskets and four export facilities, giving us a large and geographically diversified asset base, which enhances our sourcing flexibility and security of supply.
This positions us well to take advantage of the global growth opportunities for sustainable biomass. The market for biomass wood pellets for renewable generation in Europe and Asia is expected to grow in the current decade, principally driven by demand in Asia.
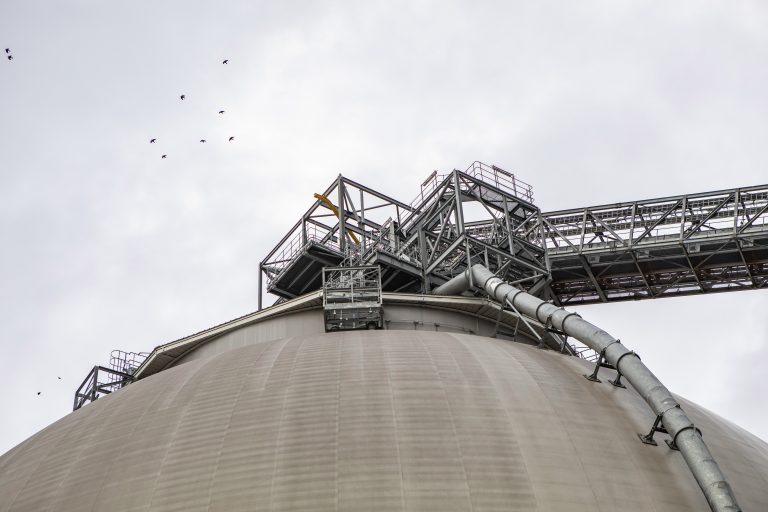
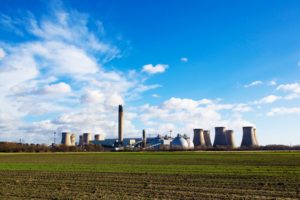
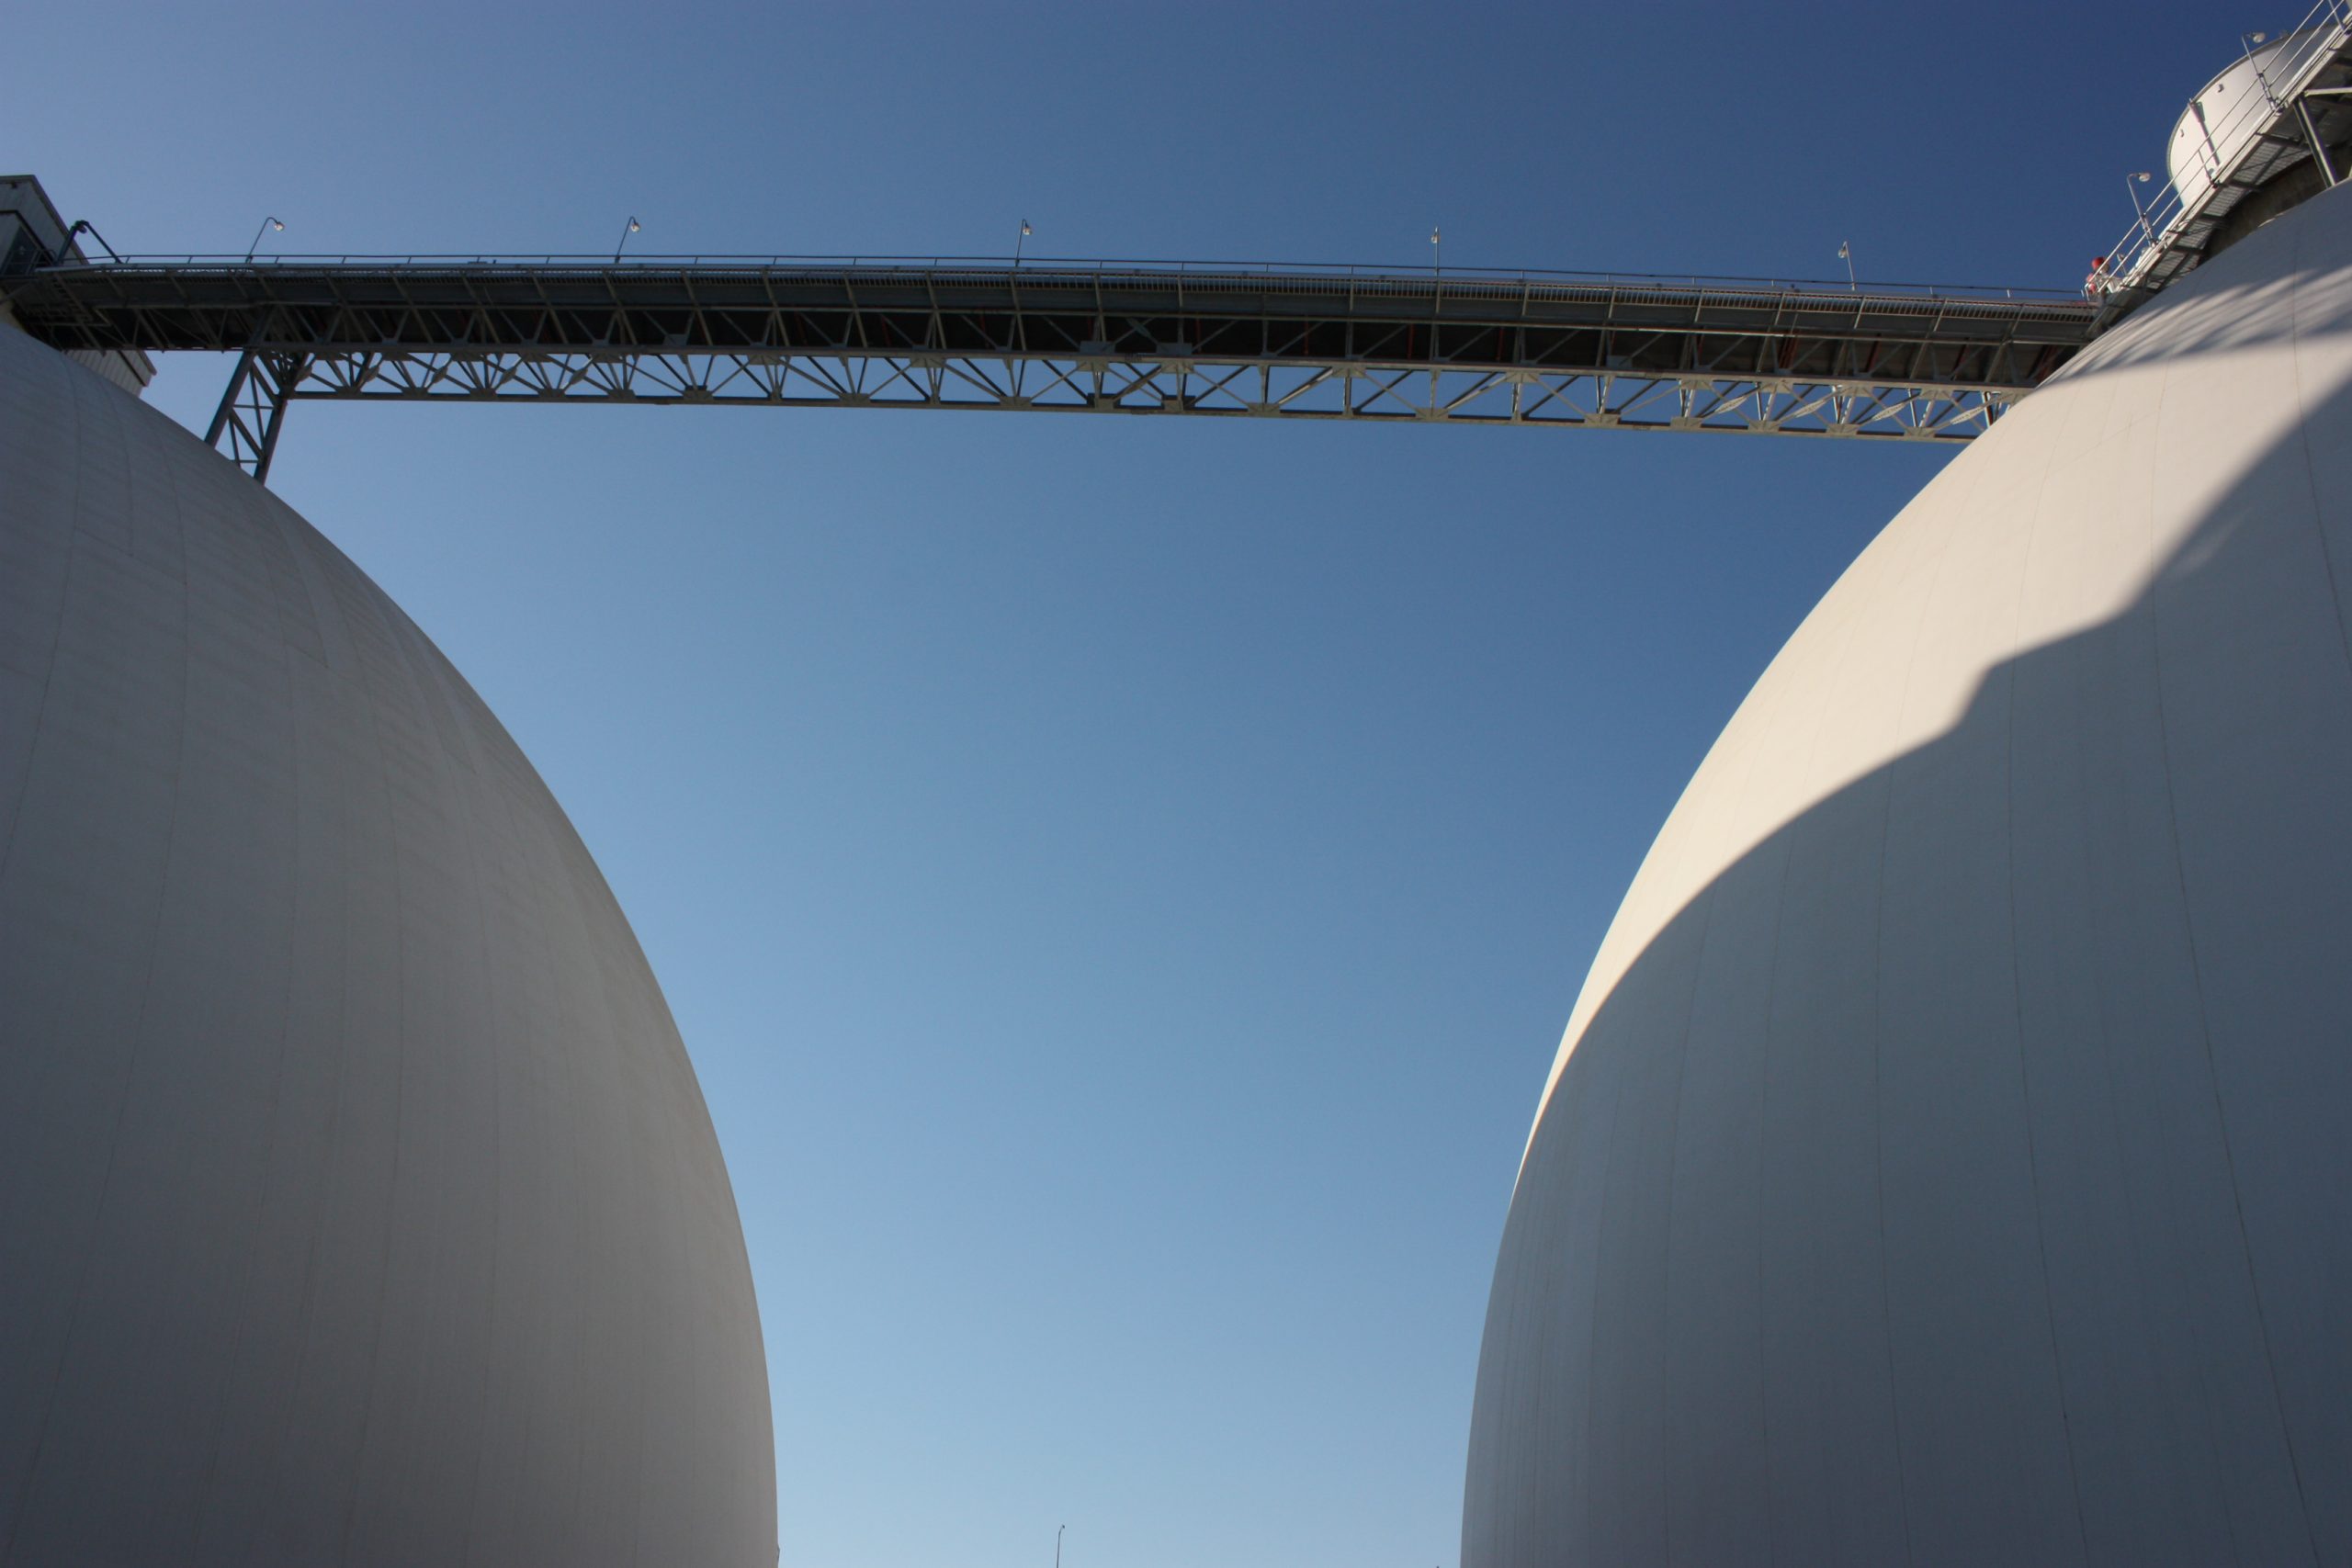
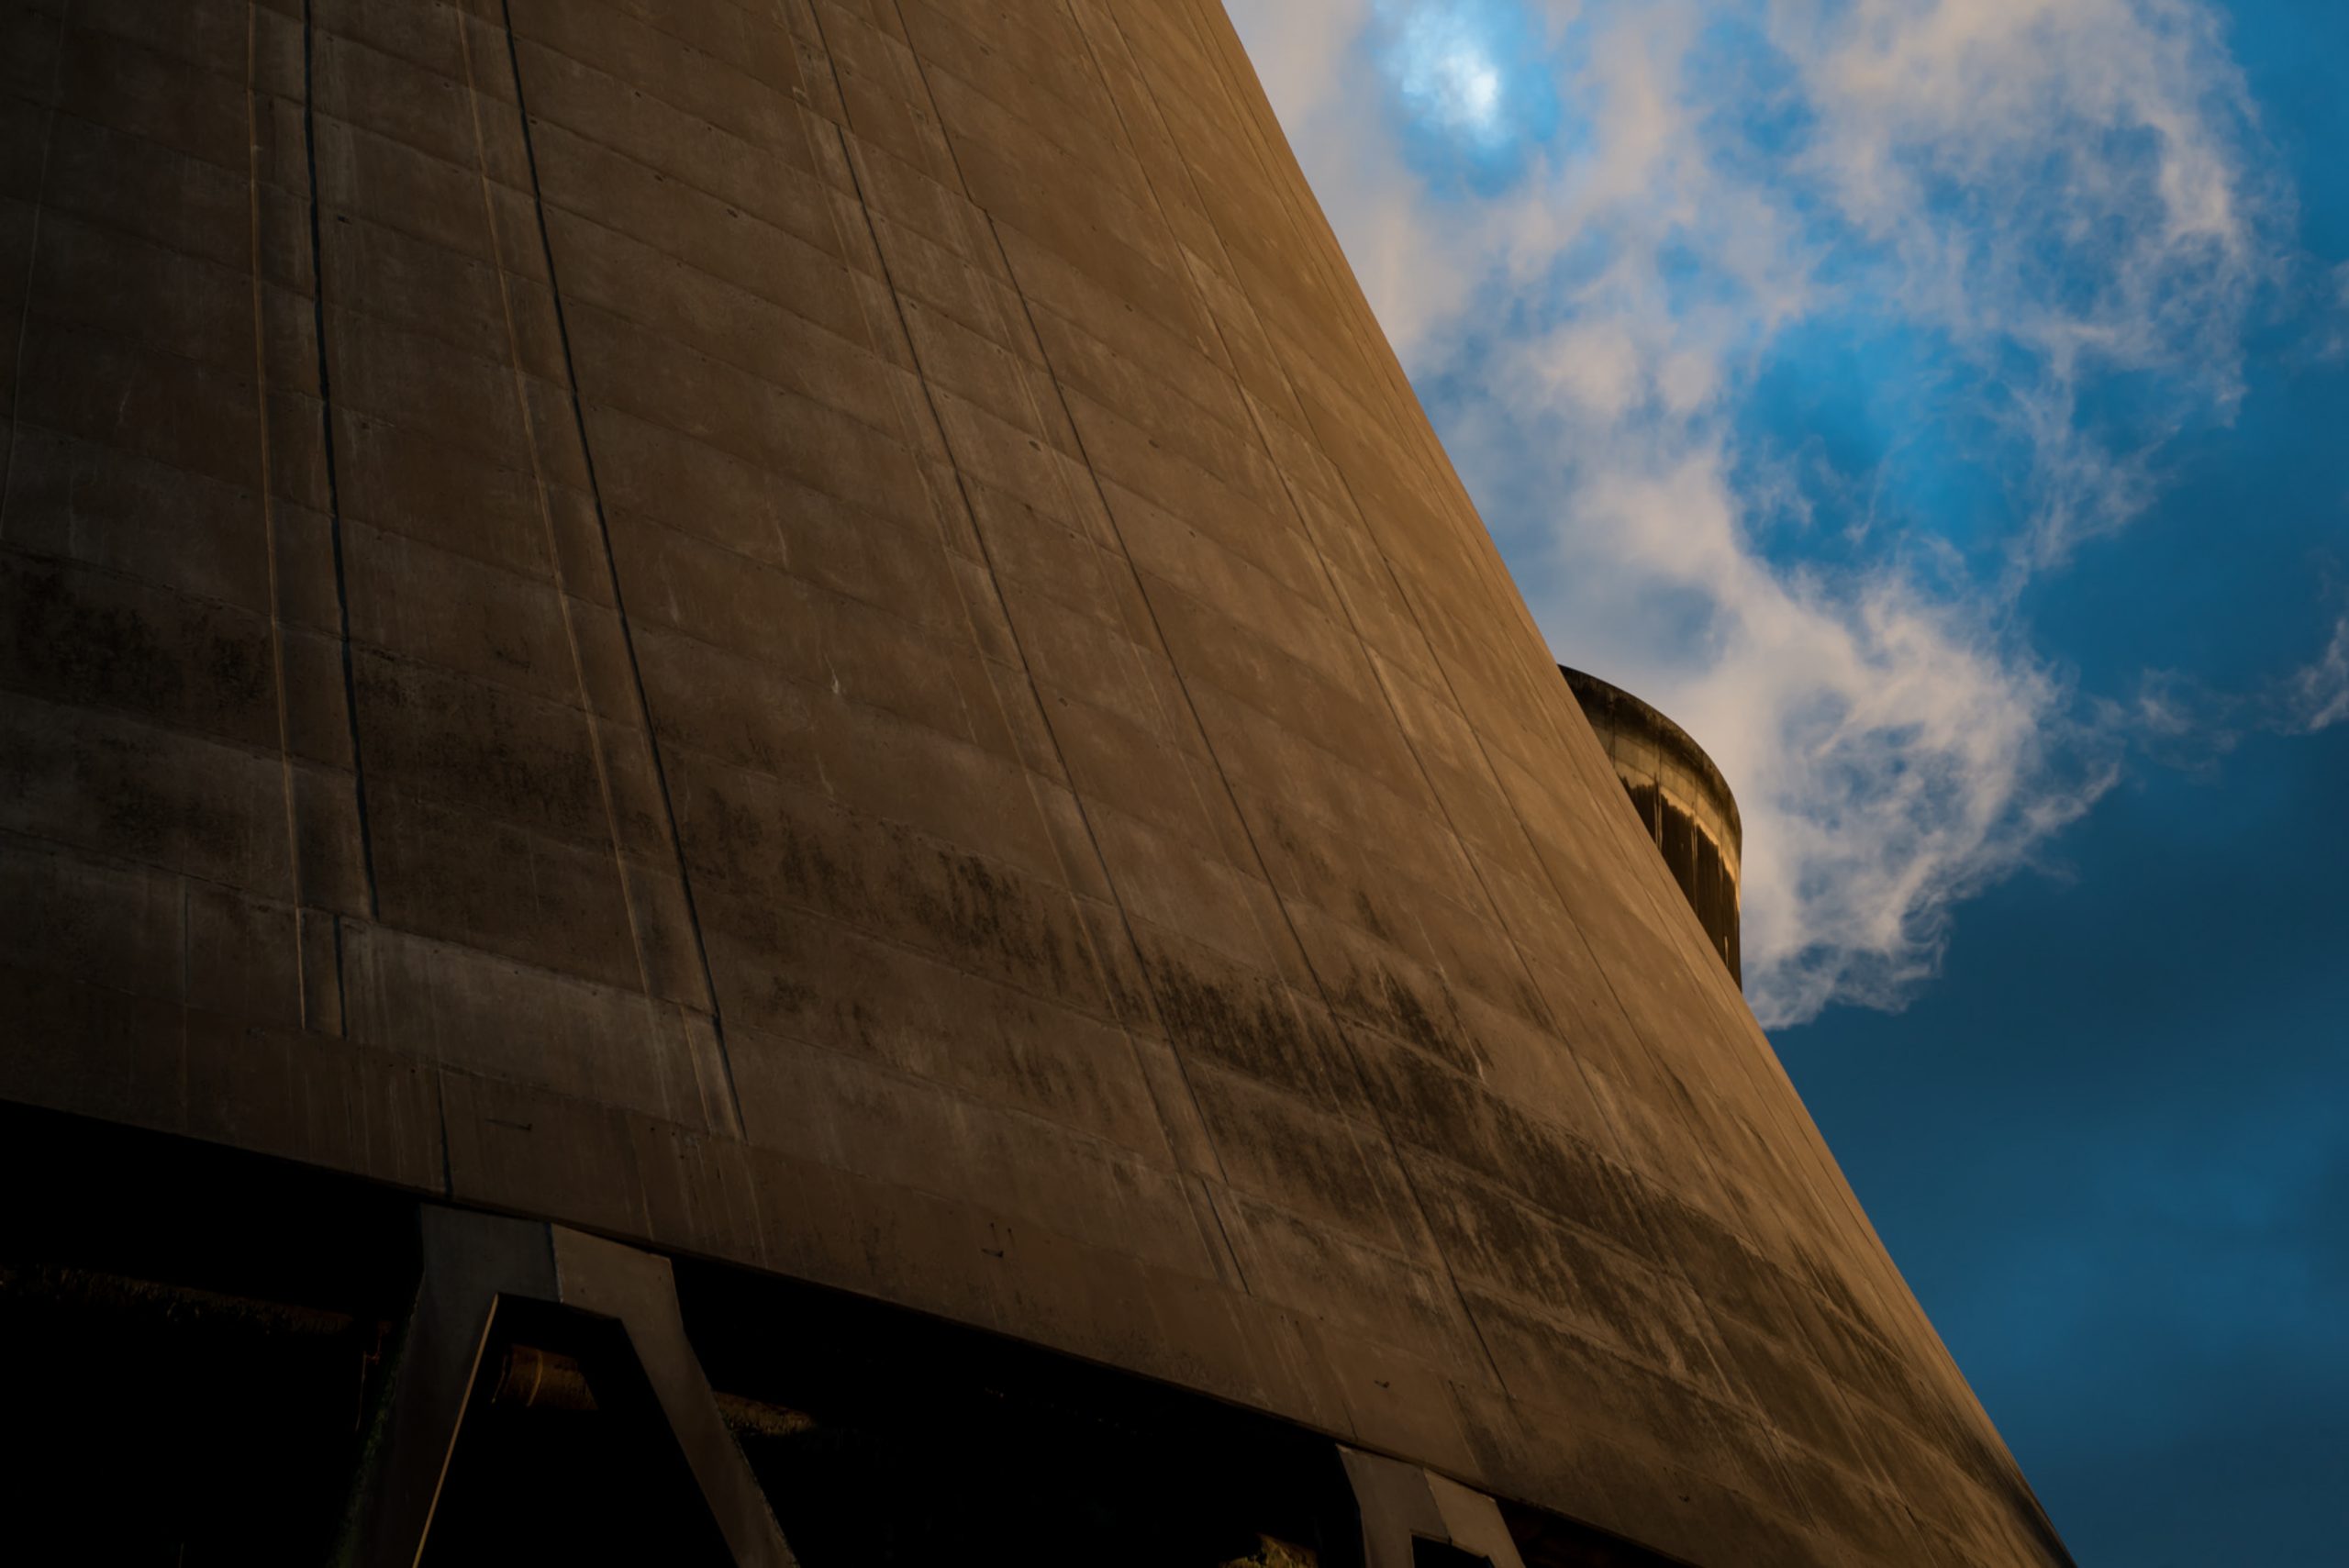
Biomass wood pellet storage dome, Drax Power Station
We believe that with increasingly ambitious global decarbonisation targets, the need for negative emissions and improved understanding of the role that sustainably sourced biomass can play, will result in continued robust demand.
Pinnacle is already a key supplier of wood pellets to other markets with C$6.7 billion of long-term contracts with high quality Asian and European customers, including Drax, and a significant volume contracted beyond 2027.
Drax aims to leverage Pinnacle’s trading capability across its expanded portfolio. We believe that the enlarged supply chain will provide greater opportunities to optimise the supply of biomass from its own assets and third-party suppliers.
The transport and shipping requirements of the enlarged company will provide further opportunities to optimise delivery logistics, helping to reduce distance, time, carbon footprint and cost.
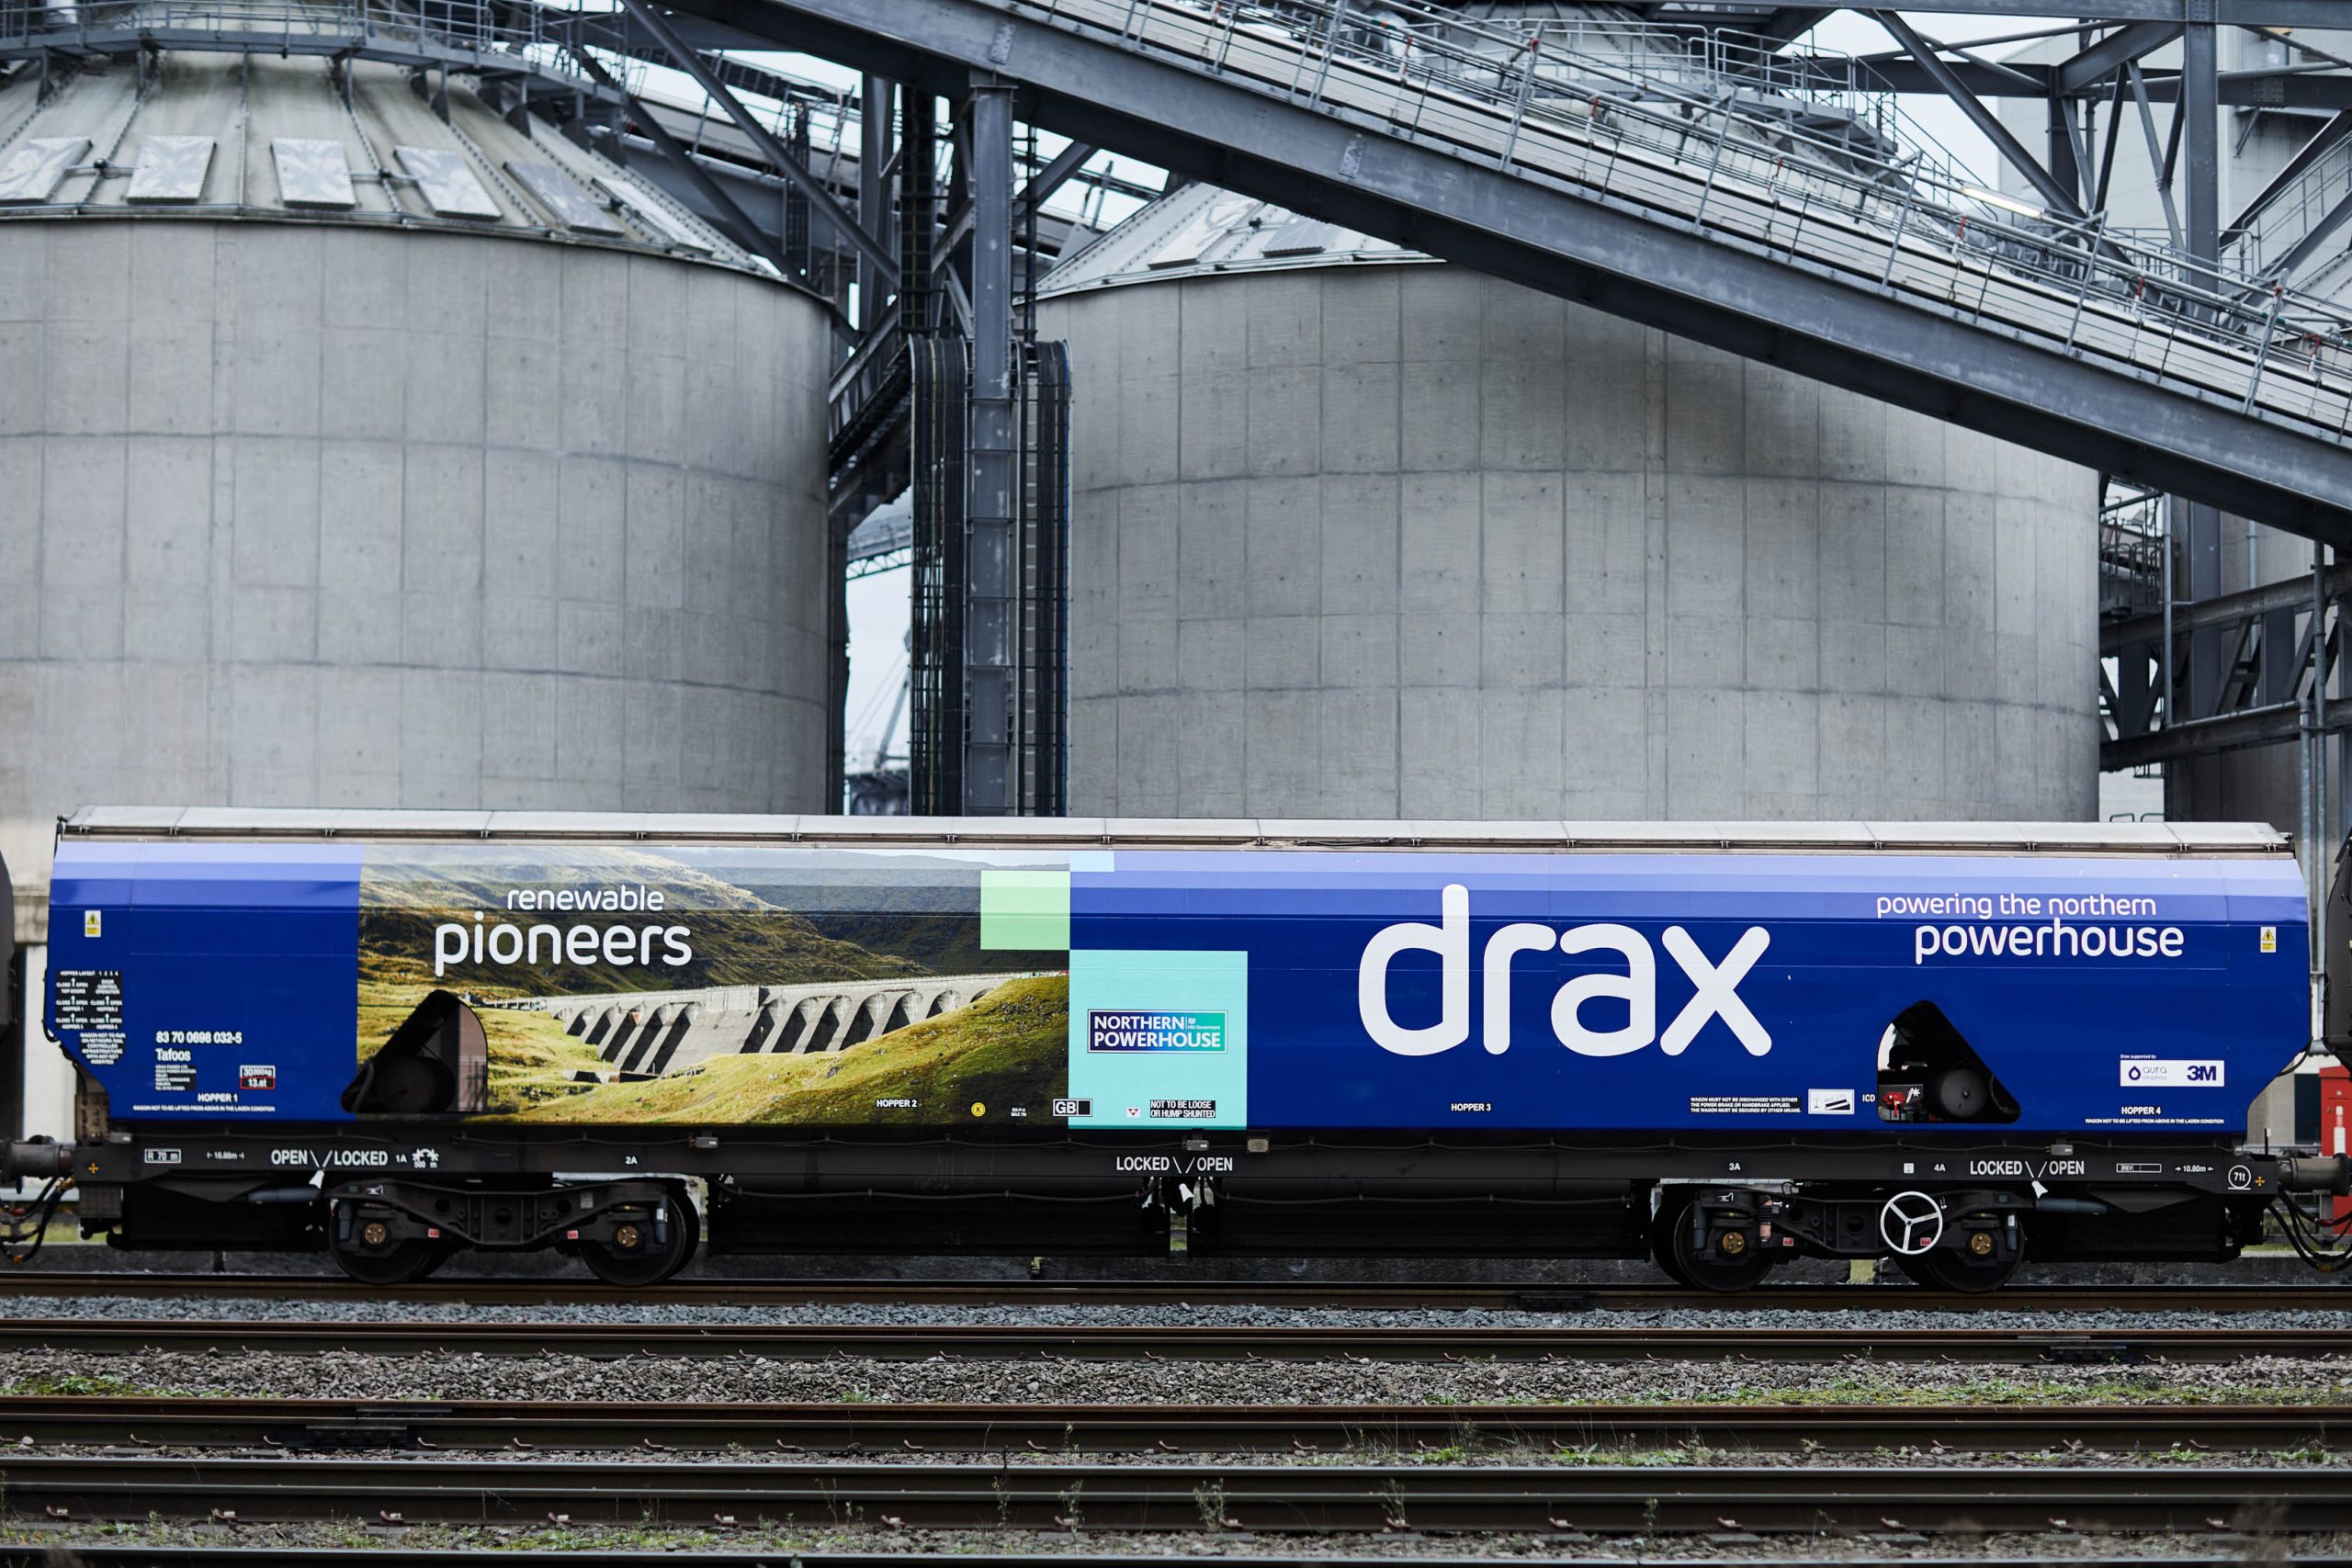
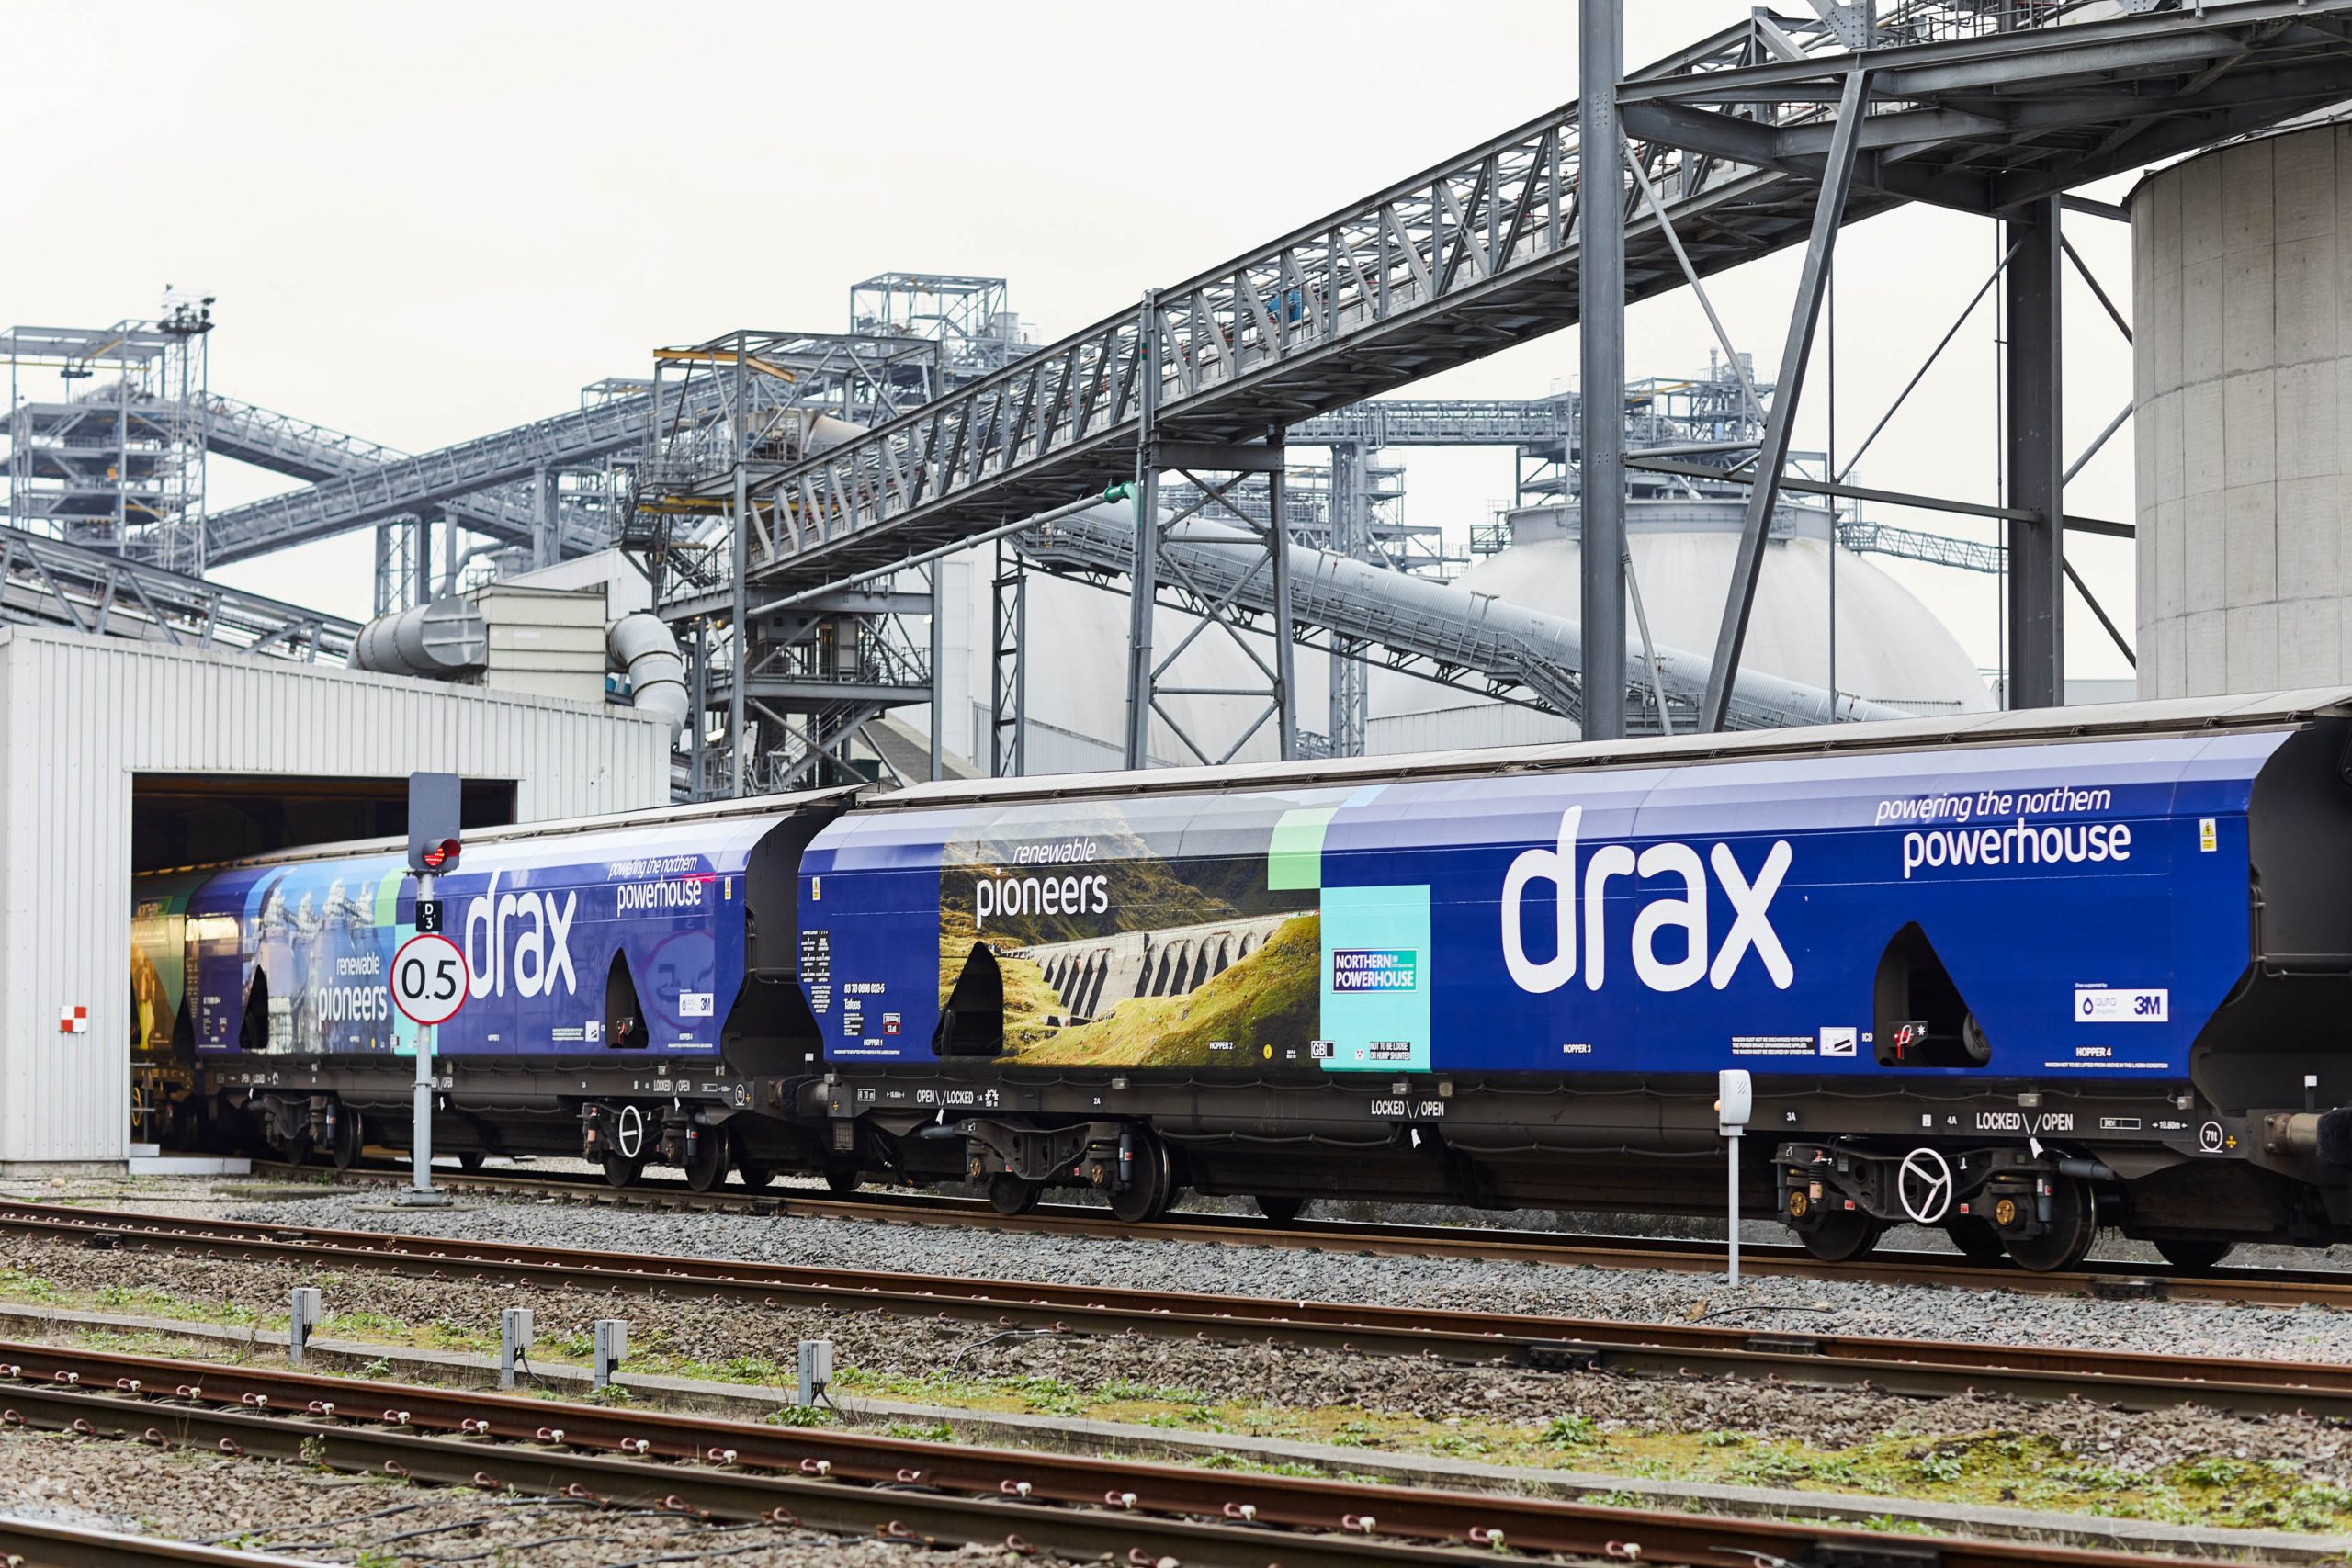
Train transporting biomass wood pellets arriving at Drax Power Station
Importantly – there will also be opportunities to share best practice and drive sustainability standards higher across the group.
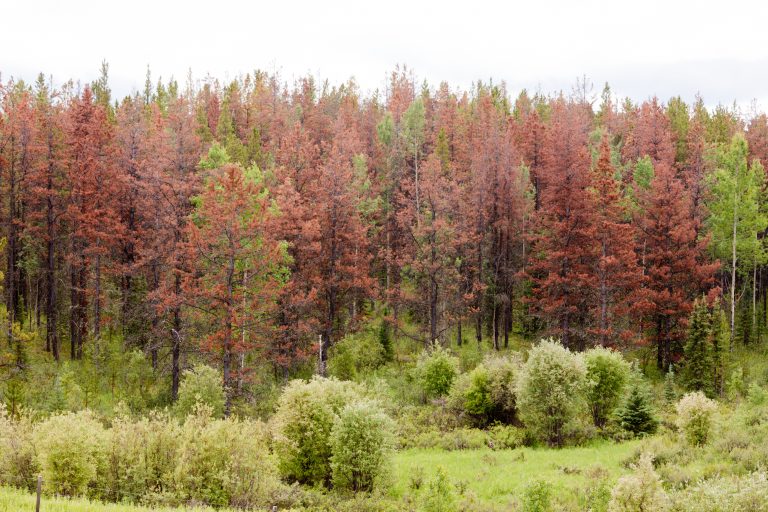
We recognise that the forest landscape in British Columbia and Alberta is different to the commercially managed forests in the south eastern US where we currently operate.
In line with our world leading responsible sourcing policy, Drax will work closely with environmental groups, Indigenous First Nation communities and other stakeholders and invest to deliver good environmental, social and climate outcomes in Pinnacle’s sourcing areas.
We are determined to create a long-term future for sustainable biomass and deliver BECCS – the negative emissions technology that will be needed around the world to meet global climate targets. The acquisition of Pinnacle takes us a big step forward in achieving our goals.
Read press release: Drax completes acquisition of Pinnacle Renewable Energy Inc.


 Adjusted EBITDA loss of £39 million (2019: £17 million profit) inclusive of estimated £60 million impact of Covid-19