Tag: sustainability

Full year results for the twelve months ended 31 December 2021

RNS Number : 6410C
Drax Group PLC
24 February 2022

Twelve months ended 31 December20212020
Key financial performance measures
Adjusted EBITDA (£ million) (1)(2)398412
Continuing operations378366
Discontinued operations – gas generation2046
Net debt (£ million) (3)1,044776
Adjusted basic EPS (pence) (1)26.529.6
Total dividend (pence per share)18.817.1
Total financial performance measures from continuing operations
Operating profit / (loss) (£ million)197(156)
Profit / (loss) before tax (£ million)122(235)

Will Gardiner, CEO of Drax Group, said:

Drax Group CEO Will Gardiner

Drax Group CEO Will Gardiner

“2021 was a transformational year for Drax as we became the world’s leading sustainable biomass generation and supply company, whilst continuing to invest in delivering positive outcomes for the climate, nature and people.

“Over the past ten years Drax has invested over £2 billion in renewable energy and has plans to invest a further £3 billion this decade, supporting the global transition to a low-carbon economy. Our investment has reduced our emissions from power generation by over 95% and we are the UK’s largest producer of renewable power by output. We are proud to be one of the lowest carbon intensity power generators in Europe – a significant transformation from being the largest coal power station in Western Europe.

“We have significantly advanced our plans for bioenergy with carbon capture and storage (BECCS) in the UK and globally. By 2030 we aim to deliver 12 million tonnes of negative emissions and lead the world in providing a critical technology which scientists agree is key to delivering the global transition to net zero.”

Financial highlights

  • Adjusted EBITDA £398 million (2020: £412 million)
  • Strong liquidity and balance sheet – £549 million of cash and committed facilities at 31 December 2021
    • Expect to be below 2x net debt to Adjusted EBITDA by the end of 2022
  • Total dividend – 10% increase to 18.8 pence per share (2020: 17.1 pence per share)
    • Proposed final dividend of 11.3 pence per share (2020: 10.3 pence per share)

Strategic highlights

  • Acquisition of Pinnacle Renewable Energy Inc. for C$385 million (£222 million) (enterprise value of C$796 million)
  • Sale of Combined Cycle Gas Turbine (CCGT) generation assets for £186 million
  • Development of the world’s leading sustainable biomass generation and supply company
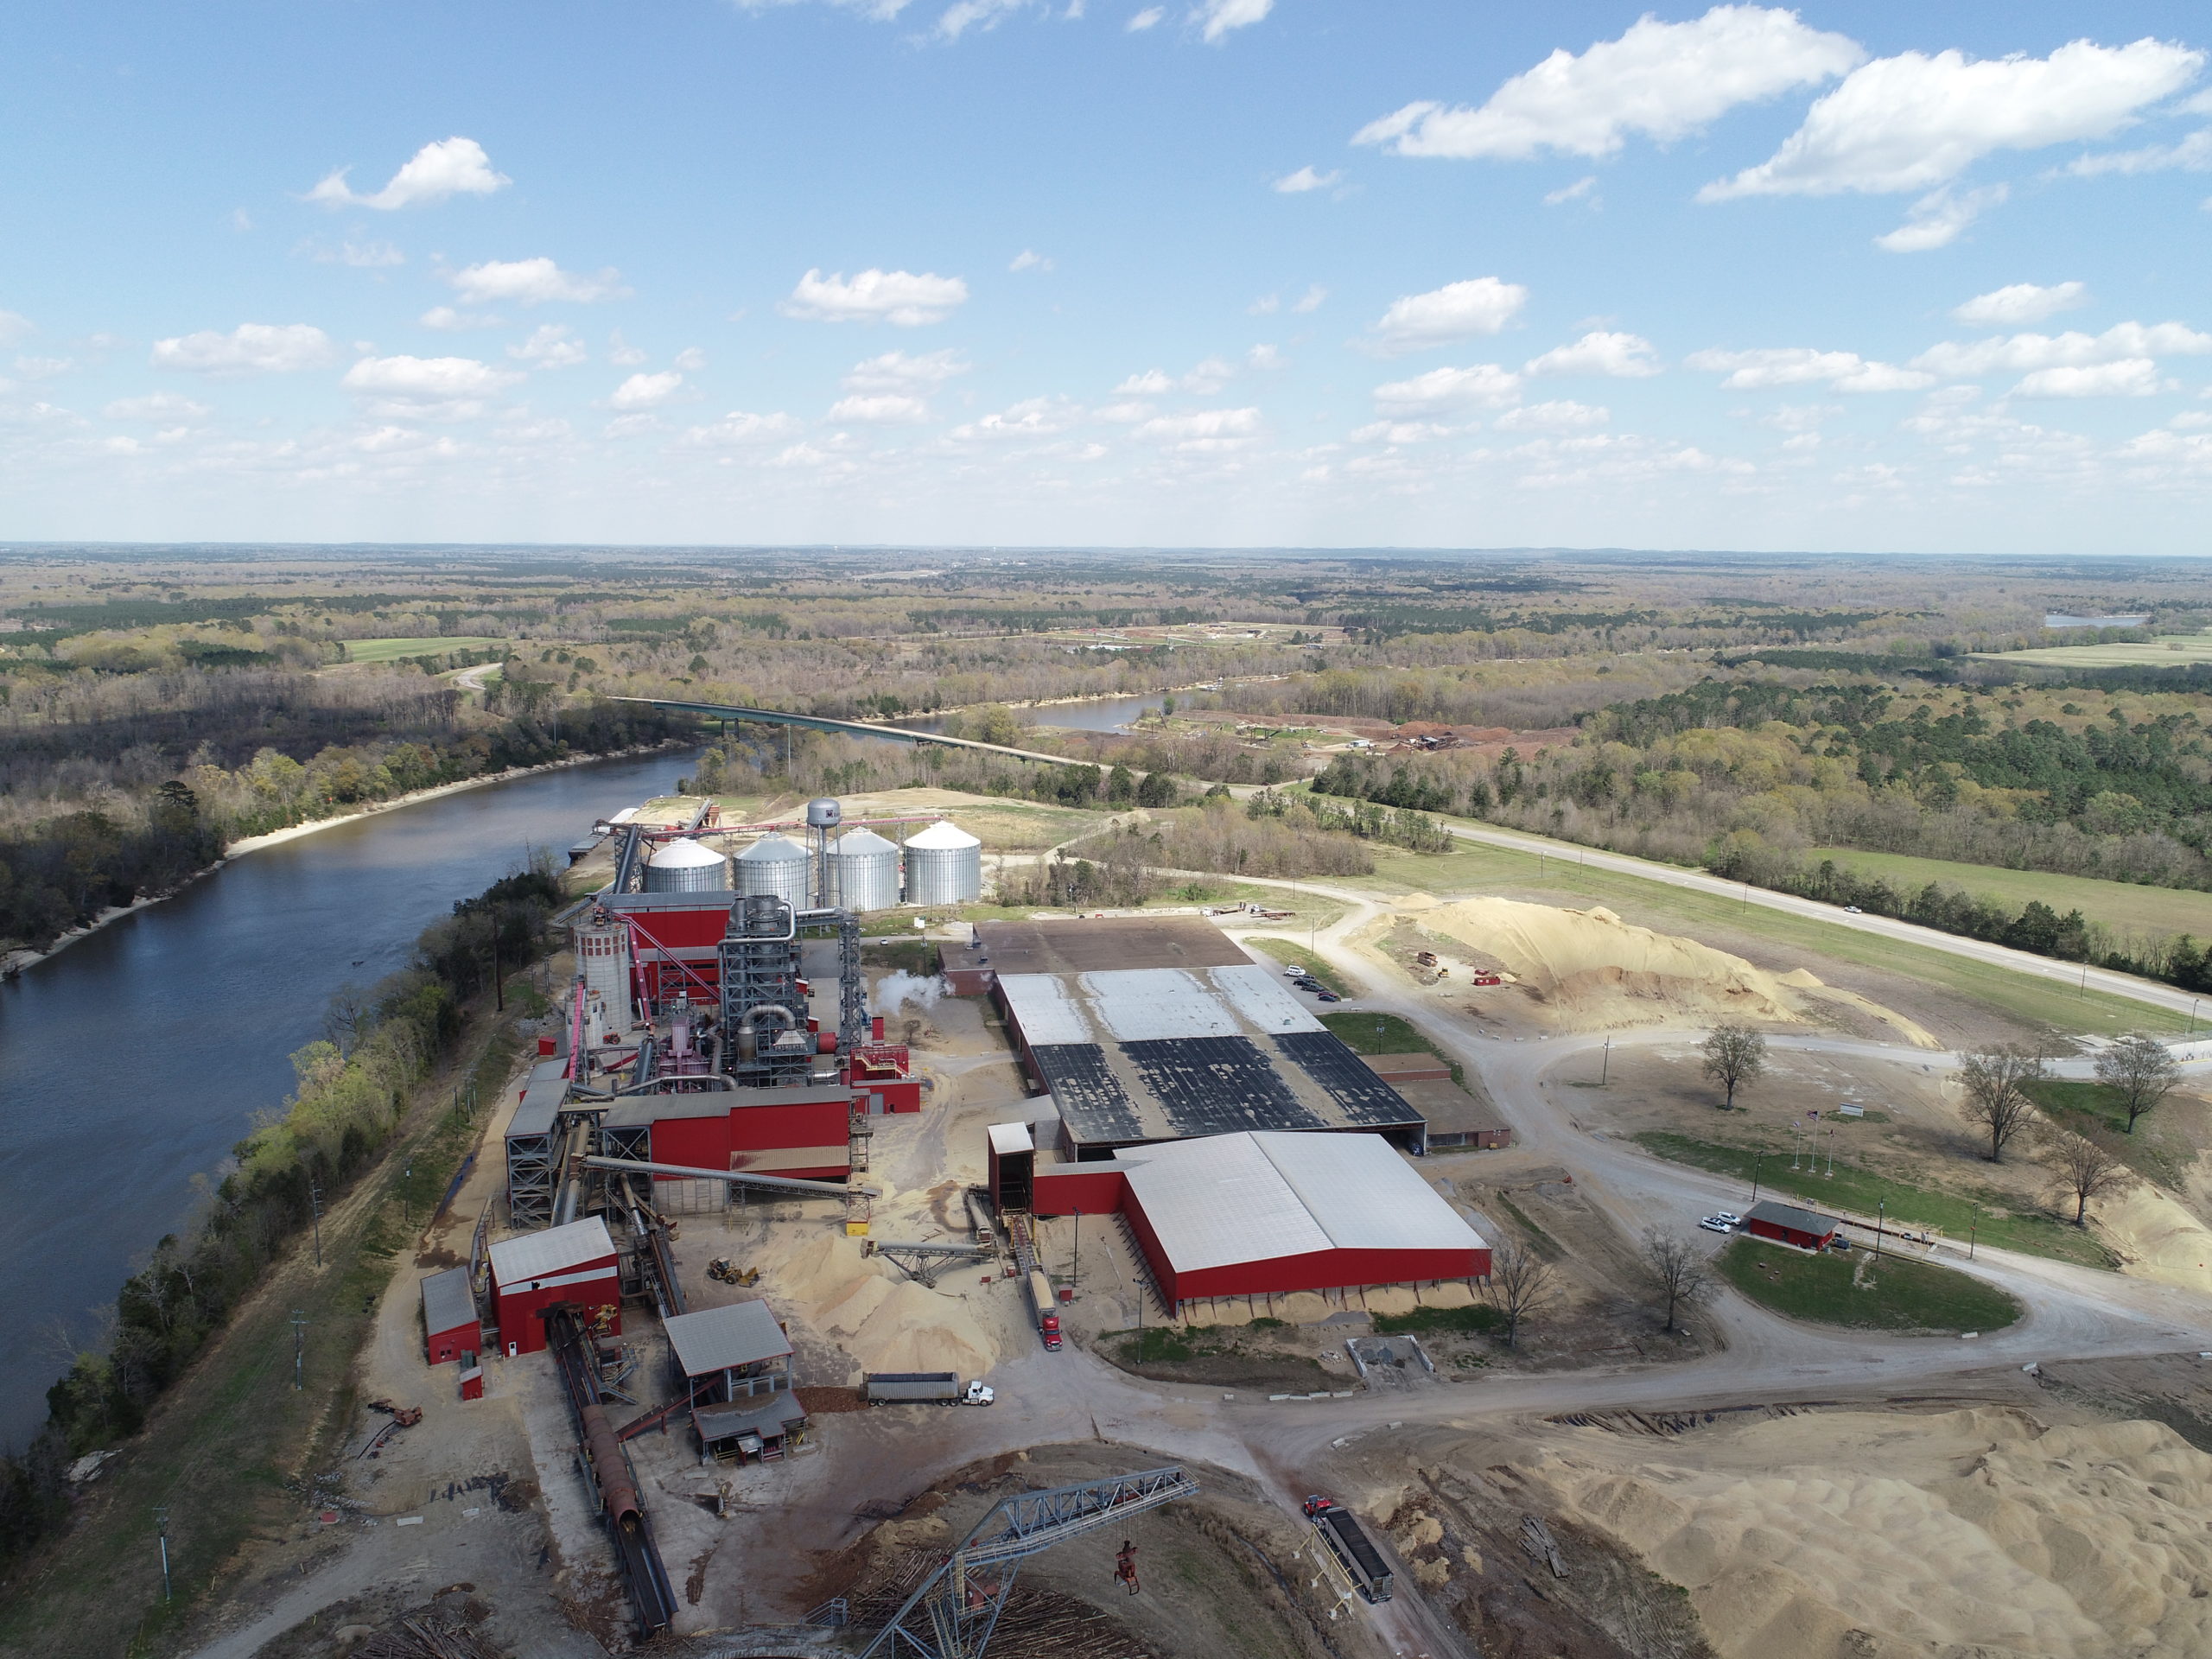
    • Supply – 17 pellet plants and developments across three major fibre baskets, production capacity of c.5Mt pa
    • 22Mt (c.$4.5 billion) of long-term contracted sales to high-quality customers in Asia and Europe
    • 14Mt of own-use sales through 2026
    • Generation – 2.6GW of biomass generation – UK’s largest source of renewable power by output
  • Development of BECCS in UK
    • East Coast Cluster – selected as one of two priority carbon capture and storage clusters
    • Government – BECCS included in Net Zero Strategy and Interim Bioenergy Strategy
    • Drax Power Station – planning application started, technology partner selected and FEED study commenced

Strategic outlook – growth plans aligned with global low-carbon growth

  • To be a global leader in sustainable biomass
    • Targeting 8Mt pa of production capacity and 4Mt pa of biomass sales to third parties by 2030
  • To be a global leader in negative emissions
    • Targeting 12Mt pa of negative CO2 – UK and international BECCS
  • To be a UK leader in dispatchable, renewable generation
    • Key system support role for biomass and expansion of Cruachan Pumped Storage Power Station
  • All underpinned by continued focus on safety, sustainability and biomass cost reduction
  • Investments totalling £3bn in period to 2030, fully funded through cash generation
    • Pellet production, UK BECCS and Cruachan expansion

Future positive – people, nature, climate

  • CO2 – >95% reduction in generation emissions since 2012 – sale of CCGT generation assets and end of commercial coal in March 2021 and closure in September 2022 following fulfilment of Capacity Market agreements
  • Sustainable biomass sourcing
    • Science-based sustainability policy compliant with current UK and EU law on sustainable biomass
    • Biomass produced using sawmill and forest residuals, and low-grade roundwood, which often have few alternative markets and would otherwise be landfilled, burned or left to rot, releasing CO2 and other GHGs
    • Significant increase in sawmill residues used by Drax to produce pellets – 57% of total fibre (2020: 21%)
    • 100% of woody biomass produced by Drax verified against SBP, SFI, FSC®(4) or PEFC Chain of Custody certification with third-party supplier compliance primarily via SBP certification
    • Glasgow Declaration launched at COP26 to establish a world-wide industry standard on biomass sustainability
  • People – Diversity, Equity and Inclusion – female representation in the UK business increased to 36% (2020:34%)
  • Governance – two new North America based Non-Executive Directors – Kim Keating and Erika Peterman

Operational review

Pellet Production – acquisition of Pinnacle, capacity expansion and biomass cost reduction

  • Adjusted EBITDA (including Pinnacle since 13 April 2021) up 65% to £86 million (2020: £52 million)
    • Pellet production up 107% to 3.1Mt (2020: 1.5Mt), with 1.2Mt sales to third parties and increased own-use
    • Total $/t cost of production down 7% to $143/t(5) (2020: $153/t(5))
  • Developments in US southeast (2021-22) – addition of c.0.6Mt of new production capacity
    • Completion of LaSalle and Morehouse plant expansions
    • Commissioning of Demopolis and first satellite plant (Leola)
    • Commencement of construction of second satellite plant (Russellville)
  • Further opportunities for growth and cost reduction – increased production capacity, sales to third parties, continued operational efficiencies and improvement, wider range of sustainable biomass and technical innovation

Generation – dispatchable renewable generation and system support services

  • UK’s largest generator of renewable power by output – 12% of total
  • Adjusted EBITDA from discontinued CCGT generation assets £20 million (2020: £46 million)
  • Adjusted EBITDA from continuing operations £352 million (2020: £400 million)
    • Biomass – 5% increase in generation less major planned outage on CfD unit (successfully completed November 2021), higher cost from historic foreign exchange hedging and system charges
    • Pumped storage / hydro – good operational performance
    • Strong portfolio system support role (balancing mechanism, ancillary services and optimisation)
    • Limited role for coal in H2 at request of system operator
  • Ongoing cost reductions to support operating model for biomass generation at Drax Power Station from 2027
    • Reduction in fixed cost base – end of commercial coal operations March 2021, closure September 2022
    • Third biomass turbine upgrade, delivering improved thermal efficiency and lower maintenance cost
    • Trials to expand range of lower cost sustainable biomass – up to 35% blend achieved in test runs on one unit
  • As at 21 February 2022, Drax had 20.4TWh of power hedged between 2022 and 2024 on its ROC and hydro generation assets at £70.2/MWh, with a further 0.9TWh equivalent of gas sales (transacted for the purpose of accessing additional liquidity for forward sales from ROC units and highly correlated to forward power prices) plus additional sales under the CfD mechanism
Contracted power sales 21 February 2022202220232024
ROC (TWh(6))10.96.92.4
ROC (£ per MWh)70.070.070.6
Hydro (TWh)0.2--
Hydro (£ per MWh)90.9--
Gas hedges (TWh equivalent)(7)0.50.4
Pence per therm105101
CfD(6/8) typical annual output c.5TWh and current strike price £118.5/MWh

Customers – renewable power under long-term contracts to high-quality I&C customers and decarbonisation products

  • Adjusted EBITDA of £6 million inclusive of impact of mutualisation changes and Covid-19 (2020: £39 million loss)
  • Continued development of Industrial & Commercial (I&C) portfolio
    • Focusing on key sectors to increase sales to high-quality counterparties supporting generation route to market
    • Energy services to expand the Group’s system support capability and customer sustainability objectives
  • Rebranding of the Haven Power I&C business to Drax Energy Solutions
  • Closure of Oxford and Cardiff offices as part of Small & Medium-Size (SME) strategic review and continuing to evaluate options for SME portfolio to maximise value and align with strategy

Other financial information

  • Total operating profit from continuing operations of £197 million (2020: £156 million loss, including exceptional costs totalling £275 million principally in respect of the announced closure of coal operations)
  • Total profit after tax from continuing operations of £55 million including a £49 million non-cash charge from revaluing deferred tax balances following confirmation of UK corporation tax rate increases from 2023 (2020: loss of £195 million)
  • 2021 capital investment of £230 million (2020: £183 million) – continued investment in biomass strategy
  • 2022 expected capital investment of £230–250 million – £70-80 million maintenance, £20 million enhancements, £110-120 million strategic, (primarily biomass and BECCS), and £30 million other (primarily safety and systems)
    • Excludes any material investment in non-core Open Cycle Gas Turbine developments – continuing to evaluate options, including sale, but continue to invest as appropriate to fulfil obligations under the Capacity Market agreements and to maximise value from any sale. In the event of a sale Drax expects to recover any capital expenditure incurred during 2022, which could total up to £100 million
  • Group cost of debt below 3.5%
    • Refinancing of Canadian facilities (July 2021) with lower cost ESG facility following Pinnacle acquisition
  • Net debt of £1,044 million (31 December 2020: £776 million), including cash and cash equivalents of £317 million (31 December 2020: £290 million)
    • Expect net debt to Adjusted EBITDA below 2x by the end of 2022
Forward Looking Statements
This announcement may contain certain statements, expectations, statistics, projections and other information that are, or may be, forward-looking. The accuracy and completeness of all such statements, including, without limitation, statements regarding the future financial position, strategy, projected costs, plans, beliefs and objectives for the management of future operations of Drax Group plc (“Drax”) and its subsidiaries (the “Group”), are not warranted or guaranteed. By their nature, forward-looking statements involve risk and uncertainty because they relate to events and depend on circumstances that may occur in the future. Although Drax believes that the statements, expectations, statistics and projections and other information reflected in such statements are reasonable, they reflect the Company’s current view and no assurance can be given that they will prove to be correct. Such events and statements involve risks and uncertainties. Actual results and outcomes may differ materially from those expressed or implied by those forward-looking statements. There are a number of factors, many of which are beyond the control of the Group, which could cause actual results and developments to differ materially from those expressed or implied by such forward-looking statements. These include, but are not limited to, factors such as: future revenues being lower than expected; increasing competitive pressures in the industry; and/or general economic conditions or conditions affecting the relevant industry, both domestically and internationally, being less favourable than expected. We do not intend to publicly update or revise these projections or other forward-looking statements to reflect events or circumstances after the date hereof, and we do not assume any responsibility for doing so.

Results presentation and webcast arrangements

Management will host a webcast presentation for analysts and investors at 11:00am (UK Time) on Thursday 24 February 2022.

The presentation can be accessed remotely via a live webcast link, as detailed below. After the meeting, the webcast recording will be made available and access details of this recording are also set out below.

A copy of the presentation will be made available from 7:00am (UK time) on Thursday 24 February 2022 for download at: https://www.drax.com/investors/announcements-events-reports/presentations/

Event Title: Drax Group plc: Full Year Results
Event Date: Thursday 24 February 2022
Event Time: 11:00am (UK time)
Webcast Live Event Link:  https://secure.emincote.com/client/drax/drax019
Conference call and pre-register Link: https://secure.emincote.com/client/drax/drax019/vip_connect
Start Date:  Thursday 24 February 2022
Delete Date:  Friday 24 February 2023
Archive Link:  https://secure.emincote.com/client/drax/drax019


For further information, please contact: rosie.corbett@fticonsutling.com

View investor presentation here

Alabama Cluster Catchment Area Analysis

The area of timberland in the Alabama cluster catchment area has remained stable over the last 20 years, increasing slightly from 4.08 million ha to 4.16 million ha, an increase of 79 thousand hectares.  This area represents 79.6% of the total land area in 2020, up from 78.1% in 2020.  The total area of forestland and woodland was 86% of the catchment area in 2020, with farmland making up 13% and urban areas 1%.  This land base can be considered to be heavily forested and dominated by timberland.

Figure 1: Land Use Type – Alabama cluster

The timberland area is classified by growth rate potential, capable of achieving a minimum of 0.57 m3/ha/year.  More than 95% of the timberland area is in private ownership.  This proportion has remained stable since 2000 as shown in Figure 2.

Figure 2: Timberland Ownership Profile – Alabama cluster

The total standing volume, the amount of carbon stored in the forest area, has increased by 115 million m3 since 2000 an increase of 30%. Most of this increase has occurred since 2010, with 90 million m3 added to the inventory since this time, reflecting the maturing age class of the forest resource as it passes through the peak growth phase.  Almost all of this increase has been in the softwood pine forest area, with a combined increase of 86 million m3 since 2010.  Pine saw-timber and chip-n-saw both increased by 46% since 2010 and pine pulpwood by 25% over the same period. Suggesting that the average tree size is getting larger as the forest matures.

Figure 3: Standing Volume by Product Class – Alabama cluster

One measure of the sustainability of harvesting levels is to compare average annual growth against removals.  This comparison gives a growth drain ratio (GDR).  Where removals are equal to or lower than growth (a GDR of 1 or more) this is a measure of sustainability, where the ratio falls below 1, this can indicate that harvesting levels are not sustainable in the long-term.  Figure 4 shows that all pine product classes have a positive GDR since 2010.  In particular the pine pulpwood GDR ratio is in excess of 2 suggesting that there is a substantial surplus of this product category.  By contrast, the hardwood GDR for both saw-timber and pulpwood are both lower than 1 suggesting that harvesting levels for hardwood species should be reduced until growth can recover.

Figure 4: Growth Drain Ratio by Product Class – Alabama cluster

Figure 5 shows the maturing age class of the forest area, charting the change in annual surplus and deficit in each product class.  The trend shows that harvesting of pine saw-timber from 2000 to 2008 represented a deficit of growth compared to harvesting removals.  This indicates an immature forest resource with a low quantity of forest categorised as saw-timber, therefore harvesting volume in mature stands outweighed the growth in mid-rotation stands.  As the forest aged, and more standing timber grew into the saw-timber category, the surplus of annual growth compared to removals increased.  Saw-timber growth in 2020 was 3 million m3 higher than in 2000.  The surplus of pine pulpwood has remained positive and has increased substantially from 3 million m3 in 2000 to 6.5 million m3 in 2020 despite harvesting levels increasing slightly over this period.

Figure 5: Annual Surplus/Deficit of Growth and Removal by Product Class – Alabama Cluster

Biomass demand began in 2008 at a very small scale, representing just 0.5% of total pulpwood demand in the catchment area.  From around 2013 it began to increase and reached peak in 2015 with a total demand of 724,000 tons of pulpwood in that year, representing 8.1% of total pulpwood demand in the catchment area.  After that time, demand for pulpwood declined as pellet mills switched to mill residuals.  The latest data on pulpwood demand shows that the biomass sectors made up just 2.8% of total pulpwood demand in 2020 with just over 216,000 tonnes of total demand.  This demonstrates that the biomass and wood pellet sector is a very small component of the market in this region and unlikely to influence forest management decision making, as shown in Figure 6.

Figure 6: Pulpwood Demand by Market – Alabama Cluster

Pine pulpwood stumpage prices have declined significantly since a peak in 2013, falling from an annual high of $9.46 when demand was strongest to just $4.12 in 2020 as demand for pine pulpwood declined in 2020.  Pine saw-timber prices have seen a similar decline from a high point in the early 2000’s to a plateau from 2011 onwards.  Saw-timber stumpage more than halved in value over this period from $49 per ton to $22 per ton.  This can have a significant impact on forest management objectives and decision making.

Figure 7: Stumpage Price Change by Product Category – Alabama Cluster

Detailed below are the summary findings from Hood Consulting on the impact of biomass demand on key issues in the Alabama cluster catchment area.

Is there any evidence that bioenergy demand has caused the following:

Deforestation?

No. US Forest Service (USFS) data shows that total timberland area has held steady and averaged roughly 4,172,000 hectares in the Alabama Cluster catchment area since Alabama Pellets-Aliceville started up in late-2012. More importantly, planted pine timberland (the predominant source of roundwood utilized by the bioenergy industry for wood pellet production) has increased more than 75,000 hectares (+4.9%) in the catchment area since Alabama Pellets’ startup in 2012.

A change in management practices (rotation lengths, thinnings, conversion from hardwood to pine)?

Inconclusive. Changes in management practices have occurred in the catchment area over the last two decades. However, the evidence is inconclusive as to whether increased demand attributed to bioenergy has caused or is responsible for those changes.

Clearcuts and thinnings are the two major types of harvests that occur in this region, both of which are long-standing, widely used methods of harvesting timber. TimberMart-South (TMS) data shows that the prevalence of thinnings temporarily increased in the Alabama Cluster market (from 2007-2013) due to the weakening of pine sawtimber markets. Specifically, challenging market conditions saw pine sawtimber stumpages prices decline from an average of $47 per ton from 2000-2006 to just over $23 per ton in 2011, or a roughly 50% decrease from 2000-2006 average levels. This led many landowners to refrain from clearcutting (a type of harvest which typically removes large quantities of pine sawtimber), as they waited for pine sawtimber prices to improve. However, pine sawtimber stumpage prices never recovered and have held between $22 and $25 per ton since 2011. Ultimately, landowners returned to more ‘normal’ management practices by 2014, with thinnings falling back in line with pre-2007 trends.

The catchment area has also experienced some conversion. Specifically, from 2000-2020, planted pine timberland increased more than 460,000 hectares while natural hardwood and mixed pine-hardwood timberland decreased a combined 390,000 hectares. Note that the increase in planted pine timberland and decrease in natural hardwood/mixed pine-hardwood timberland over this period were both gradual and occurred simultaneously. This suggests a management trend in which natural timber stands are converted to plantation pine following final harvest. It’s also important to note that there is little evidence that links these changes to increased demand from bioenergy, as this conversion trend begun years prior to the startup of Alabama Pellets and continued nearly unchanged following the pellet mill’s startup.

Diversion from other markets?

No. Demand for softwood (pine) sawlogs increased an estimated 12% in the catchment area from 2012-2020. Also, there is no evidence that increased demand from bioenergy has caused a diversion from other softwood pulpwood markets (i.e. pulp/paper). Also, even though softwood pulpwood demand not attributed to bioenergy is down 14% since Alabama Pellets-Aliceville’s startup in 2012, there is no evidence that increased demand from bioenergy has caused this decrease. Rather, the decrease in demand from non-bioenergy sources is due to a combination of reduced product demand (and therefore reduced production) and increased utilization of sawmill residuals.

An unexpected or abnormal increase in wood prices?

No. The startup of Alabama Pellets-Aliceville added roughly 450,000 metric tons of softwood pulpwood demand to the catchment area from 2012-2016, and this increase in demand coincided with essentially no change in delivered pine pulpwood (PPW) price over this same period. Ultimately, the additional demand placed on the catchment area following the startup of Alabama Pellets-Aliceville was offset by a decrease in demand from other sources from 2012-2016, and, as a result, delivered PPW prices remained nearly unchanged.

However, the Aliceville facility was shut down for a majority of 2017 due to the catastrophic failure of a key piece of environmental equipment, and this was followed by Alabama Pellets’ strategic decision to transition to residual-consumption only beginning in 2018, which eliminated more than 360,000 metric tons of annual softwood pulpwood demand from 2016-2018. Over this same period, softwood pulpwood demand from other sources also decreased nearly 360,000 metric tons. So, with the elimination of roughly 720,000 metric tons of annual softwood pulpwood demand from all sources from 2016-2018, delivered PPW prices in the catchment area proceeded to decrease more than 6% over this period. Since 2018, total softwood pulpwood demand has increased roughly 4% in the catchment area (due to increases in demand from non-bioenergy sources), and this increase that has coincided with a simultaneous 4% increase in delivered PPW price.

Statistical analysis did identify a positive relationship between softwood biomass demand and delivered PPW price. However, the relationship between delivered PPW price and non-biomass-related softwood pulpwood demand was found to be stronger, which is not unexpected given that pine pulpwood demand not attributed to bioenergy has accounted for 94% of total pine pulpwood demand in the catchment area since 2012. Ultimately, the findings provide evidence that PPW price is influenced by demand from all sources – not just from bioenergy or from pulp/paper, but from both.

Furthermore, note that Alabama Pellets’ shift to residual-consumption only beginning in 2018 resulted in no increase in pine sawmill chip prices, as the price of pine sawmill chips in the Alabama Cluster catchment area rather decreased from 2018-2020, despite a more than 100,000-metric ton increase in pine sawmill chip consumption by the Aliceville mill over this period.

A reduction in growing stock timber?

No. From 2012 (the year Alabama Pellets started up) to 2020, total growing stock inventory increased an average of 2.6% per year (+22% total) in the Alabama Cluster catchment area. Specifically, inventories of pine sawtimber and pine chip-n-saw increased 41% and 40%, respectively, while pine pulpwood (PPW) inventory increased 25% over this same period.

A reduction in the sequestration rate of carbon?

No. US Forest Service (USFS) data shows the average annual growth rate of total growing stock timber in the Alabama Cluster catchment area increased from 6.0% in 2012 to 6.2% in 2020, suggesting that the sequestration rate of carbon also increased slightly over this period.

Note that the increase in overall growth rate (and therefore increase in the sequestration rate of carbon) can be linked to gains in pine timberland and associated changes with the catchment area forest. Specifically, growth rates decline as timber ages, so the influx of new pine timberland (due to the conversion of both hardwood forests and cropland) has resulted in just the opposite, with the average age of softwood (pine) growing stock inventory decreasing from an estimated 35.4 years of age in 2000 to 33.2 years of age in 2010 and to 32.2 years of age in 2020 (total growing stock inventory decreased from 41.9 to 41.0 and to 40.4 years of age over these periods).

An increase in harvesting above the sustainable yield capacity of the forest area?

No. Growth-to-removals (G:R) ratios, which compare annual timber growth to annual timber removals, provides a measure of market demand relative to supply as well as a gauge of market sustainability. In 2020, the latest available, the G:R ratio for pine pulpwood (PPW), the predominant timber product utilized by the bioenergy sector, equaled 3.26 (recall that a value greater than 1.0 indicates sustainable harvest levels).

Moreover, note that the PPW G:R ratio has increased in the catchment area since the Aliceville mill’s startup in 2012, despite the associated increases in pine pulpwood demand. In this catchment area, pine pulpwood demand from non-bioenergy sources decreased more than 860,000 metric tons from 2012 to 2020, and this decrease more than offset any increase in demand from bioenergy.

Impact of bioenergy demand on:

Timber growing stock inventory

Neutral. According to USFS data, inventories of pine pulpwood (PPW) increased 25% in the catchment area from 2012-2020, and this increase in PPW inventory can be linked to both increases in pine timberland and harvest levels below the sustainable yield capacity of the forest area. Specifically, pine timberland (both planted and natural combined) increased more than 185,000 hectares in the catchment area from 2012-2020. Over this same period, annual harvests of PPW were 65% below maximum sustainable levels.

Timber growth rates

Neutral. The average annual growth rate of total growing stock timber increased from 6.0% in 2012 to 6.2% in 2020 in the Alabama Cluster catchment area, despite pine pulpwood (PPW) growth rate decreasing from 15.1% to 12.5% over this period. However, this decrease in PPW growth rate was not due to increased demand attributed to bioenergy but rather to the aging of PPW within its product group and its natural movement along the pine growth rate curve. Specifically, USFS data indicates the average age of PPW inventory in the catchment area increased from an estimated 13.4 years of age in 2012 to 13.6 years of age in 2020.

Forest area

Neutral. In the Alabama Cluster catchment area, total forest (timberland) area remained nearly unchanged (decreasing only marginally) from 2012-2020. However, pine timberland – the predominant source of roundwood utilized by the bioenergy industry for wood pellet production – increased more than 185,000 hectares over this period, and this increase can be linked to several factors, including conversion from both hardwood and mixed pine-hardwood forests as well as conversion from cropland.

Specifically, the more than 185,000-hectare increase in pine timberland from 2012-2020 coincided with a roughly 197,000-hectare decrease in hardwood/mixed pine-hardwood timberland and a more than 8,000-hectare decrease in cropland over this period. Furthermore, statistical analysis confirmed these inverse relationships, identifying strong negative correlations between pine timberland area and both hardwood/mixed pine-hardwood timberland area and cropland in the catchment area from 2012-2020.

Wood prices

Negative/Neutral. Softwood pulpwood demand attributed to bioenergy increased from roughly 80,000 metric tons in 2012 (the year Alabama Pellets-Aliceville started up) to more than 655,000 metric tons in 2015 (the year biomass demand reached peak levels). However, this roughly 575,000-metric ton increase in softwood biomass demand coincided with essentially no change in delivered pine pulpwood (PPW) price – which averaged $26.40 per ton in 2012 and $26.39 per ton in 2015. Ultimately, the additional demand placed on this catchment area following the startup of Alabama Pellets-Aliceville was offset by a more than 680,000-metric ton decrease in demand from other sources over this same period, and, as a result, delivered PPW prices remained nearly unchanged. Also note that Alabama Pellets’ strategic shift to consume residuals only (a transition that begun in 2018 and had been completed by 2019) resulted in a nearly 480,000-metric ton decrease in softwood biomass demand in the catchment area from 2015 to 2020. Over this same period, softwood pulpwood demand from other sources decreased more than 180,000 metric tons. In total, softwood pulpwood demand from all sources decreased more than 660,000 metric tons from 2015 to 2020, and this decrease in demand resulted in delivered PPW prices decreasing 5% over this period.

Statistical analysis did identify a positive relationship between softwood biomass demand and delivered PPW price. However, the relationship between delivered PPW price and non-biomass-related softwood pulpwood demand was found to be stronger, which is not unexpected given that pine pulpwood demand not attributed to bioenergy has accounted for 94% of total pine pulpwood demand in the catchment area since 2012. Ultimately, the findings provide evidence that PPW price is influenced by demand from all sources – not just from bioenergy or from pulp/paper, but from both.

Markets for solid wood products

Positive. In the Alabama Cluster catchment area, demand for softwood sawlogs used to produce lumber and other solid wood products has increased an estimated 12% since 2012, and this increase in softwood lumber production has consequentially resulted in the increased production of sawmill residuals (i.e. chips, sawdust, and shavings) – by-products of the sawmilling process and materials utilized by Alabama Pellets to produce wood pellets.

Moreover, the increased availability of sawmill residuals and lower relative cost compared to roundwood (after chipping and other processing costs are considered) led Alabama Pellets to make a strategic shift to utilize residuals only for wood pellet production beginning in 2019. So, not only has Alabama Pellets benefited from the greater availability of this lower-cost sawmill by-product, but lumber producers have also benefited, as Alabama Pellets has provided an additional outlet for these producers and their by-products.

Read the full report: Alabama Cluster Catchment Area Analysis

This is part of a series of catchment area analyses around the forest biomass pellet plants supplying Drax Power Station with renewable fuel. Others in the series can be found here

The jobs needed to build a net zero energy future

Many components are needed to tackle climate change and reach environmental milestones such as meeting the goals of the Paris Agreement. One of those components is the right workforce, large enough and with the necessary skills and knowledge to take on the green energy jobs of a low-carbon future. In 2020, the renewable energy sector employed 11.5 million people around the world, but as the industry continues to expand that workforce will only grow.

Last year, a National Grid report found that in the UK alone, 120,000 jobs will need to be filled in the low-carbon energy sector by 2030, to meet the country’s climate objectives. That figure is expected to rise to 400,000 by 2050.  The UK energy sector as a whole currently supports 738,000 jobs and much of this workforce already has the skills needed for a low carbon society . Others can be reskilled and retrained, helping to bolster the future workforce by supporting employees through the green transition.

At a global level energy sector jobs are expected to increase from 18 million to 26 million by 2050. Jobs that will span the full energy spectrum; from researching and advising on low-carbon solutions to installing and implementing them.

Here are some of the roles that will be key to the low-carbon energy transformation:

A wind farm under construction off the English coast

Wind turbine technicians

According to the International Energy Agency (IEA), wind power is this year set for a 17% increase in global energy generation compared to 2020, the biggest increase of any renewable power source. The IEA also forecasts that wind power will need to grow tenfold by 2050 if the world is to meet the goals of the Paris Agreement. It’s not surprising, therefore, that wind turbine technicians – the professionals who install, inspect, maintain, and repair wind turbines – are in high demand. In the US, wind turbine technician is the fastest-growing job in the country – with 68% growth projected over the 2020-2030 period – to give just one example.

In the UK, many wind turbine technicians have a background in engineering or experience from the wider energy sector. Although there are wind turbine technician and maintenance courses available, they are not a prerequisite, and many employers offer apprenticeships and on-the-job training – smoothing the path for energy professionals to transition into the role.

Solar panel installers

Today, solar photovoltaic (solar PV) is the biggest global employer in renewable energy, accounting for 3.8 million jobs. The IEA also reported a 23% uptick in solar PV installations around the world in 2020. In the UK, there are currently 13.2 gigawatts (GW) of installed solar power capacity. Trade association Solar Energy UK predicts this will need to rise to at least 40 GW by 2030 if the UK is to succeed in becoming a net zero economy by 2050. The trade association believes this could see the creation of 13,000 new solar energy jobs.

Solar panel installers – who carry out the important job of installing and maintaining solar PV – are essential to a low-carbon future. Many solar panel installers in the UK come from a background in electrical installation or have transitioned from engineering. While there are training courses specifically designed for solar panel installers, they are not a necessity, particularly if you already have on-the-job experience in a relevant sector. This makes a move to becoming a solar panel installer relatively easy for someone already working in energy or with a mind for engineering.

Energy consultants

Businesses of all kinds must play a role in the transition to net zero. Organisations must be able to manage their energy use and begin switching to renewable sources. As professionals who advise companies on this process, renewable energy consultants are a key part of the green energy workforce. Aspects of the job include identifying how organisations use their electric assets and helping businesses optimise those assets to build responsiveness and flexibility into energy-intensive operations. The core responsibilities of a renewable energy consultant are to reduce a company’s environmental impact while helping the business reduce energy costs and identifying opportunities.

Carbon accountants

A growing number of businesses are setting targets for reducing their greenhouse gas (GHG) emissions. But that’s only possible if you can first determine what your GHG emissions are and where they come from, which is where the relatively young field of carbon accounting comes in. Through what is known as physical carbon accounting, companies can assess the emissions their activities generate, and where in the supply chain the emissions are occurring. This allows businesses to implement more accurate actions and be realistic in their timelines for reducing emissions.

On a wider scale, accurate carbon accounting will be crucial in certifying emissions reductions or abatement, as well as in the distribution of carbon credits or penalties as whole economies push towards net zero.

Battery technology researchers

Energy storage is essential to a low-carbon energy future.  The ability to store and release energy from intermittent sources such as wind and solar will be crucial in meeting demand and balancing a renewables-driven grid. While many forms of energy storage already exist, developing electric batteries that can be deployed at scale is still a comparatively new and expanding area.

Global patenting activities in the field of batteries and other electricity storage increased at an annual rate of 14% –  four times faster than the average for technology – between 2005 and 2018. However, it’s estimated that to meet climate objectives, the world will need nearly 10,000 GW hours of battery and other electricity storage by 2040. This is 50 times the current level and research and innovation will be crucial to delivering bigger and more efficient batteries.

Farmers and foresters

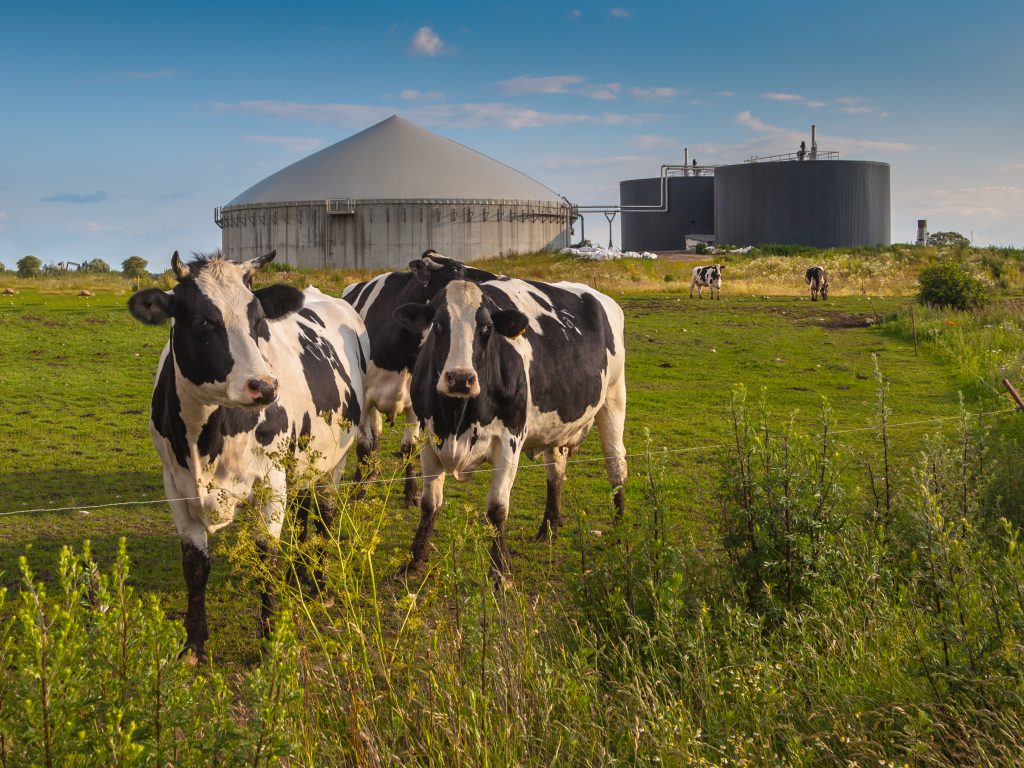
How we use and manage land will be important in lowering carbon emissions and creating a sustainable future for people and the planet. Crops like corn, sugarcane, and soybean can serve as feedstock for biofuel and bioenergy, and farming by-products such as cow manure can be used in the development of biofuel.

Techniques adopted in the agricultural sector will also be important in optimising soil sequestration capabilities while ensuring it is nutrient-rich enough to grow food. These techniques include the use of biochar, a solid form of charcoal produced by heating biomass without oxygen. Research indicates that biochar can sequester carbon in the soil for centuries or longer. It also helps soil retain water and could contribute to reducing the use of fertilisers by making the soil more nutrient-dense.

Forests, meanwhile, provide material for industries like construction, the by-products from which can serve as feedstock for woody biomass, primarily in the shape of low-grade wood that would otherwise remain unused. Sustainably managed forests, such as those from which Drax sources its biomass, have two-fold importance. They both enable woody biomass for bioenergy and ensure CO2 is removed from the atmosphere as part of the natural carbon cycle.

Biofuel engineers and scientists

Farmers and foresters provide feedstock for biofuels, but it’s biofuel scientists and engineers who research, develop, and enhance them, opening the door to alternative fuels for vehicles, heating, and even jet engines.

According to the IEA, production of biofuel that can be used as an alternative to fossil fuels in the transport sector grew 6% in 2019. However, the organisation forecasts that production will need to increase 10% annually until 2030to be in line with Paris Agreement climate targets.

Scientific innovations that can help boost the production of biofuel around the world, therefore, continues to be vital. As is the work of biofuel engineers who assess and improve existing biofuel systems and develop new ones that can replace fossil fuels like petrol and diesel.

The wealth of knowledge around fuels in the oil and gas industries means there is ample opportunity for scientists and engineers who work with fossil fuels to bring their skills to crucial low-carbon roles.

Geologists

The overriding goal of the Paris Agreement is to limit global warming to “well below” 2 and preferably to 1.5 degrees Celsius, compared to pre-industrial levels. This is an objective the IEA has said will be “virtually impossible” to fulfil without carbon capture and storage (CCS) technologies. CCS entails capturing CO2 and transporting it for safe and permanent underground storage in geological formations such as depleted oil and gas fields, coal seams, and saline aquifers.

According to the Global CCS Institute, the world will need a 100-fold increase on the 27 CCS project currently in operation by 2050. Knowledge and research into rock types, formations, and reactivity will be important in helping identify sites deep underground that can be used for safe, permanent carbon storage, and sequestration. Skills and expertise gained in the oil and gas industries will allow professionals in these sectors to make the switch from careers in fossil fuel to roles that help power a net zero economy.  

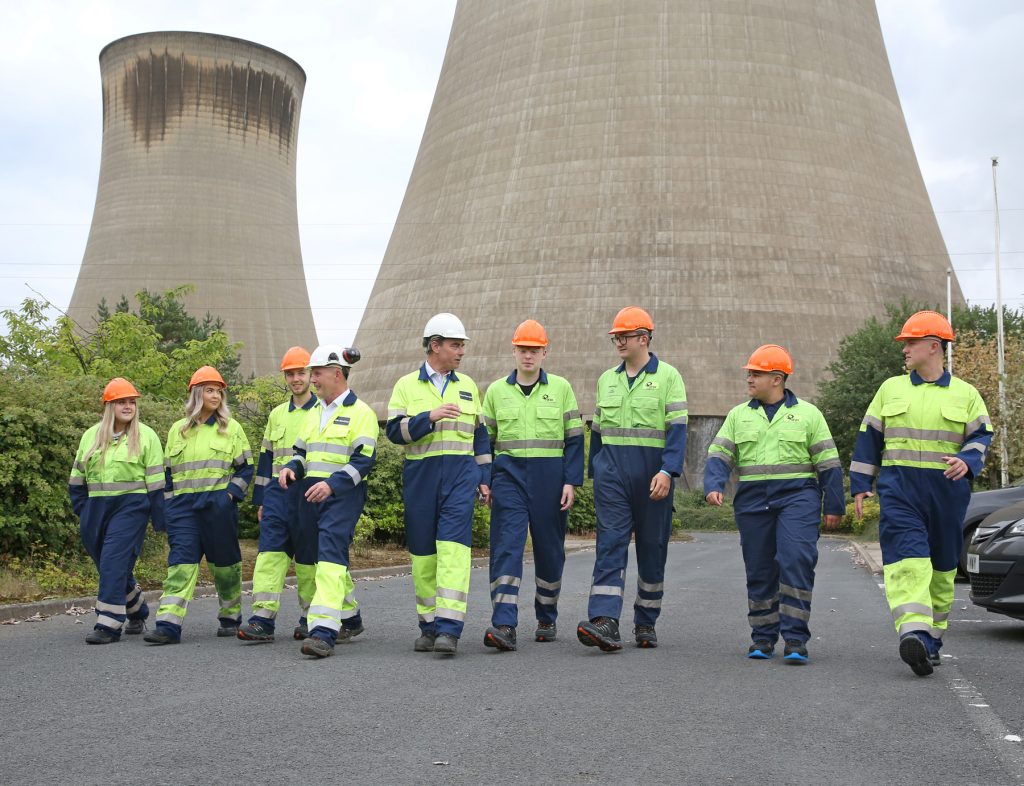
Employees working at Drax Power Station

Chemists

The role of chemists is also vital to decarbonisation. Knowledge and research around CO2 is a potent force in the effort to reduce and remove it from the atmosphere.

Technologies like CCS, bioenergy with carbon capture and storage (BECSS) and direct air carbon capture and storage (DACCS) are based around such research. Carbon capture processes are chemical reactions between emissions streams and solvents, often based on amines, and GHGs. Understanding and controlling these processes makes chemistry a key component of delivering carbon capture at the scale needed to help meet climate targets.

Chemists’ role in decarbonisation is far from limited to carbon capture methods. From battery technology to reforestation, chemists’ understanding of the elements can help drive action against climate change.

Bringing together disciplines

Tackling climate change on the scale needed to achieve the aims of the Paris Agreement depends on collaboration between industries, countries, and disciplines. Decarbonisation projects such as the UK’s East Coast Cluster, which encompasses both Zero Carbon Humber and Net Zero Teesside, fuse engineering and construction jobs with scientific and academic work.

Zero Carbon Humber, which brings together 12 organisations, including Drax, is expected to create as many as 47,800 jobs in the region by 2027. Among these are construction sector jobs for welders, pipefitters, machine installers and technicians. In addition, indirect jobs are predicted to be created across supply chains, from material manufacturing to the logistics of supporting a workforce.

Meeting climate challenges and delivering projects on the scale of Zero Carbon Humber, depends on creating an energy workforce that combines the knowledge of the past with the green energy skills of the future.

Drax’s apprenticeships have readied workers for the energy sector for decades, and will continue to do so as we build a low-carbon future. Options include four-year technical apprenticeships in mechanical, electrical, and control and instrumentation engineering. Getting on-the-job training and practical experience, apprentices receive a nationally recognised qualification, such as a BTEC or an NVQ Level 3, at the end of the programme.

Apprentices at Drax Power Station [2021]

The workforce needed to make low carbon societies a reality will be a diverse one – stretching from apprentices to experienced professionals with a background in traditional or renewable energy. It will also span every aspect of the renewable energy field, from the chemists and biofuel scientists who develop key technologies to the solar panel installers and wind turbine technicians who fit and maintain the necessary equipment.

The skills needed to take on these roles are already plentiful in the UK and around the world. Overcoming challenges on the road to net zero requires refocussing these existing talents, skills, and careers towards a new goal.

Transporting carbon – How to safely move CO2 from the atmosphere to permanent storage

Key points

  • Carbon capture usage and storage (CCUS) offers a unique opportunity to capture and store the UK’s emissions and help the country reach its climate goals.
  • Carbon dioxide (CO2) can be stored in geological reservoirs under the North Sea, but getting it from source to storage will need a large and safe CO2 transportation network.
  • The UK already has a long history and extensive infrastructure for transporting gas across the country for heating, cooking and power generation.
  • This provides a foundation of knowledge and experience on which to build a network to transport CO2.

Across the length of the UK is an underground network similar to the trainlines and roadways that crisscross the country above ground. These pipes aren’t carrying water or broadband, but gas. Natural gas is a cornerstone of the UK’s energy, powering our heating, cooking and electricity generation. But like the country’s energy network, the need to reduce emissions and meet the UK’s target of net zero emissions by 2050 is set to change this.

Today, this network of pipes takes fossil fuels from underground formations deep beneath the North Sea bed and distributes it around the UK to be burned – producing emissions. A similar system of subterranean pipelines could soon be used to transport captured emissions, such as CO2, away from industrial clusters around factories and power stations, locking them away underground, permanently and safely.

Conveyer system at Drax Power Station transporting sustainable wood pellets

The rise of CCUS technology is the driving force behind CO2 transportation. The process captures CO2 from emissions sources and transports it to sites such as deep natural storage enclaves far below the seabed.

Bioenergy with carbon capture and storage (BECCS) takes this a step further. BECCS uses sustainable biomass to generate renewable electricity. This biomass comes from sources, such as forest residues or agricultural waste products, which remove CO2 from the atmosphere as they grow. Atmospheric COreleased in the combustion of the biomass is then captured, transported and stored at sites such as deep geological formations.

Across the whole BECCS process, CO2 has gone from the atmosphere to being permanently trapped away, reducing the overall amount of CO2 in the atmosphere and delivering what’s known as negative emissions.

BECCS is a crucial technology for reaching net zero emissions by 2050, but how can we ensure the CO2 is safely transported from the emissions source to storage sites?

Moving gases around safely

Moving gases of any kind through pipelines is all about pressure. Gases always travel from areas of high pressure to areas of low pressure. By compressing gas to a high pressure, it allows it to flow to other locations. Compressor stations along a gas pipeline help to maintain right the pressure, while metering stations check pressure levels and look out for leaks.

The greater the pressure difference between two points, the faster gases will flow. In the case of CO2, high absolute pressures also cause it to become what’s known as a supercritical fluid. This means it has the density of a liquid but the viscosity of a gas, properties that make it easier to transport through long pipelines.

Since 1967 when North Sea natural gas first arrived in the UK, our natural gas transmission network has expanded considerably, and is today made up of almost 290,000 km of pipelines that run the length of the country. Along with that physical footprint is an extensive knowledge pool and a set of well-enforced regulations monitoring their operation.

While moving gas through pipelines across the country is by no means new, the idea of CO2 transportation through pipelines is. But it’s not unprecedented, as it has been carried out since the 1980s at scale across North America. In contrast to BECCS, which would transport CO2 to remove and permanently store emissions, most of the CO2 transport in action today is used in oil enhanced recovery – a means of ejecting more fossil fuels from depleted oil wells. However, the principle of moving CO2 safely over long distances remains relevant – there are already 2,500 km of pipelines in the western USA, transporting as much as 50 million tonnes of CO2 a year.

“People might worry when there is something new moving around in the country, but the science community doesn’t have sleepless nights about CO2 pipelines,” says Dr Hannah Chalmers, from the University of Edinburgh. “It wouldn’t explode, like natural gas might, that’s just not how the molecule works. If it’s properly installed and regulated, there’s no reason to be concerned.”

CO2 is not the same as the methane-based natural gas that people use every day. For one, it is a much more stable, inert molecule, meaning it does not react with other molecules, and it doesn’t fuel explosions in the same way natural gas would.

CO2 has long been understood and there is a growing body of research around transporting and storing it in a safe efficient way that can make CCUS and BECCS a catalyst in reducing the UK’s emissions and future-proofing its economy.

Working with CO2 across the UK

Working with CO2 while it is in a supercritical state mean it’s not just easier to move around pipes. In this state CO2 can also be loaded onto ships in very large quantities, as well as injected into rock formations that once trapped oil and gas, or salt-dense water reserves.

Decades of extracting fossil fuels from the North Sea means it is extensively mapped and the rock formations well understood. The expansive layers of porous sandstone that lie beneath offer the UK an estimated 70 billion tonnes of potential CO2 storage space – something a number of industrial clusters on the UK’s east coast are exploring as part of their plans to decarbonise.

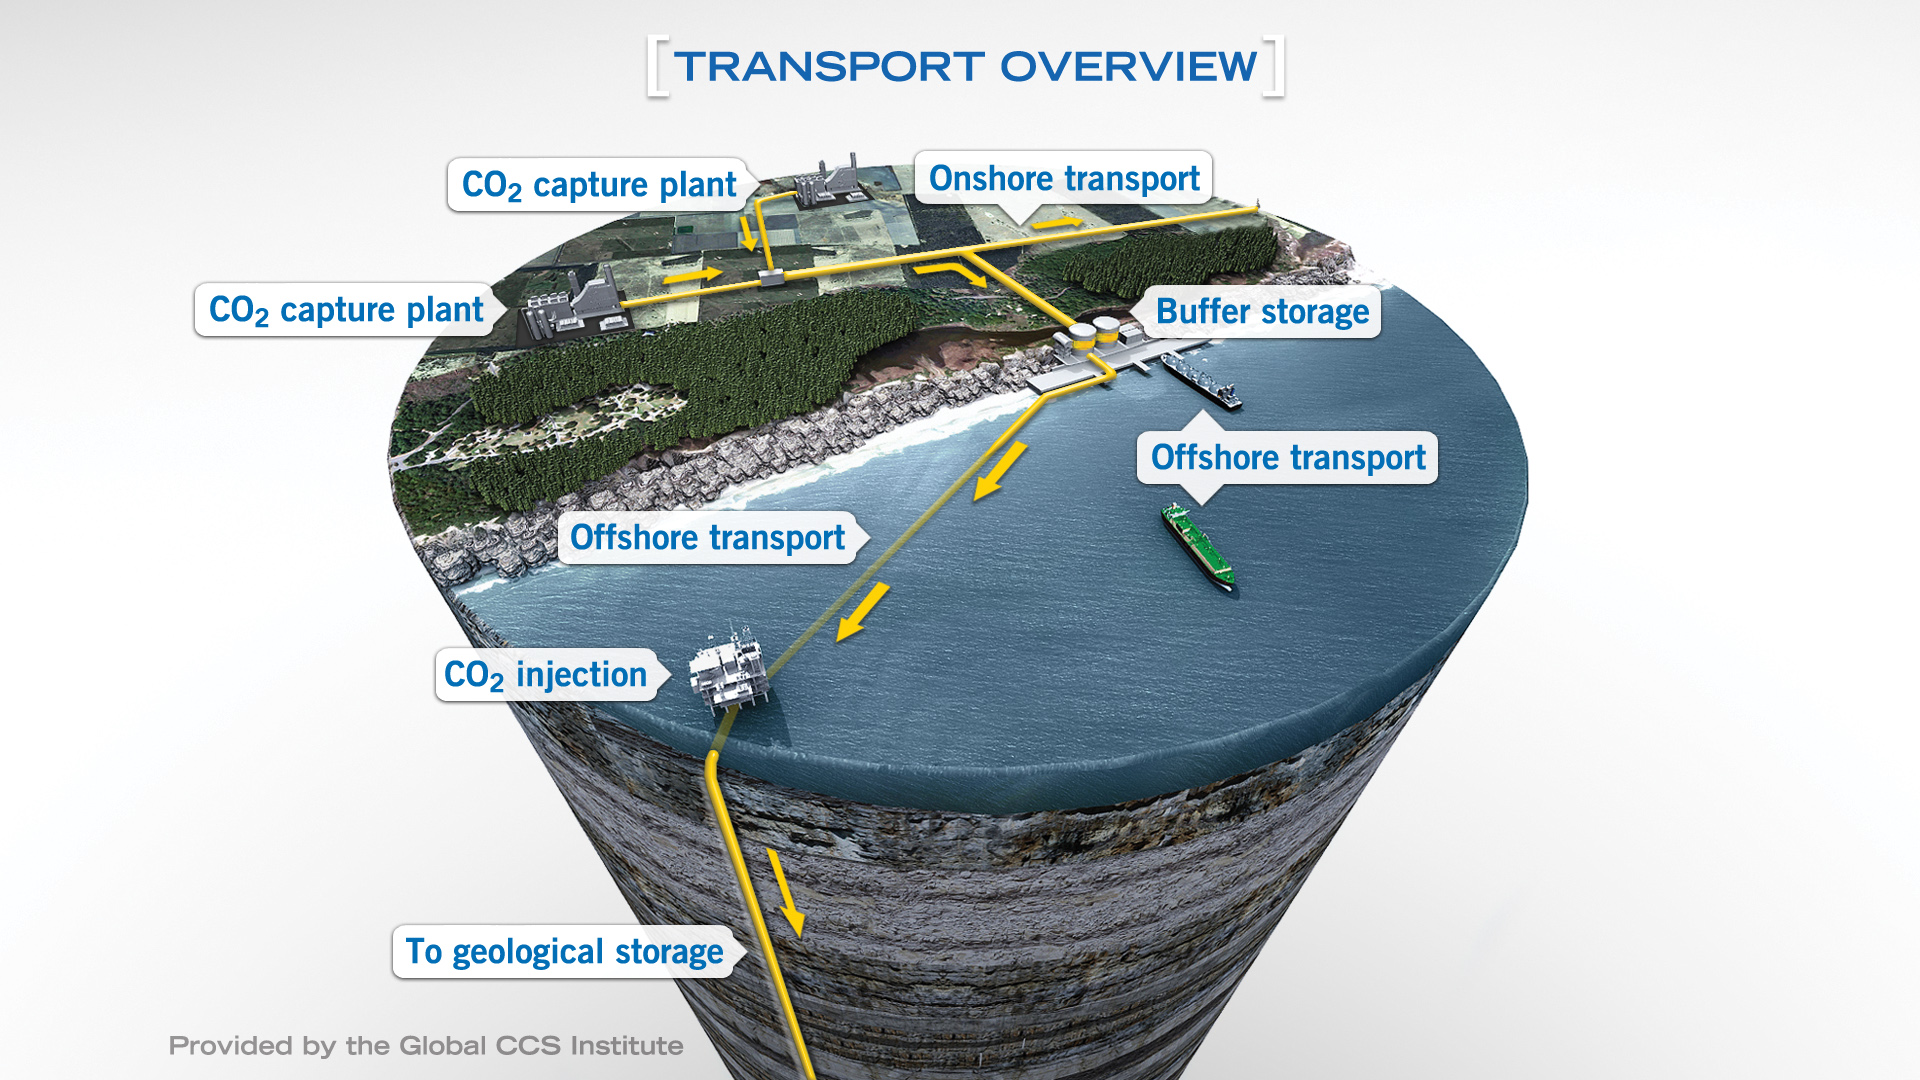
Source: CCS Image Library, Global CCS Institute [Click to view/download]

Drax is already running a pilot BECCS project at its power station in North Yorkshire. As part of the Zero Carbon Humber partnership and wider East Coast Cluster, Drax is involved in the development of large scale carbon storage capabilities in the North Sea that can serve the Humber and Teesside industrial clusters. As Drax moves towards its goal of becoming carbon negative by 2030, transporting CO2 safely at scale is a key focus.

“Much of the research and engineering has already been done around the infrastructure side of the project,” explains Richard Gwilliam, Head of Cluster Development at Drax. “Transporting and storing CO2 captured by the BECCS projects is well understood thanks to extensive engineering investigations already completed both onshore and offshore in the Yorkshire region.”

This also includes research and development into pipes of different materials, carrying CO2 at different pressures and temperatures, as well as fracture and safety testing.

The potential for the UK to build on this foundation and progress towards net zero is considerable. However, for it to fully manifest it will need commitment at a national level to building the additional infrastructure required. The results of such a commitment could be far reaching.

In the Humber alone, 20% of economic value comes from energy and emissions-intensive industries, and as many as 360,000 jobs are supported by industries like refining, petrochemicals, manufacturing and power generation. Putting in place the technology and infrastructure to capture, transport and store emissions will protect those industries while helping the UK reach its climate goals.

It’s just a matter of putting the pipes in place.

Go deeper: How do you store CO2 and what happens to it when you do?

Enviva Cottondale pellet plant catchment area analysis

The Enviva Cottondale pellet mill has a production capacity of 760,000 metric tonnes of wood pellets annually. Raw material used by the mill includes a combination of roundwood, chips, and secondary residuals (i.e., sawdust and shavings), with pine accounting for 80‐90% of total feedstock. In October 2018, Hurricane Michael passed through the centre of the Cottondale catchment area, causing significant damage to the forest resource with more than 500,000 hectares (ha) of forestland destroyed and an estimated loss of 42 million m3of timber (equivalent to around 4 times the UK annual production of roundwood).

This event has had an impact on the data trends for forest inventory, growth and harvesting removals – as harvesting levels were increased to salvage as much timber as possible before it became unusable due to decay. This can be clearly seen in many of the charts below. However, these forest areas have been restored and now continue to grow, allowing the catchment area to return to its pre-hurricane trends in the medium term.

Forest Area 

The catchment area around Enviva’s Cottondale pellet mill includes 4.3 million ha of land, based on the historical feedstock sourcing patterns of the mill. Timberland represents 68.7% (2.95 million ha) of the total land area in the Cottondale catchment area, this has increased slightly since 2000 from 67.8% and can be considered to have remained stable over this time period.  There are also around 300,000 ha of woodland (associated with agricultural land) and around 800,000 ha of cropland and pastureland.  Forestry is the dominant land use in this catchment area (Figure 1).

Figure 1: Land area by usage

Planted pine represents 33% of the timberland area, natural pine 20%, with 10% mixed stands and the remainder being hardwood forest of which 94% is naturally regenerated (Figure 2).  The breakdown of forest type and species composition has remained relatively stable and largely unchanged over the last 20 years, in contrast to other parts of the US South where some natural pine stands have been converted to planted pine. The pine and mixed forest areas are actively managed and produce the majority of the timber harvest in the catchment area. Despite the large area of hardwood forest, management and timber production is limited. Much of this area is classified as bottomland hardwood located alongside rivers, streams, and creeks and in streamside management zones (SMZs), which restricts active management. In addition, the proportion of this catchment area located in Florida contains a large area of swampland, which is largely composed of hardwoods and cannot be actively managed for timber production and is recognised as having important ecological value.

Figure 2: Breakdown of forest type

Volume and Growth

The overall trend of volume and growth in the Cottondale catchment area is of a maturing forest resource and an increasing accumulation of standing volume, particularly in the larger forest product classes (saw-timber and chip-n-saw). Figure 3 shows that total standing volume increased by 64 million m3 from 2000 to 2018, with the largest increases in the pine saw-timber and chip-n-saw categories. In 2018, the devastating impact of Hurricane Michael caused a substantial reduction in the standing volume across every product category with the total standing volume being reduced by 42 million m3. This event has had a significant impact on the forest resource and is a primary cause of recent data trends.

However, the overall long-term trend in the catchment area is of maturing forest and increasing inventory. This should continue in the long-term once the impact of the hurricane damage has been managed and replacement forest areas begin to mature.

Figure 3: Standing volume by product category

Pine pulpwood inventory increased steadily by around 8 million m3 from 2000 to 2013, reaching a peak of 49 million m3. This then declined slightly to 46 million m3 in 2018 due to the maturing age class of the forest and pulpwood forest growing into the larger size class of chip-n-saw and saw-timber forest (Figure 4), in addition to an increase in pulpwood demand as biomass markets became operational and ramped up production. Following the hurricane in 2018, the pine pulpwood inventory dropped by more than 10 million m3. 

Replanting and reforestation of damaged areas will ensure that future pine pulpwood production will increase again once these forests start to mature.

In the period from 2000 to 2018 pine sawtimber standing volume increased by 41.5 million m3 (78%) and chip-n-saw by 19.6 million m3 (73%), indicating a maturing age class and a growing forest resource. The 2018 hurricane caused a reduction in standing volume in both of these product categories of 11.6 and 8 million m3respectively (12% and 17% of the 2018 volume). However, the increasing trend is likely to continue once the forest area recovers.

Figure 4: Standing volume by product category

The growth drain ratio (GDR) is the comparison of average annual growth to removals (typically harvesting), where the growth exceeds removals the GDR will be in excess of 1 and this is considered sustainable, where removals exceed growth then the GDR will be less than 1 and this is not sustainable if maintained in the long-term – although in the short-term this can be a factor of large areas of mature forest with low growth rates and high rates of harvesting, short periods of high demand for a particular product or salvage harvesting after a natural disturbance. The GDR should be considered over a longer time period to ensure it reflects the long-term trend. In the period from 2003 to 2020 the combined GDR for pine products averaged 1.52 with a high of 1.84 and a low of 1.08 (Figure 5).

Figure 5: Growth to drain ratio by product category

The maturing forest resources can be clearly seen from the growth to removals data for each product category. Average tree sizes getting larger and more pulpwood class stands moving into the larger saw-timber and chip-n-saw categories. This trend can be seen by comparing the data values from 2003 and 2018 where saw-timber average annual growth increased by 90% (1.6 million m3), and removals by 41% (0.98 million m3).  Chip-n-saw growth increased by 73% (1.3 million m3) whilst removals increased by 160% (1.9 million m3). Pulpwood growth decreased by 7.5% (0.4 million m3) whilst removals increased by 63% (1.6 million m3).  Over this time period the total annual surplus of pine growth compared to removals averaged 3.7 million m3 per year (Figure 6).

Figure 6: Pine growth and removals by product category and year

Hardwood saw-timber and pulpwood removals declined by 20% and 40% respectively between 2000 and 2018, whilst growth increased by 23% for hardwood saw-timber and declined by 16% for hardwood pulpwood. The average annual hardwood surplus over this time period was 1.5 million m3 per year (Figure 7).

Figure 7: Hardwood growth and removals by product category and year

Despite a short-term imbalance in some product categories, the overall surplus of pine growth compared to removals has remained strong, with an average of 3.3 million m3 between 2000 and 2020, which includes the increased salvage harvesting in 2018 (Figure 8).
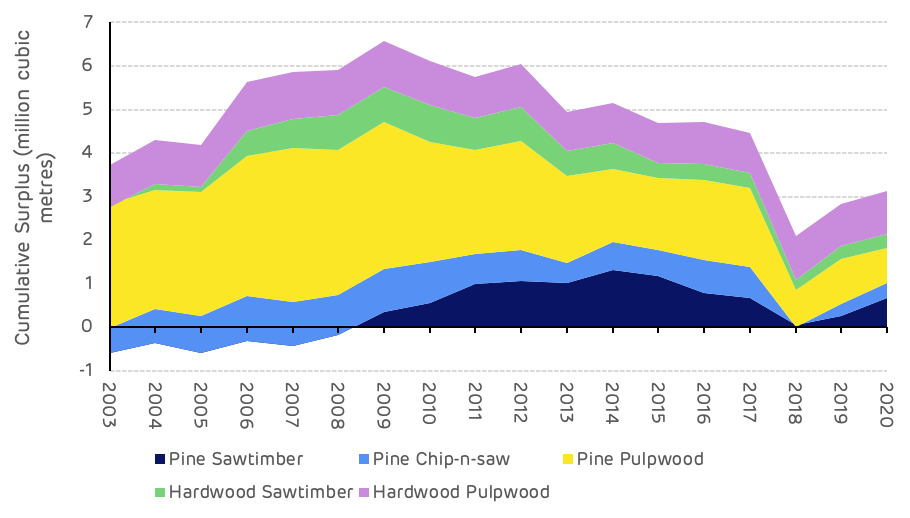
Figure 8: Cumulative annual surplus of growth compared to removals

Wood Prices

Stumpage price is the value paid to the forest owner for each category of product at the time of harvesting. The variation in prices in the Cottondale catchment area has been significant and shows some interesting trends. The higher value pine products (saw-timber and chip-n-saw) began with high stumpage values in 2000, as markets were strong for construction and furniture grade timber and supply limited at that stage due to the young age class and predominance of pulpwood stands at that time.  In 2008, following the global economic crisis and the crash in housing and construction markets, saw-timber prices declined substantially reaching a low of $23 per ton, a 47% decline from the 2000 price. This stumpage price has never recovered, despite an improvement in the economy and an increase in housing starts and demand for structural timber. The reason for the continued deflated saw-timber stumpage price is a substantial surplus of supply in this catchment area.  As the forest area has matured and more saw-timber grade stands are available, markets have been able to satisfy demand without an increase in price.

Pine pulpwood prices at Cottondale were lower than the US South-wide average in 2000 and remained relatively low until around 2013. A reduction in saw-timber production, and consequent reduction in mill residuals, due to the recession of 2008, led to a shortage of pulp mill feedstock and increased harvesting of pulpwood stands. This caused an increase in pine pulpwood stumpage values alongside an overall increase in demand as biomass and pellet markets began production around this time. The data shows a short-term spike in pine pulpwood stumpage prices in 2013-14, but this returned to a more normal trend as more saw-timber residues became available and pulpwood stumpage values have been around $10-11 per ton since 2015 (Figure 9).
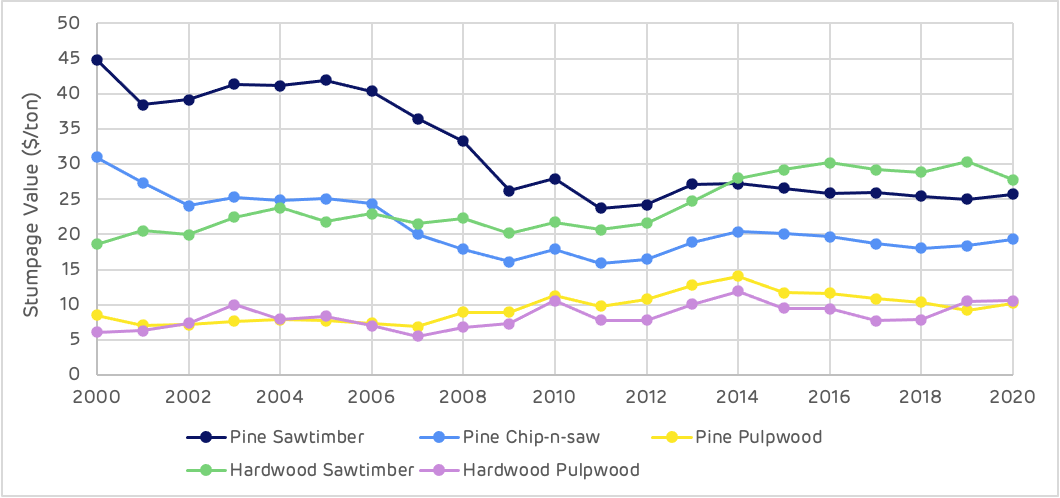
Figure 9: Variation in stumpage value over time

Biomass demand 

Biomass demand in the Cottondale catchment area began in 2008 and has averaged around 800 thousand m3per year since that time with a high of just over 1 million m3 in 2013 to 2015 and a low of 200 thousand m3 in 2008. Other pulpwood markets have had an average annual demand of 3.97 million m3 between 2000 and 2020 with a high of 4.76 million m3 in 2018 and a low of 3.2 million m3 in 2009.  In 2020 the biomass market represented 16% of the total pulpwood demand in the Cottondale catchment area (Figure 10).
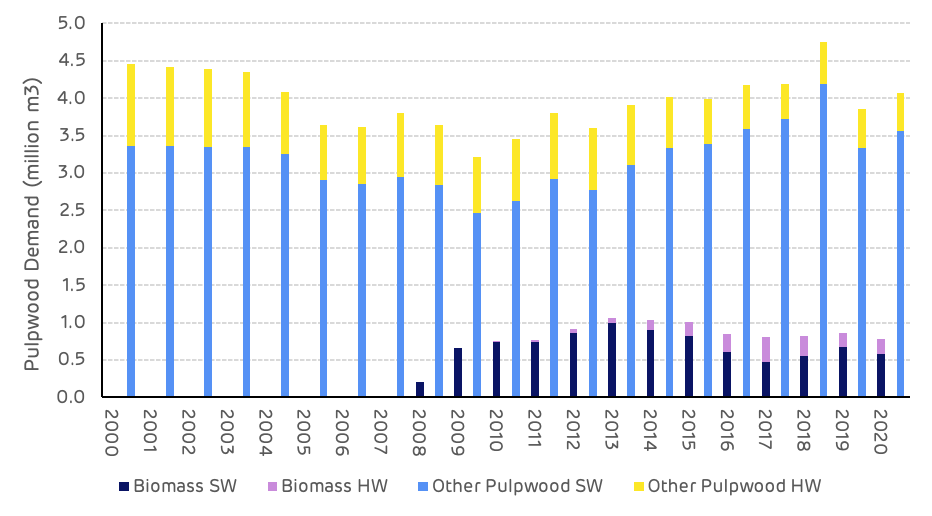
Figure 10: Total pulpwood demand

Forest Management

The average size of clear-cut harvesting sites from 2000 to 2020 has been 47 ha, ranging from 38 ha up to 56 ha. The average size of thinning sites has been 65 ha, ranging from 55 ha up to 76 ha. When isolating the period from 2000 to 2010 and 2011 to 2020, the averages and range remain very similar, suggesting that there has been no significant change in harvesting coupe size over this period.
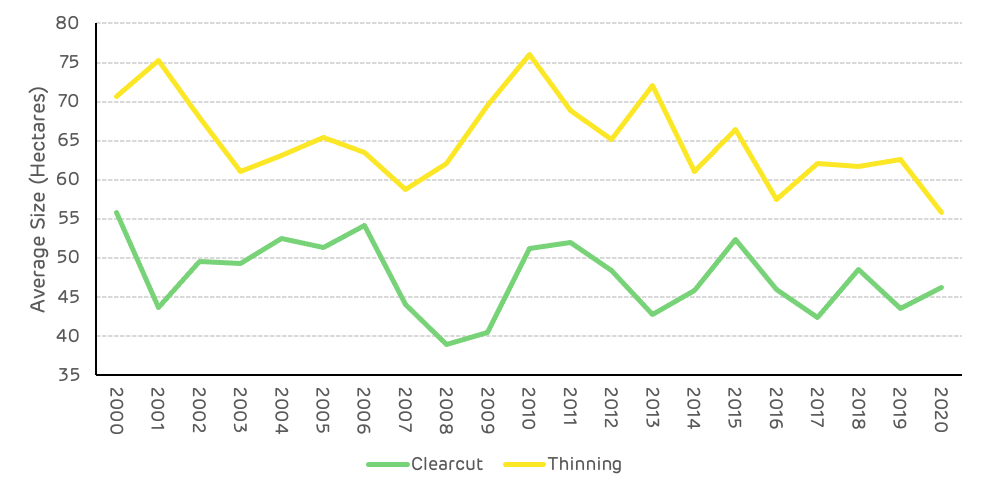
Figure 11: Average size of harvesting sites

The impact of biomass and wood pellet demand on the key metrics in this catchment area are considered below. This is a summary of Hood Consulting’s view on the trends and impacts in the Cottondale catchment area.

Is there any evidence that bioenergy demand has caused the following:

Deforestation?

No. US Forest Service (USFS) data shows a 55,166-hectare (+1.9%) increase in the total area of timberland in the Enviva Cottondale catchment area since the Enviva Cottondale pellet mill commenced production in 2008. Furthermore, a strong positive relationship was identified between biomass demand and timberland area, suggesting that the increase in timberland area since 2008 can be linked, to a degree, to increased demand attributed to bioenergy.

A change in management practices (rotation lengths, thinnings, conversion from hardwood to pine)?

Inconclusive. Changes in management practices have occurred in the catchment area over the last two decades. However, the evidence is inconclusive as to whether increased demand attributed to bioenergy has caused or is responsible for these changes.

Clearcuts and thinnings are the two major types of harvests that occur in this region, both of which are long-standing, widely used methods of harvesting timber. TimberMart-South (TMS) data shows that thinnings accounted for 63% of total reported harvest area in the Cottondale market from 2005-2011 but only 39% of total harvest area reported from 2012-2020. Specifically, the decreased prevalence of thinning since 2012 can be linked to the strengthening of pine pulpwood markets and concurrent weakening of pine sawtimber markets beginning in the mid-2000s.

Prior to the bursting of the US housing bubble in 2006, timber management in this market had been driven to a large degree by pine sawtimber production. However, challenging market conditions saw pine sawtimber stumpages prices decline more than 40% from 2006-2011. At the same time, pine pulpwood markets started to strengthen, with pine pulpwood stumpage prices increasing more than 50% from 2006-2010. So, with sawtimber markets weakening and pulpwood markets strengthening, the data suggests that many landowners decided to alter their management approach (i.e. to take advantage of strong pulpwood markets) and focus on short pulpwood rotations that typically do not utilize thinnings.

Bioenergy has had an impact on this market by adding an average of roughly 680,000 metric tons of additional pine pulpwood demand to this catchment area annually since 2008. However, bioenergy has accounted for only 17% of total softwood pulpwood demand in this market since Enviva Cottondale’s startup. Ultimately, the shift in management approach that occurred in this market can be more closely linked to other factors, such as increased softwood pulpwood demand from non-bioenergy sources (i.e. pulp/paper) as well as the weakening of pine sawtimber markets.

Diversion from other markets?

No. Demand for softwood (pine) sawlogs increased an estimated 23% in the Cottondale catchment area from 2008-2020. Also, there is no evidence that increased demand from bioenergy has caused a diversion from other softwood pulpwood markets (i.e. pulp/paper), as softwood pulpwood demand not attributed to bioenergy has increased 25% since the Cottondale mill’s startup in 2008.

An unexpected or abnormal increase in wood prices?

Inconclusive. The startup of Enviva Cottondale added more than 900,000 metric tons of softwood pulpwood demand to the catchment area from 2008-2013, and this increase in demand coincided with a 28% increase in the delivered price of pine pulpwood (PPW) – the primary roundwood product consumed by the Enviva Cottondale mill. However, since 2013, delivered PPW prices have held flat, despite biomass-related softwood pulpwood demand falling to an average of roughly 635,000 tons per year since 2016, down more than 40% compared to 2013 peak levels. (Note the decrease in roundwood consumption was due to a higher utilization of secondary residuals). It’s also important to point out that the roughly 410,000-metric ton decrease in softwood biomass demand from 2013 to 2020 was offset by a roughly 455,000-metric ton increase in softwood pulpwood demand from other sources.

Statistical analysis did identify a positive relationship between softwood biomass demand and delivered PPW price. However, that relationship was found to be relatively weak. The relationship between delivered PPW price and softwood pulpwood demand from other sources was found to be much stronger, which was not unexpected to find given that softwood pulpwood demand not attributed to bioenergy has accounted for 83% of total softwood pulpwood demand in the catchment area since 2008.

Furthermore, there is some evidence linking the increase in pine sawmill chip prices to increased consumption of secondary pine residuals by Enviva Cottondale. Specifically, consumption of secondary pine residuals by Enviva Cottondale more than doubled from roughly 213,000 metric tons in 2012 to nearly 490,000 metric tons in 2016, and this increased consumption of pine residuals coincided with a nearly 20% increase in the price of pine sawmill chips. However, increased consumption of residuals by the bioenergy sector was only one of several contributing factors that can be linked to the increase in pine sawmill chip prices. Increased consumption of pine residuals by the pulp/paper industry also contributed to higher pine sawmill chip prices. In addition, there is a strong linkage between pine sawmill chip prices and softwood lumber production. Specifically, the increase in softwood lumber production that begun in the early-to-mid-2010s consequently resulted in the increased production of secondary residuals, and the increased availability of this lower-cost material led to greater competition and ultimately higher pine residual prices.

A reduction in growing stock timber?

No. From 2008 (the year Enviva Cottondale commenced production) up until Hurricane Michael struck in late-2018, total growing stock inventory increased an average of 1.8% per year (+19% total) in the Cottondale catchment area. Specifically, inventories of pine sawtimber and pine chip-n-saw increased 58% and 28%, respectively, while pine pulpwood (PPW) inventory decreased 4% over this same period.

However, note that the decrease in pine pulpwood inventory from 2008-2018 was not due to increased demand from bioenergy or increased harvesting above the sustainable yield capacity of the forest area, as annual growth of pine pulpwood exceeded annual removals every year throughout this period. Rather, this slight decrease in PPW inventory levels is more a reflection of the aging of the catchment area forest and the movement of stands classified as pulpwood to stands classified as chip-n-saw.

A reduction in the sequestration rate of carbon?

No. US Forest Service (USFS) data shows the average annual growth rate of total growing stock timber in the Cottondale catchment area decreased from 5.9% in 2008 to 5.2% in 2020, suggesting that the sequestration rate of carbon also declined slightly over this period. However, there is little evidence to suggest that increased demand attributed to bioenergy is responsible for this change.

The reduction in overall growth rate (and therefore reduction in the sequestration rate of carbon) is more a reflection of the aging of the catchment area forest. Specifically, growth rates decline as timber ages, and this is exactly what USFS data shows in the Cottondale catchment area, with the average age of growing stock timber increasing from less than 44 years of age in 2008 to nearly 46 years of age in 2020.

An increase in harvesting above the sustainable yield capacity of the forest area?

No. Growth-to-removals (G:R) ratios, which compare annual timber growth to annual timber removals, provides a measure of market demand relative to supply as well as a gauge of market sustainability. In 2020, the latest available, the G:R ratio for pine pulpwood (PPW), the predominant timber product utilized by the bioenergy sector, equaled 1.26 (recall that a value greater than 1.0 indicates sustainable harvest levels).

Note, however, that the PPW G:R ratio averaged 1.57 in the catchment area from 2013-2017 before falling to 1.20 in 2018 and averaging 1.27 since. This notable drop in 2018 was due to a nearly 35% increase in PPW removals (due to Hurricane Michael). It’s also important to note that while annual removals have moved back in line with pre-Michael levels since 2019, this lower PPW G:R ratio is likely reflective of the new norm (at least over the midterm). Hurricane Michael destroyed an estimated 22% of total pine pulpwood inventory in the Cottondale catchment area, and this loss in inventory will be reflected in reduced growth until the destroyed forests regenerate. However, in spite of this loss, adequate PPW inventory levels still remain and sustainable market conditions are expected to persist moving forward.

Timber growing stock inventory

Neutral. According to USFS data, inventories of pine pulpwood (PPW) decreased 25% in the catchment area from 2008-2020. However, this substantial decrease was due to Hurricane Michael, which destroyed nearly 520,000 hectares of catchment area timberland when it hit the Florida panhandle in late-2018. Prior to this event occurring, PPW inventory levels had held relatively steady, decreasing slightly but averaging 47.2 million m3 in the catchment area from 2008-2018. However, the destruction caused by Hurricane Michael resulted in the immediate loss of more than 10.3 million m3 of PPW inventory, or a 22% decrease compared to pre-hurricane levels.

Moreover, the slight decrease in PPW inventory levels that did occur from 2008-2018 was not due to increased demand from bioenergy. Typically, a reduction in inventory is linked to harvest levels above the sustainable yield capacity of the forest area, but in the Cottondale catchment area, annual growth of PPW exceeded annual removals every year throughout this period. Ultimately, the decrease in PPW inventory from 2008-2018 can be more closely linked to decreased pine sawtimber production beginning in the early to mid-2000s. Specifically, annual removals of pine sawtimber decreased 28% from 2003-2014, and the reduction in harvest levels over this period translated to a reduction in newly-re-established pine stands and ultimately the slight reduction in PPW inventory levels that occurred in the mid-to-late 2010s.

Timber growth rates

Neutral. Overall, timber growth rates declined slightly in the catchment area from 2008 (the year Enviva Cottondale commenced operations) through 2020. However, this decrease in timber growth rates was not due to increased demand attributed to bioenergy but rather to the aging of the catchment area forest. Specifically, USFS data shows the average age timber inventory in the Cottondale catchment area increased from an estimated 43.6 years of age in 2008 to 45.7 years of age in 2020.

Forest area

Positive. In the Enviva Cottondale catchment area, total forest area (i.e. timberland) increased more than 55,100 hectares (+1.9%) from 2008 through 2020, and this increase can be linked to several factors, including increases in softwood pulpwood demand (from both bioenergy and other sources) as well as conversion from farmland.

Specifically, the more than 55,100-hectare increase in catchment area timberland from 2008-2020 coincided with a 1.1-million metric ton increase in annual softwood pulpwood demand (roughly half of which was attributed to bioenergy). While statistical analysis identified moderately strong positive relationships between timberland area and both softwood biomass demand and non-bioenergy-related softwood pulpwood demand, a strong positive correlation was found between timberland and total softwood pulpwood demand – suggesting that the increases in timberland since 2008 can be attributed, in part, to the increase in total softwood pulpwood demand (from both bioenergy and other sources).

The more than 55,100-hectare increase timberland from 2008-2020 also coincided with a roughly 75,000-hectare decrease in farmland (i.e. cropland, woodland, and pastureland) over this period. Specifically, the catchment area experienced a roughly 31,800-hectare loss in cropland, 8,900-hectare loss in pastureland, and 34,300-hectare loss in woodland from 2008-2020. Furthermore, statistical analysis confirmed this inverse relationship, identifying a strong negative correlation between timberland and farmland in the Cottondale catchment area.

Wood prices

Negative / Positive. Total softwood pulpwood demand attributed to bioenergy in the Cottondale catchment area increased from zero tons in 2007 (the year prior to Enviva Cottondale’s startup) to over 1.0 million metric tons in 2013. Over this same period, the price of delivered pine pulpwood (PPW) – the predominant roundwood product utilized by Enviva Cottondale for wood pellet production – increased 42% (from $21.06 per ton in 2007 to $29.82 per ton in 2013).

However, the apparent link between increased softwood biomass demand and increased delivered PPW price is only loosely supported by statistical analysis, which identified a relatively weak positive relationship between these two variables. Furthermore, delivered PPW price has remained nearly unchanged in the catchment area since 2013, despite softwood biomass demand declining and averaging roughly 577,000 metric tons per year since 2016. (Note that the roughly 410,000-metric ton decrease in softwood biomass demand from 2013-2020 was offset by a roughly 455,000-metric ton increase in softwood pulpwood demand from other sources). Ultimately, the increase in delivered PPW prices in the catchment area can be linked to increased demand for softwood pulpwood from all sources, and roughly half of the 1.2-million metric ton increase in softwood pulpwood demand since 2007 can be attributed to bioenergy.

However, it’s also important to note that the increase in bioenergy-related wood demand has been a positive for forest landowners in the Enviva Cottondale catchment area. Not only has bioenergy provided an additional outlet for pulpwood in this market, but the increase in delivered PPW price resulting from increased softwood pulpwood demand from bioenergy has transferred through to landowners in the form of higher PPW stumpage prices. Specifically, over the six years prior to Enviva Cottondale’s startup, PPW stumpage price – the price paid to landowners – averaged roughly $7.40 per ton in the Cottondale catchment area. However, since 2010, PPW stumpage prices have averaged more than $11.15 per ton, representing a more than 50% increase compared to pre-mill startup levels.

Markets for solid wood products

Positive. In the Enviva Cottondale catchment area, demand for softwood sawlogs used to produce lumber and other solid wood products increased an estimated 23% from 2008-2020. This increase in softwood lumber production has consequentially resulted in an increase in sawmill residuals (i.e. chips, sawdust, and shavings) – by-products of the sawmilling process and materials utilized by Enviva Cottondale to produce wood pellets.

Specifically, softwood sawlog demand has increased more than 16% in the catchment area since 2014, and this increase in demand has coincided with a nearly 60% increase in pine residual purchases by Enviva Cottondale. (Note that pine residuals constituted 25% of total raw material purchases by Enviva Cottondale in 2014 but 41% of total raw material purchases in 2020). So, not only has Enviva Cottondale benefited from the greater availability of this sawmill by-product, but lumber producers have also benefited, as Enviva Cottondale has provided an additional outlet for these producers and their by-products.

Read the full report: Enviva Cottondale pellet plant catchment area analysis

This is part of a series of catchment area analyses around the forest biomass pellet plants supplying Drax Power Station with renewable fuel. Others in the series can be found here

What is direct air carbon capture and storage (DACS)?

What is direct air carbon capture and storage (DACS)?

Direct air carbon capture and storage (DACS, sometimes referred to as DAC or DACCS) is one of the few technologies that can remove carbon dioxide (CO2) from the atmosphere. Unlike other carbon removal technologies that capture CO2 emissions during the process of generating electricity or heat, DACS can be deployed anywhere in the world it can tap into a supply of electricity.

CO2 removal is crucial to meeting the international climate goals set by the 2015 Paris Agreement. But it’s not enough just to cut CO2 emissions, to achieve net zero, it will also be necessary to remove the CO2 that two centuries of industrialisation have released into the environment. As a technology that removes more CO2 from the atmosphere than it releases – assuming it is powered by green electricity – DACS has the potential to play a key role in this process.

Key direct air capture facts

How does DACS work?

DACS could be described as a form of industrial photosynthesis. Just as plants use photosynthesis to convert sunlight and CO2 into sugar, DACS systems use electricity to remove CO2 from the atmosphere using fans and filters.

Air is drawn into the DACS system using an industrial scale fan. Liquid DACS systems pass the air through a chemical solution which removes the CO2 and returns the rest of the air back into the atmosphere.

Solid DACS systems captures CO2 on the surface of a filter covered in a chemical agent, where it then forms a compound. The new compound is heated, releasing the CO2 to be captured and separating it from the chemical agent, which can then be recycled.

The captured CO2 can then be compressed under very high pressure and pumped via pipelines into deep geological formations. This permanent storage process is known as ‘sequestration’.

Alternatively, the CO2 can be pumped under low pressure for immediate use in commercial processes, such as carbonating drinks or cement manufacturing.

A 2021 study by the Coalition for Negative Emissions shows that DACS could provide at least 1Gt of sustainable negative emissions by 2025

DACS fast facts

What role can DACS play in decarbonisation?

CO2 is in the air at the same concentration everywhere in the world. This means that DACS plants can be located anywhere, unlike carbon capture systems that remove CO2 from industrial processes at source.

There are 15 DACS plants currently in operation worldwide – Climeworks operates three in Switzerland, Iceland and Italy. Together, these small-scale plants capture approximately 9,000 tonnes of CO2 per annum. The first large-scale plant, currently being developed in the Permian Basin, Texas, is expected to capture 1,000,000 tonnes (one megatonne) per annum when it becomes operational in 2025.

At just 0.04%, the concentration of CO2 in the atmosphere is very dilute which makes removing and storing it a challenge. This means that DACS costs significantly more than some other CO2 capture technologies – between $200 and $600 (£156-468) per metric tonne. The process also requires large amounts of energy, which adds to the demand for electricity.

However, DACS has the potential to become an important piece in the jigsaw of CO2 removal technologies and techniques that includes nature-based solutions such as planting forests, along with bioenergy with carbon capture and storage (BECCS), soil sequestration and ‘blue carbon’ marine initiatives.

Go deeper

Button: What is bioenergy with carbon capture and storage (BECCS)?

The apprenticeships of the future

In brief

  • Apprenticeships are widely available at Drax, not just in engineering

  • Hear what our existing apprentices think about the opportunities they’ve taken

  • Discover where to find out more: could you be the next Drax apprentice?

Apprenticeships are changing – once mainly the domain of school leavers entering a trade, they are now a possibility for people at many different career stages, in countless industries.

At Drax, we offer a wide range of apprenticeships across a variety of business areas, from engineering to data science. The scheme covers costs to individuals without affecting employee salaries or benefits, whilst providing sufficient support and protected study time.

“Take the opportunity! We’re very lucky to have the chance to complete apprenticeships while working.”

— Beka Mantle, apprentice

By undertaking the apprenticeship, people can learn a new set of skills to improve their knowledge and expertise, boost their career opportunities and gain invaluable experience.

What is an apprenticeship?

An apprenticeship is made up of learning with a training provider and practical experience on the job.

Apprenticeships can benefit Drax by attracting new talent while also developing existing colleagues and future-proofing our workforce to help achieve our ambition to become carbon negative by 2030.

Apprentice Q&A

The following insights from Drax employees highlight the opportunities that apprenticeships can give them and what they have learnt so far.

Joe Clements

Job title: Technical Engineering Trainee

Apprenticeship: Mechanical Engineering Pathway Continuation

Q: What are the benefits of an apprenticeship?

A: It’s put me in positions that I might not have found myself in before, forcing me to learn fast and adapt. It’s also benefiting Drax as I’m constantly learning and developing within my team. On completion, I should be ready to go straight into an engineering role.

Q: What are the challenges?

A: Balancing your work and study, especially as you grow into the role and take on more tasks. However, you’re guaranteed learning hours on a weekly basis.

Lois Cheatle

Job title: Finance Graduate

Apprenticeship: Accountancy and Taxation

Q: Why did you want to do an apprenticeship?

A: Having graduated from university and taken a year out, I wanted to further improve on the skills I’d learnt. An apprenticeship has allowed me to develop these skills both from learning on the job and having technical support from my training provider as I worked my way through my accountancy qualification.

It’s also given me the opportunity to develop soft skills such as communication and building relationships, which is part of the professional development side of the apprenticeship.

Alex Hegarty

Job title: Data Science Analyst

Apprenticeship: Data Science

Q: How was your apprenticeship application process?

A: It was fairly straightforward – Louisa Russell (Early Careers Manager at Drax) helped me with my enrolment. To qualify for the course, I had to complete a quiz to prove I had basic proficiency in programming.

Q: What’s the best thing about doing an apprenticeship?

A: Having experts with extensive knowledge of the subject who you can pester with questions.

Beka Mantle

Job title: 4E Business Lead

Apprenticeship: Improvement Specialist

Q: Have you felt supported? 

A: Very. My line manager is always checking in to see how I’m getting on and offering support, and I have catch ups with the Early Careers team. I also meet my apprenticeship tutor at least bi-weekly, and he’s always there to answer any questions and talk things through. I’m also lucky to have someone else on my team who’s working through the same apprenticeship – it’s great when we need to practise something or bounce ideas off each other.

Q: What would you say to anyone thinking of doing an apprenticeship? 

A: Take the opportunity! We’re very lucky to have the chance to complete apprenticeships while working, and I’m grateful to have the support of so many people around me while I’m on this journey.

Chris Hughes

Job Title: Seconded to Supplier Relationship Manager

Apprenticeship: Regulatory Compliance

Q: What’s the best thing about it?

A: Making new friends from different sectors, such as councils and environmental health, and gaining an insight into their working lives and how compliance plays its part. It’s also motivating to get continuous positive feedback about my strong coursework and presentations.

Jason Reeve

Job title: Collections Manager – line manager to Chris Hughes and Jessica Leason, Supplier Relationship Manager

Q: How do you manage study commitments?

A: I’ve made sure that both Chris and Jessica have had dedicated study time blocked out in their diaries. In our 1:1s, we’ve discussed progress and looked at the assessment criteria to make sure they’ve been involved with projects giving them valuable experience to support their apprenticeship.

Q: Why is it important to support colleagues doing apprenticeships?

A: It’s vital to develop your team – as a manager, a large part of my success is down to the skills and expertise my team brings to the table. Helping Chris and Jess through their apprenticeship has really aided their personal development, knowledge and skills. I soon started seeing the benefit in terms of what they were bringing to the team, their contribution to the department and their own confidence.

Their continued development through the scheme has helped keep their passion alive for their roles and driven their success.

Go deeper

Find out more about the apprenticeships we offer at Drax, as well as our other career opportunities here.

What is bioenergy with carbon capture and storage (BECCS)?

What is bioenergy with carbon capture and storage (BECCS)? 

Bioenergy with carbon capture and storage (BECCS) is the process of capturing and permanently storing carbon dioxide (CO2) from biomass (organic matter) energy generation.

Why is BECCS important for decarbonisation? 

Bioenergy has very low net carbon emissions when biomass is sustainably sourced from forests that are managed to regrow at least as fast as they are harvested. This means that carbon taken up by the regrowing forests compensates for the carbon released when biomass is combusted.

When sustainable bioenergy is paired with carbon capture and storage it becomes a source of negative emissions, as CO2 is permanently removed from the carbon cycle.

Experts believe that negative emissions technologies (NETs) are crucial to helping countries meet the long-term goals set out in the Paris Climate Agreement. As BECCS is the most scalable of these technologies this decade, it has a key role to play in combating climate change.

How is the bioenergy for BECCS generated?

Most bioenergy is produced by combusting biomass as a fuel in boilers or furnaces to produce high-pressure steam that drives electricity-generating turbines. Alternatively, bioenergy generation can use a wide range of organic materials, including crops specifically planted and grown for the purpose, as well as residues from agriculture, forestry and wood products industries. Energy-dense forms of biomass, such as compressed wood pellets, enable bioenergy to be generated on a much larger scale. Fuels like wood pellets can also be used as a substitute for coal in existing power stations.

How is the carbon captured?

BECCS uses a post-combustion carbon capture process, where solvents isolate CO2 from the flue gases produced when the biomass is combusted. The captured CO2 is pressurised and turned into a liquid-like substance so it can then be transported by pipeline.

How is the carbon stored?

Captured CO2 can be safely and permanently injected into naturally occurring porous rock formations, for example unused natural gas reservoirs, coal beds that can’t be mined, or saline aquifers (water permeable rocks saturated with salt water). This process is known as sequestration.

Over time, the sequestered CO2 may react with the minerals, locking it chemically into the surrounding rock through a process called mineral storage.

BECCS fast facts

  • Two 600+ megawatt (MW) biomass units, upgraded with carbon capture technology, could deliver 40% of the negative emissions the Climate Change Committee indicates will be needed from BECCS for the UK to reach net-zero by 2050
  • BECCS has the potential to remove 20-70 million tonnes of CO2 per year in the UK by 2050
  • All National Grid’s Net Zero Future Energy Scenarios (FES) deploy BECCS by 2028 and see a rapid increase in capacity in the 2030s
  • There are 70 billion tonnes of potential CO2 storage space around the UK, according to the British Geological Survey

Is BECCS sustainable?

 Bioenergy can be generated from a range of biomass sources ranging from agricultural by-products to forestry residues to organic municipal waste. During their lifetime plants absorb CO2 from the atmosphere, this balances out the CO2that is released when the biomass is combusted.

What’s crucial is that the biomass is sustainably sourced, be it from agriculture or forest waste. Responsibly managed sources of biomass are those which naturally regenerate or are replanted and regrown, where there’s a increase of carbon stored in the land and where the natural environment is protected from harm.

Biomass wood pellets used as bioenergy in the UK, for example, are only sustainable when the forests they are sourced from continue to grow. Sourcing decisions must be based on science and not adversely affect the long-term potential of forests to store and sequester carbon.

Biomass pellets can also create a sustainable market for forestry products, which serves to encourage reforestation and afforestation – leading to even more CO2 being absorbed from the atmosphere.

Go deeper:

  • The triple benefits for the environment and economy of deploying BECCS in the UK.
  • How BECCS can offer essential grid stability as the electricity system moves to low- and zero-carbon sources.
  • Producing biomass from sustainable forests is key to ensuring BECCS can deliver negative emissions.
  • 5 innovative projects where carbon capture is already underway around the world
  • 7 places on the path to negative emissions through BECCS

Global collaboration
is key to tackling
the climate crisis

Leaders from 40 countries are meeting today, albeit virtually, as part of President Joe Biden’s Leaders’ Summit on Climate. The event provides an opportunity for world leaders to reaffirm global efforts in the fight against climate change, set a clear pathway to net zero emissions, while creating jobs and ensuring a just transition.

Since taking office President Biden has made bold climate commitments and brought the United States back into the Paris Agreement. Ahead of the two-day summit, he announced an ambitious 2030 emissions target and new Nationally Determined Contributions. The US joins other countries that have announced significant reduction goals. For example, the EU committed to reduce its emissions by at least 55%, also South Korea, Japan and China have all set net-zero targets by mid-century.

Here in the UK, Prime Minister Boris Johnson this week outlined new climate commitments that will be enshrined in law. The ambitious new targets will see carbon emissions cut by 78% by 2035, almost 15 years earlier than previously planned. If delivered, this commitment which is in-line with the recommendations of the Climate Change Committee’s sixth carbon budget will put the UK at the forefront of climate action, and for the first time the targets include international aviation and shipping.

What makes climate change so difficult to tackle is that it requires collaboration from many different parties on a global scale never seen before. As a UK-North American sustainable energy company, with communities on both sides of the Atlantic, at Drax we are keenly aware of the need for thinking that transcends borders, creating a global opportunity for businesses and governments to work together towards a shared climate goal. That’s why we joined other businesses and investors in an open letter supporting the US government’s ambitious climate actions.

Collaboration between countries and industries

It’s widely recognised that negative emissions technologies will be key to global efforts to combat climate change.

At Drax we’re pioneering the negative emissions technology bioenergy with carbon capture and storage (BECCS) at our power station in North Yorkshire, which when up and running in 2027 will capture millions of tonnes of carbon dioxide (CO2) per year, sending it for secure storage, permanently locking it away deep under the North Sea.

Experts on both sides of the Atlantic consider BECCS essential for reaching net zero. The UK’s Climate Change Committee says it will play a major role in removing CO2 emissions that will remain in the UK economy after 2050 from industries such as aviation and agriculture that will be difficult to fully decarbonise. Meanwhile, a report published last year by New York’s Columbia University revealed that rapid development of BECCS is needed within the next 10 years in order to curb climate change and a recent report from Baringa, commissioned by Drax, showed it will be a lot more expensive for the UK to reach its legally binding fifth carbon budget between 2028 and 2031 without BECCS.

A shared economic opportunity

Globally as many as 65 million well-paid jobs could be created through investment in clean energy systems. In the UK, BECCS and negative emissions are not just essential in preventing the impact of climate change but will also be a key component of a post-Covid economy.

Government and private investments in clean energy technologies can create thousands of well-paid jobs, new careers, education opportunities and upskill workforces. Developing BECCS at Drax Power Station, for example, would support around 17,000 jobs during the peak of construction in 2028, including roles in construction, local supply chains and the wider economy. It would also act as an anchor project for the Zero Carbon Humber initiative, which aims to create the world’s first net zero industrial cluster. Developing a carbon capture, usage, and storage (CCUS) and hydrogen industrial cluster could spearhead the creation and support of tens of thousands of jobs across the Humber region and more than 200,000 around the UK in 2039.

Under the Humber Bridge

Additional jobs would be supported and created throughout our international supply chain. This includes the rail, shipping and forestry industries that are integral to rural communities in the US South and Western Canada.

A global company

As a British-North American company, Drax embodies the positive impact that clean energy investments have. We directly employ 3,400 people in the US, Canada, and the UK, and indirectly support thousands of families through our supply chains on both sides of the Atlantic. Drax is strongly committed to supporting the communities where we operate by investing in local initiatives to support the environment, jobs, education, and skills.

From the working forests of the US South and Western Canada to the Yorkshire and Humber region, and Scotland, we have a world-leading ambition to be carbon negative by 2030. At Drax, we believe the challenge of climate change is an opportunity to improve the environment we live in. We have reduced our greenhouse gas emissions by over 80% and transformed into Europe’s largest decarbonisation project. Drax Power Station is the most advanced BECCS project in the world and we stand ready to invest in this cutting-edge carbon capture and removal technology. We can then share our expertise with the rest of the world – a world where major economies are committing to a net zero future and benefiting from a green economic recovery.

If we are to reach the targets set in Paris, global leaders must lock in this opportunity and make this the decade of delivery.