Tag: sustainability

The key to sustainable forests? Thinking globally and managing locally

Key takeaways:

  • Working forests, where wood products are harvested, are explicitly managed to balance environmental and economic benefits, while encouraging healthy, growing forests that store carbon, provide habitats for wildlife, and space for recreation.
  • But there is no single management technique. The most effective methods vary depending on local conditions.
  • By employing locally appropriate methods, working forests have grown while supporting essential forestry industries and local economies.
  • Forests in the U.S. South, British Columbia, and Estonia all demonstrate how local management can deliver both environmental and economic wins.

Forests are biological, environmental, and economic powerhouses. Collectively they are home to most of the planet’s terrestrial biodiversity. They are responsible for absorbing 7.6 billion tonnes of carbon dioxide (CO2) equivalent per year, or roughly 1.5 times the amount of CO2 produced by the United States on an annual basis. And working forests, which are actively managed to generate revenue from wood products industries, are important drivers for the global economy, employing over 13 million people worldwide and generating $600 billion annually.

But as important as forests are globally, the key to maximizing working forests’ potential lies in smart, active forest management. While 420 million hectares of forest have been lost since 1990 through conversion to other land uses such as for agriculture, many working forests are actually growing both larger and healthier due to science-based management practices.

The best practices in working forests balance economic, social, and environmental benefits. But just as importantly, they are tailored to local conditions and framed by appropriate regional regulations, guidance, and best-practice.

The following describes how three different regions, from which Drax sources its biomass, manage their forests for a sustainable future.

British Columbia: Managing locally for global climate change

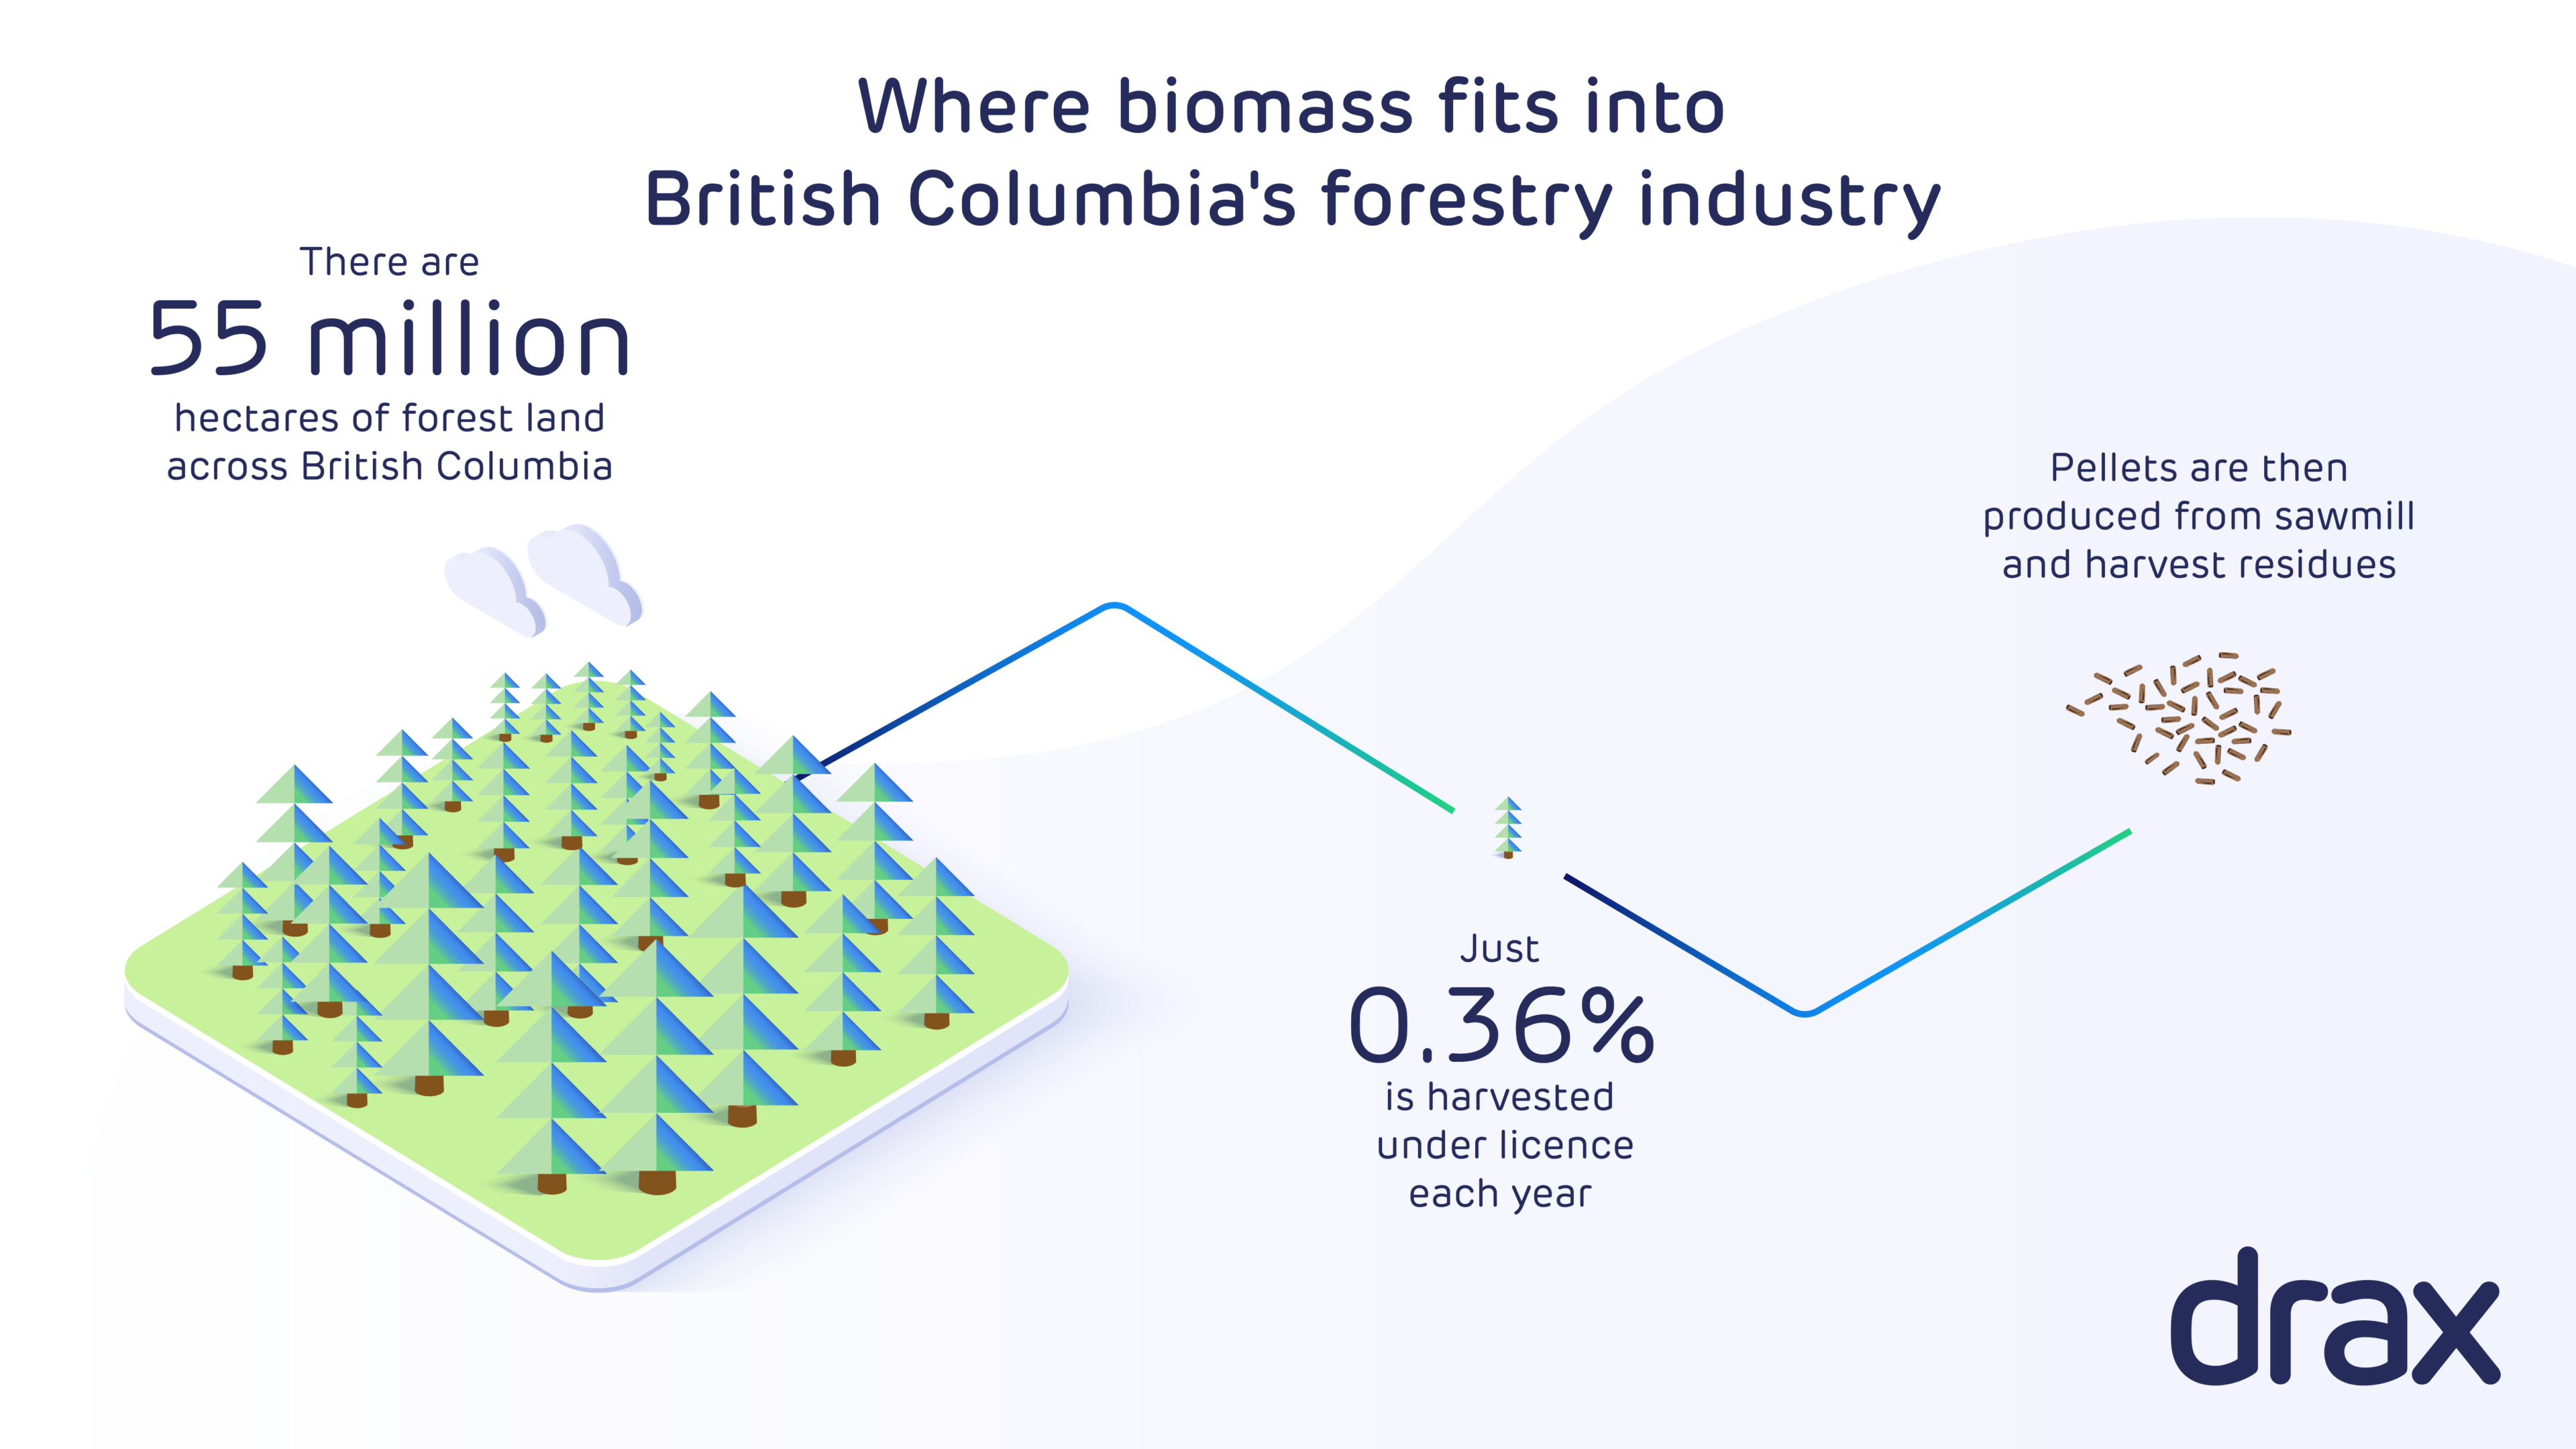
British Columbia is blanketed by almost 60 million hectares of forest – an area larger than France and Germany combined. Over 90% of the forest land is owned by Canada’s government, meaning the province’s forests are managed for the benefit of the Canadian people and in collaboration with First Nations.

From the province’s expanse of forested land, less than half a percent (0.36%) is harvested each year, according to government figures. This ensures stable, sustainable forests. However, there’s a need to manage against natural factors.

Click to view/download

In 2017, 2018, and 2020 catastrophic fires ripped through some of British Columbia’s most iconic forest areas, underscoring the threat climate change poses to the area’s natural resources. One response was to increase the removal of stands of trees in the forest, harvesting the large number of dead or dying trees created by pests that have grown more common in a warming climate.

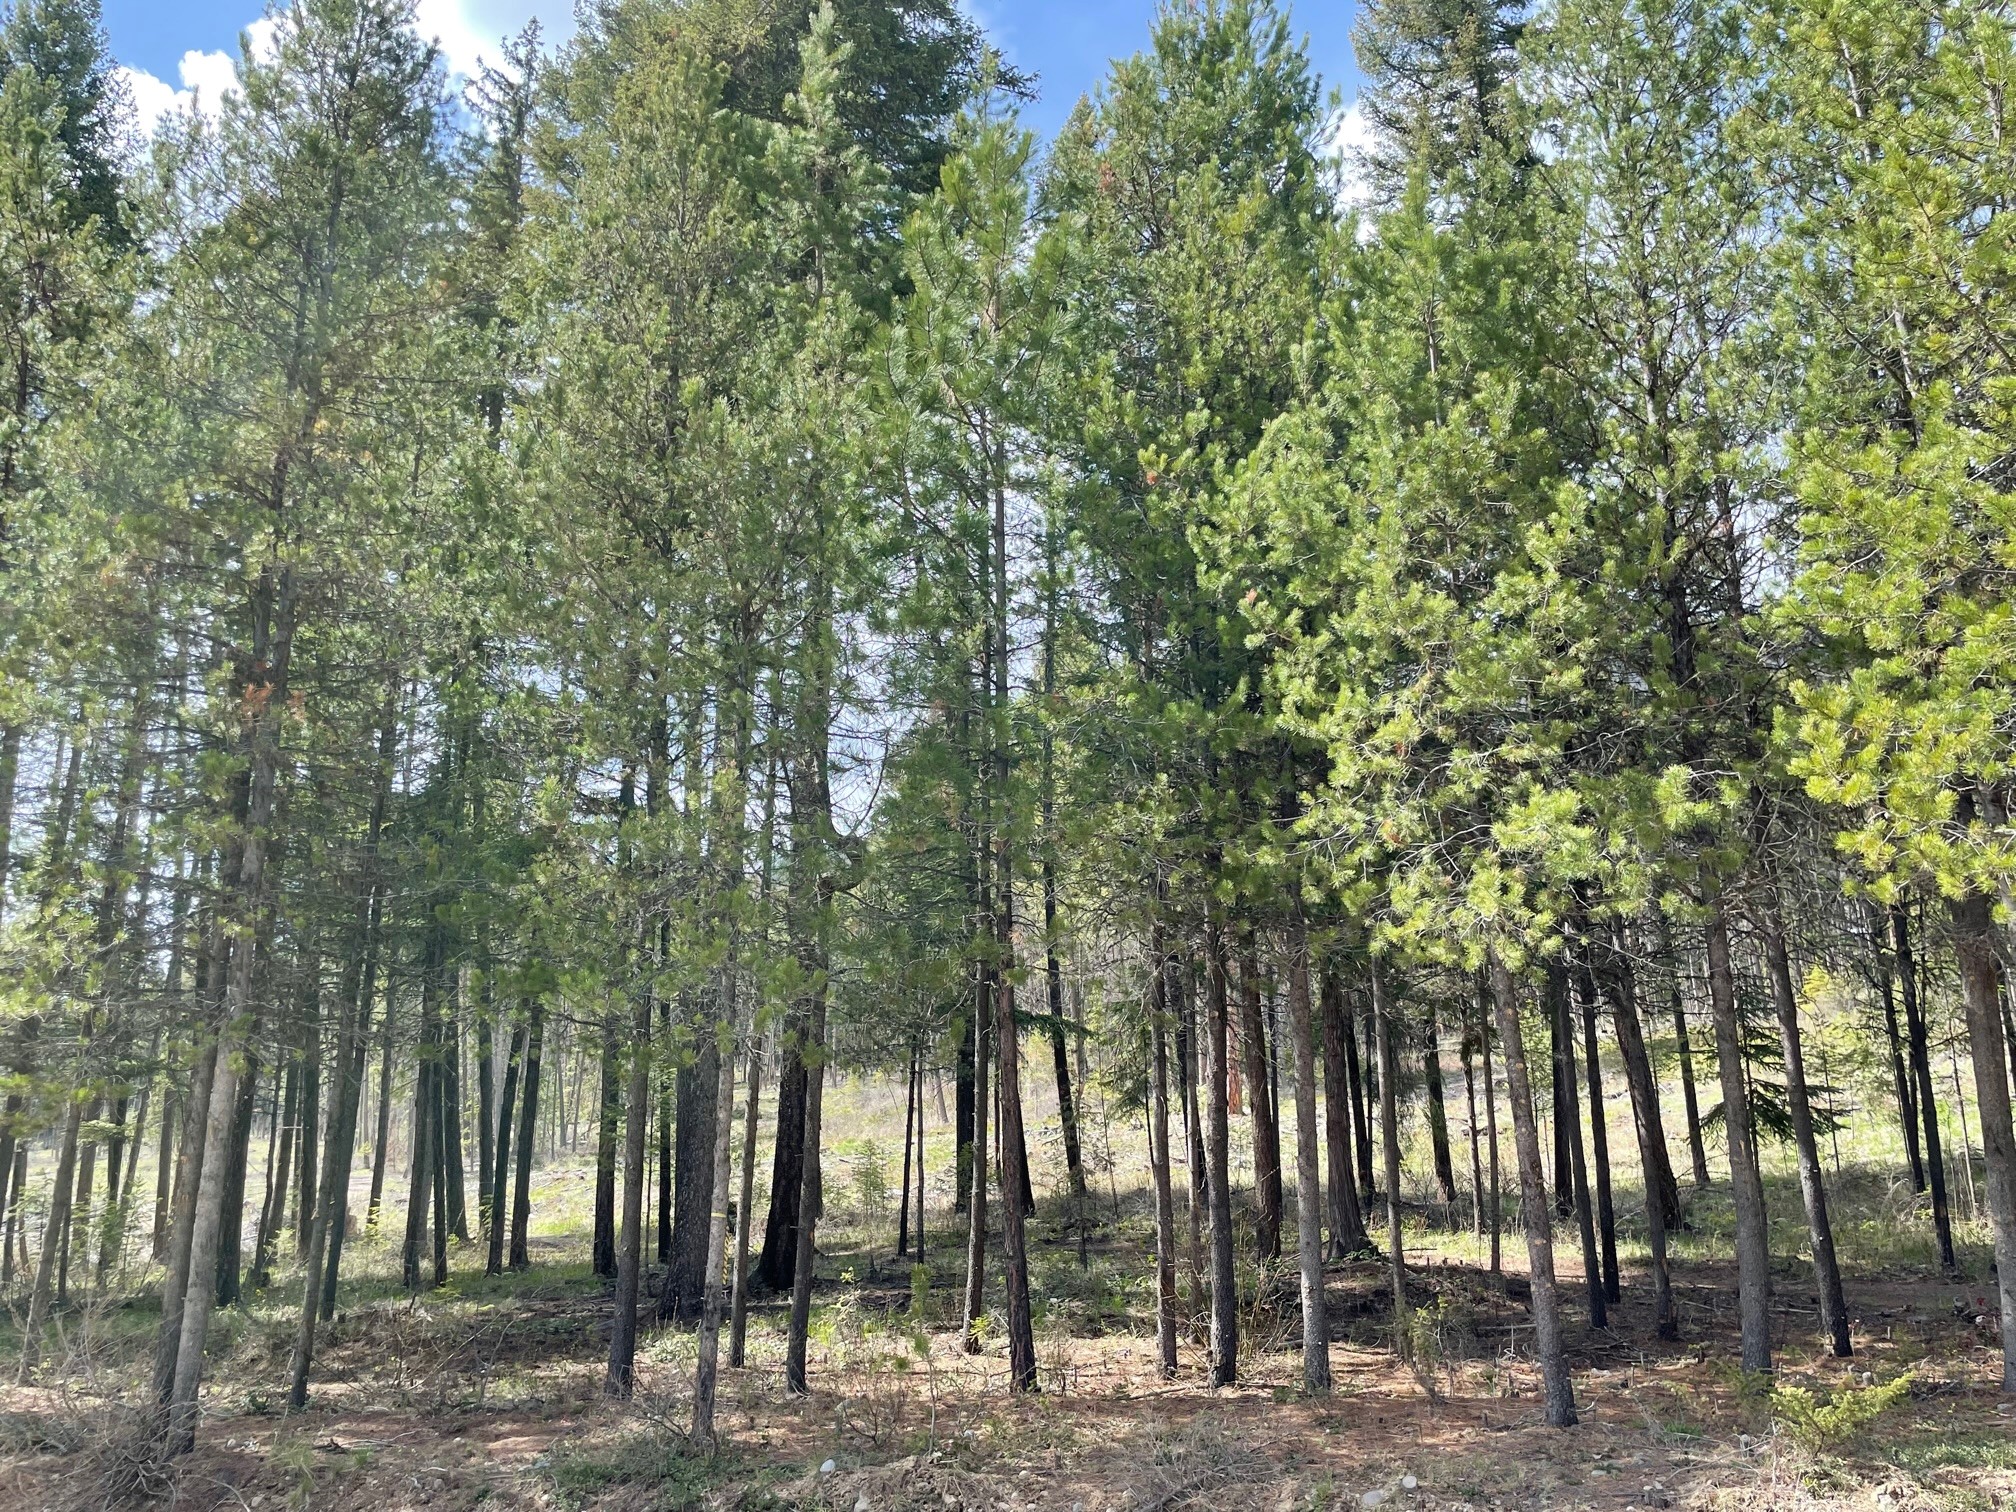
By removing dead trees, diseased trees, and even some healthy trees, forest managers can reduce the amount of potential fuel in the forest, making devastating wildfires less likely. There are also commercial advantages to this strategy. Most of the trees removed are low quality and not suitable for processing into lumber. These trees can, however, still be used commercially to produce biomass wood pellets that offer a renewable alternative to fossil fuels. This means local communities don’t just get safer forests, they get safer forests that support the local economy.

The United States: Thinning for healthier forests

The U.S. South’s forests have expanded rapidly in recent decades, largely due to growth in working forests on private land. Annual forest growth in the region more than doubled from 193 million cubic metres of wood in 1953 to 408 million cubic meters by 2015.

This expansion has occurred thanks to active forest product markets which incentivise forest management investment. In the southern U.S. thinning is critical to managing healthy and productive pine forests.

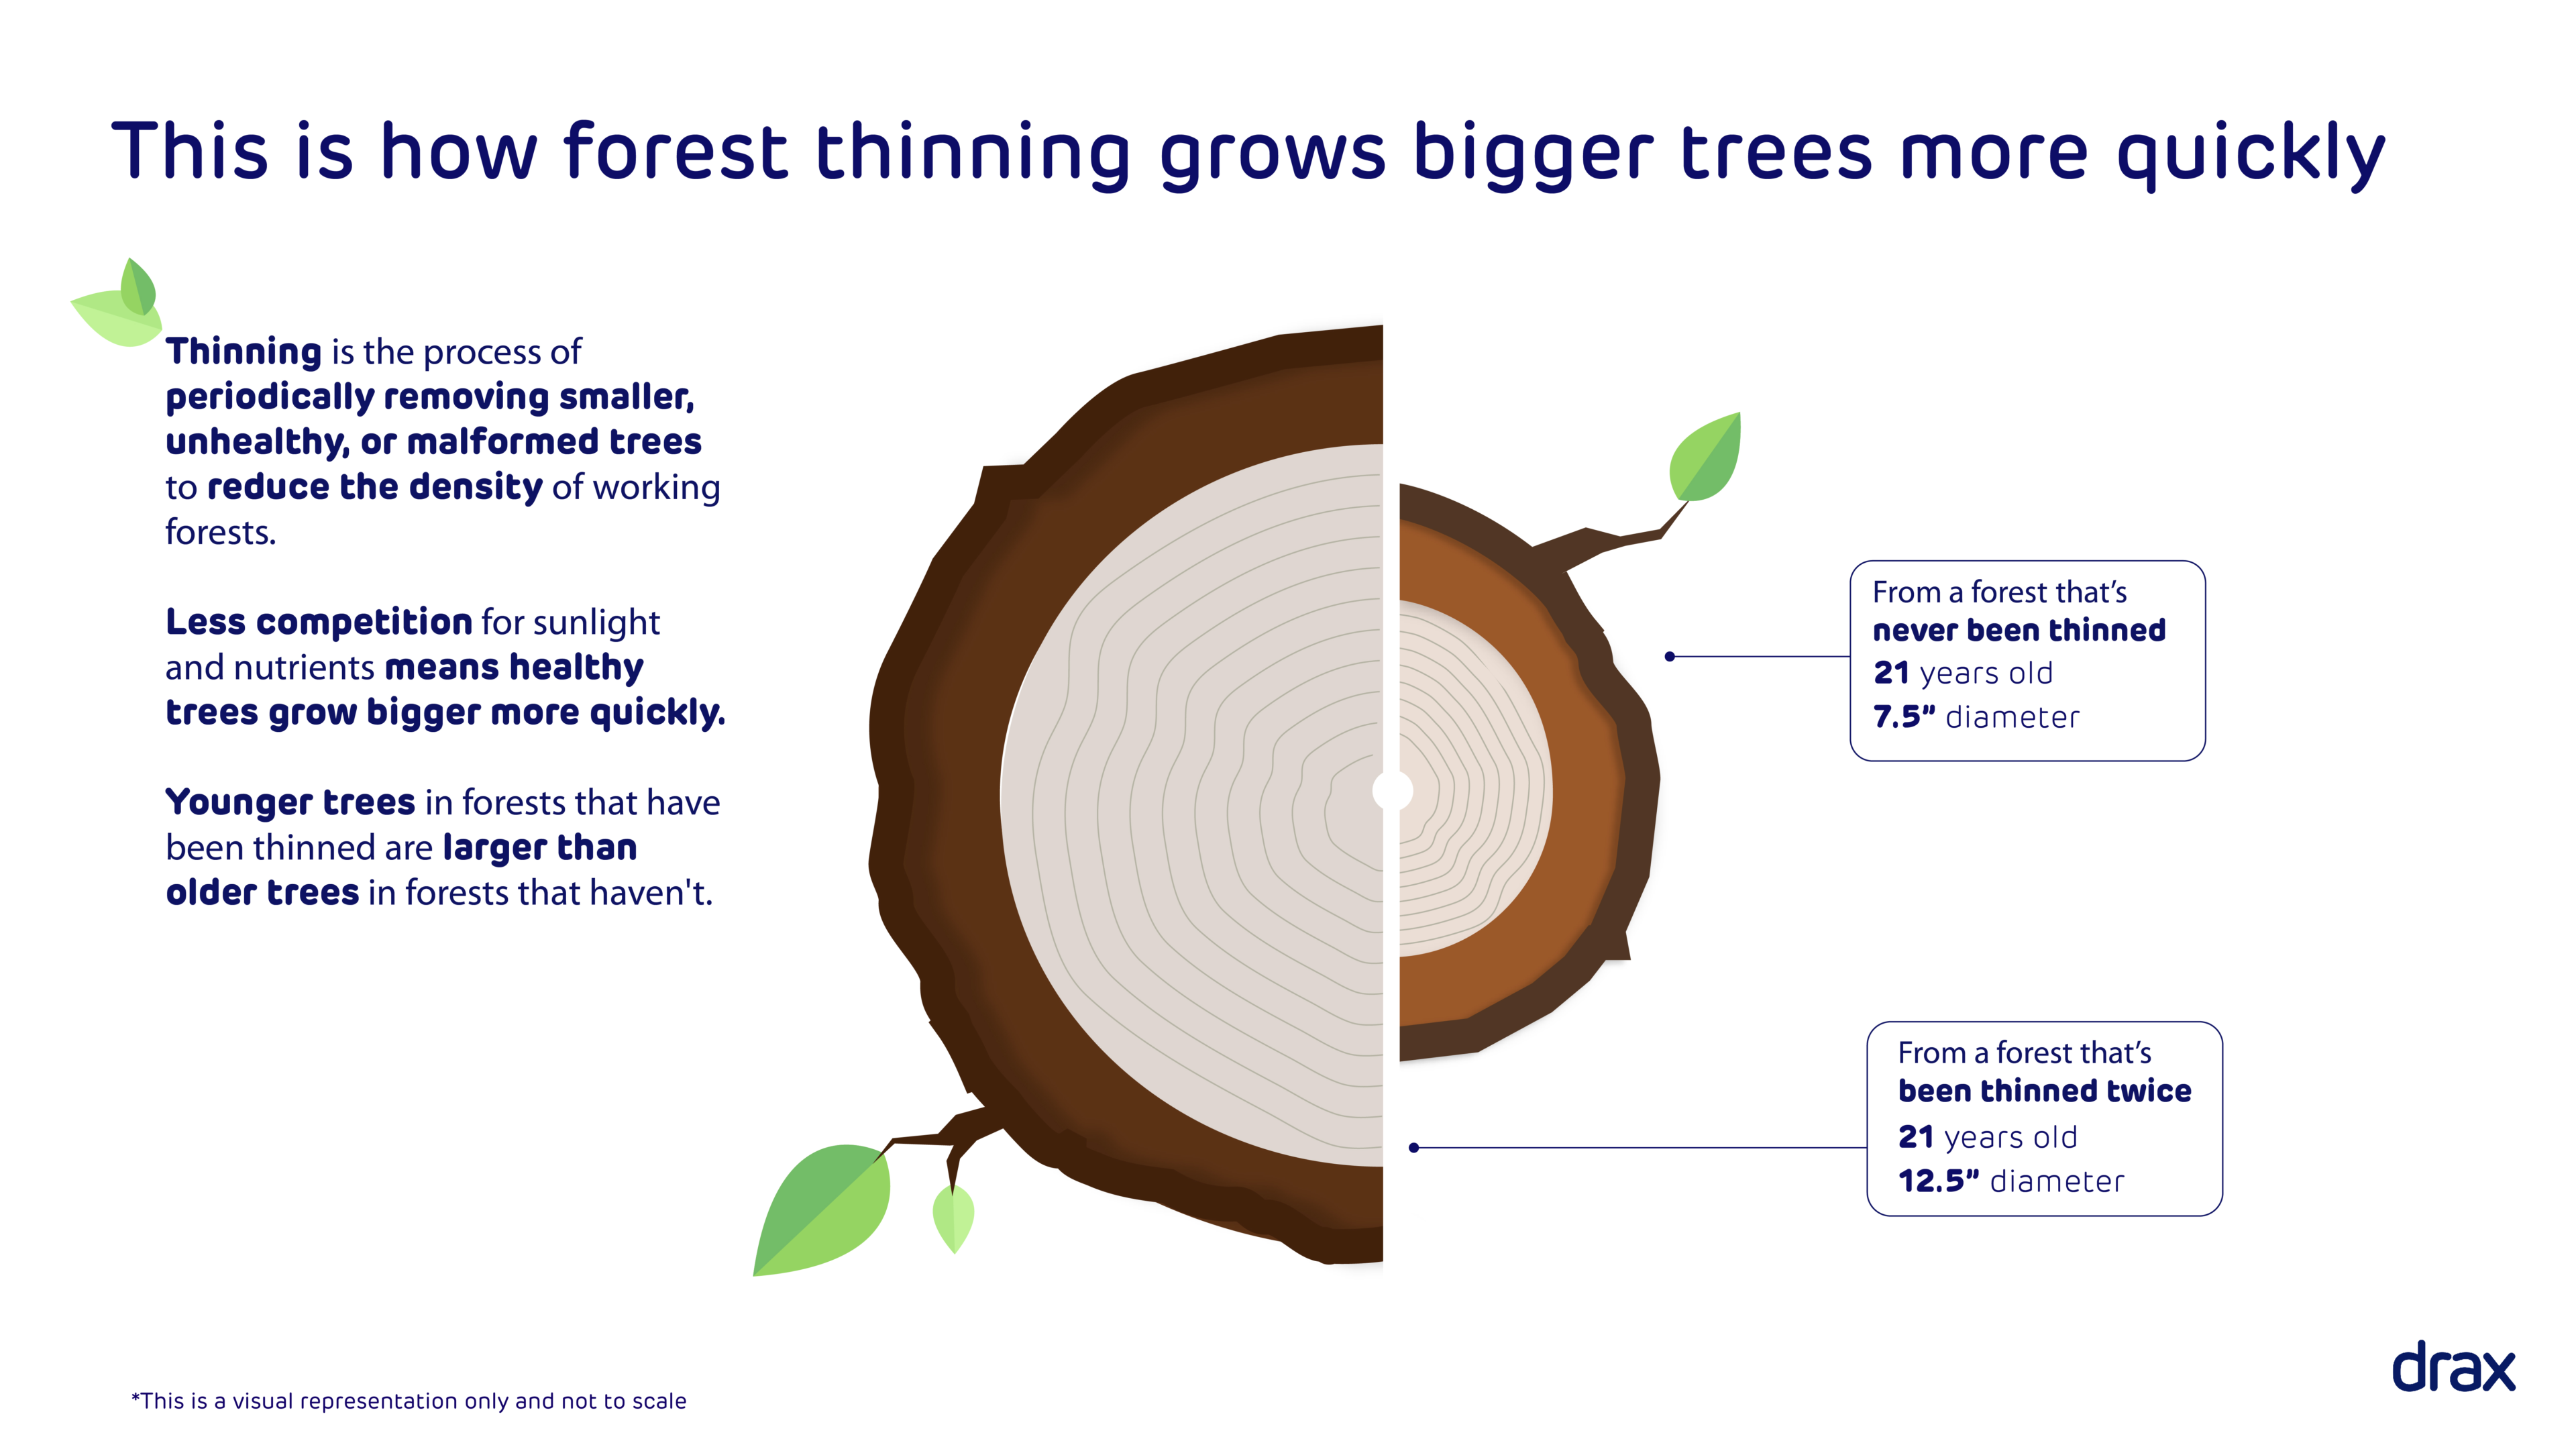
Thinning is an intermediate harvest aimed at reducing tree density to allocate more resources, like nutrients, sunlight, and water, to trees which will eventually become valuable sawtimber. Thinning not only increases future sawtimber yields, but also improves the forest’s resilience to pest, disease, and wildfire, as well as enhancing understory diversity and wildlife habitat.

Click to view/download

While trees removed during thinning are generally undersized or unsuitable for lumber, they’re ideal for producing biomass wood pellets. In this way, the biomass market creates an incentive for managers to engage in practices that increase the health and vigour of forests on their land.

The results speak for themselves: across U.S. forestland the volume of annual net timber growth 36% higher than the volume of annual timber removals.

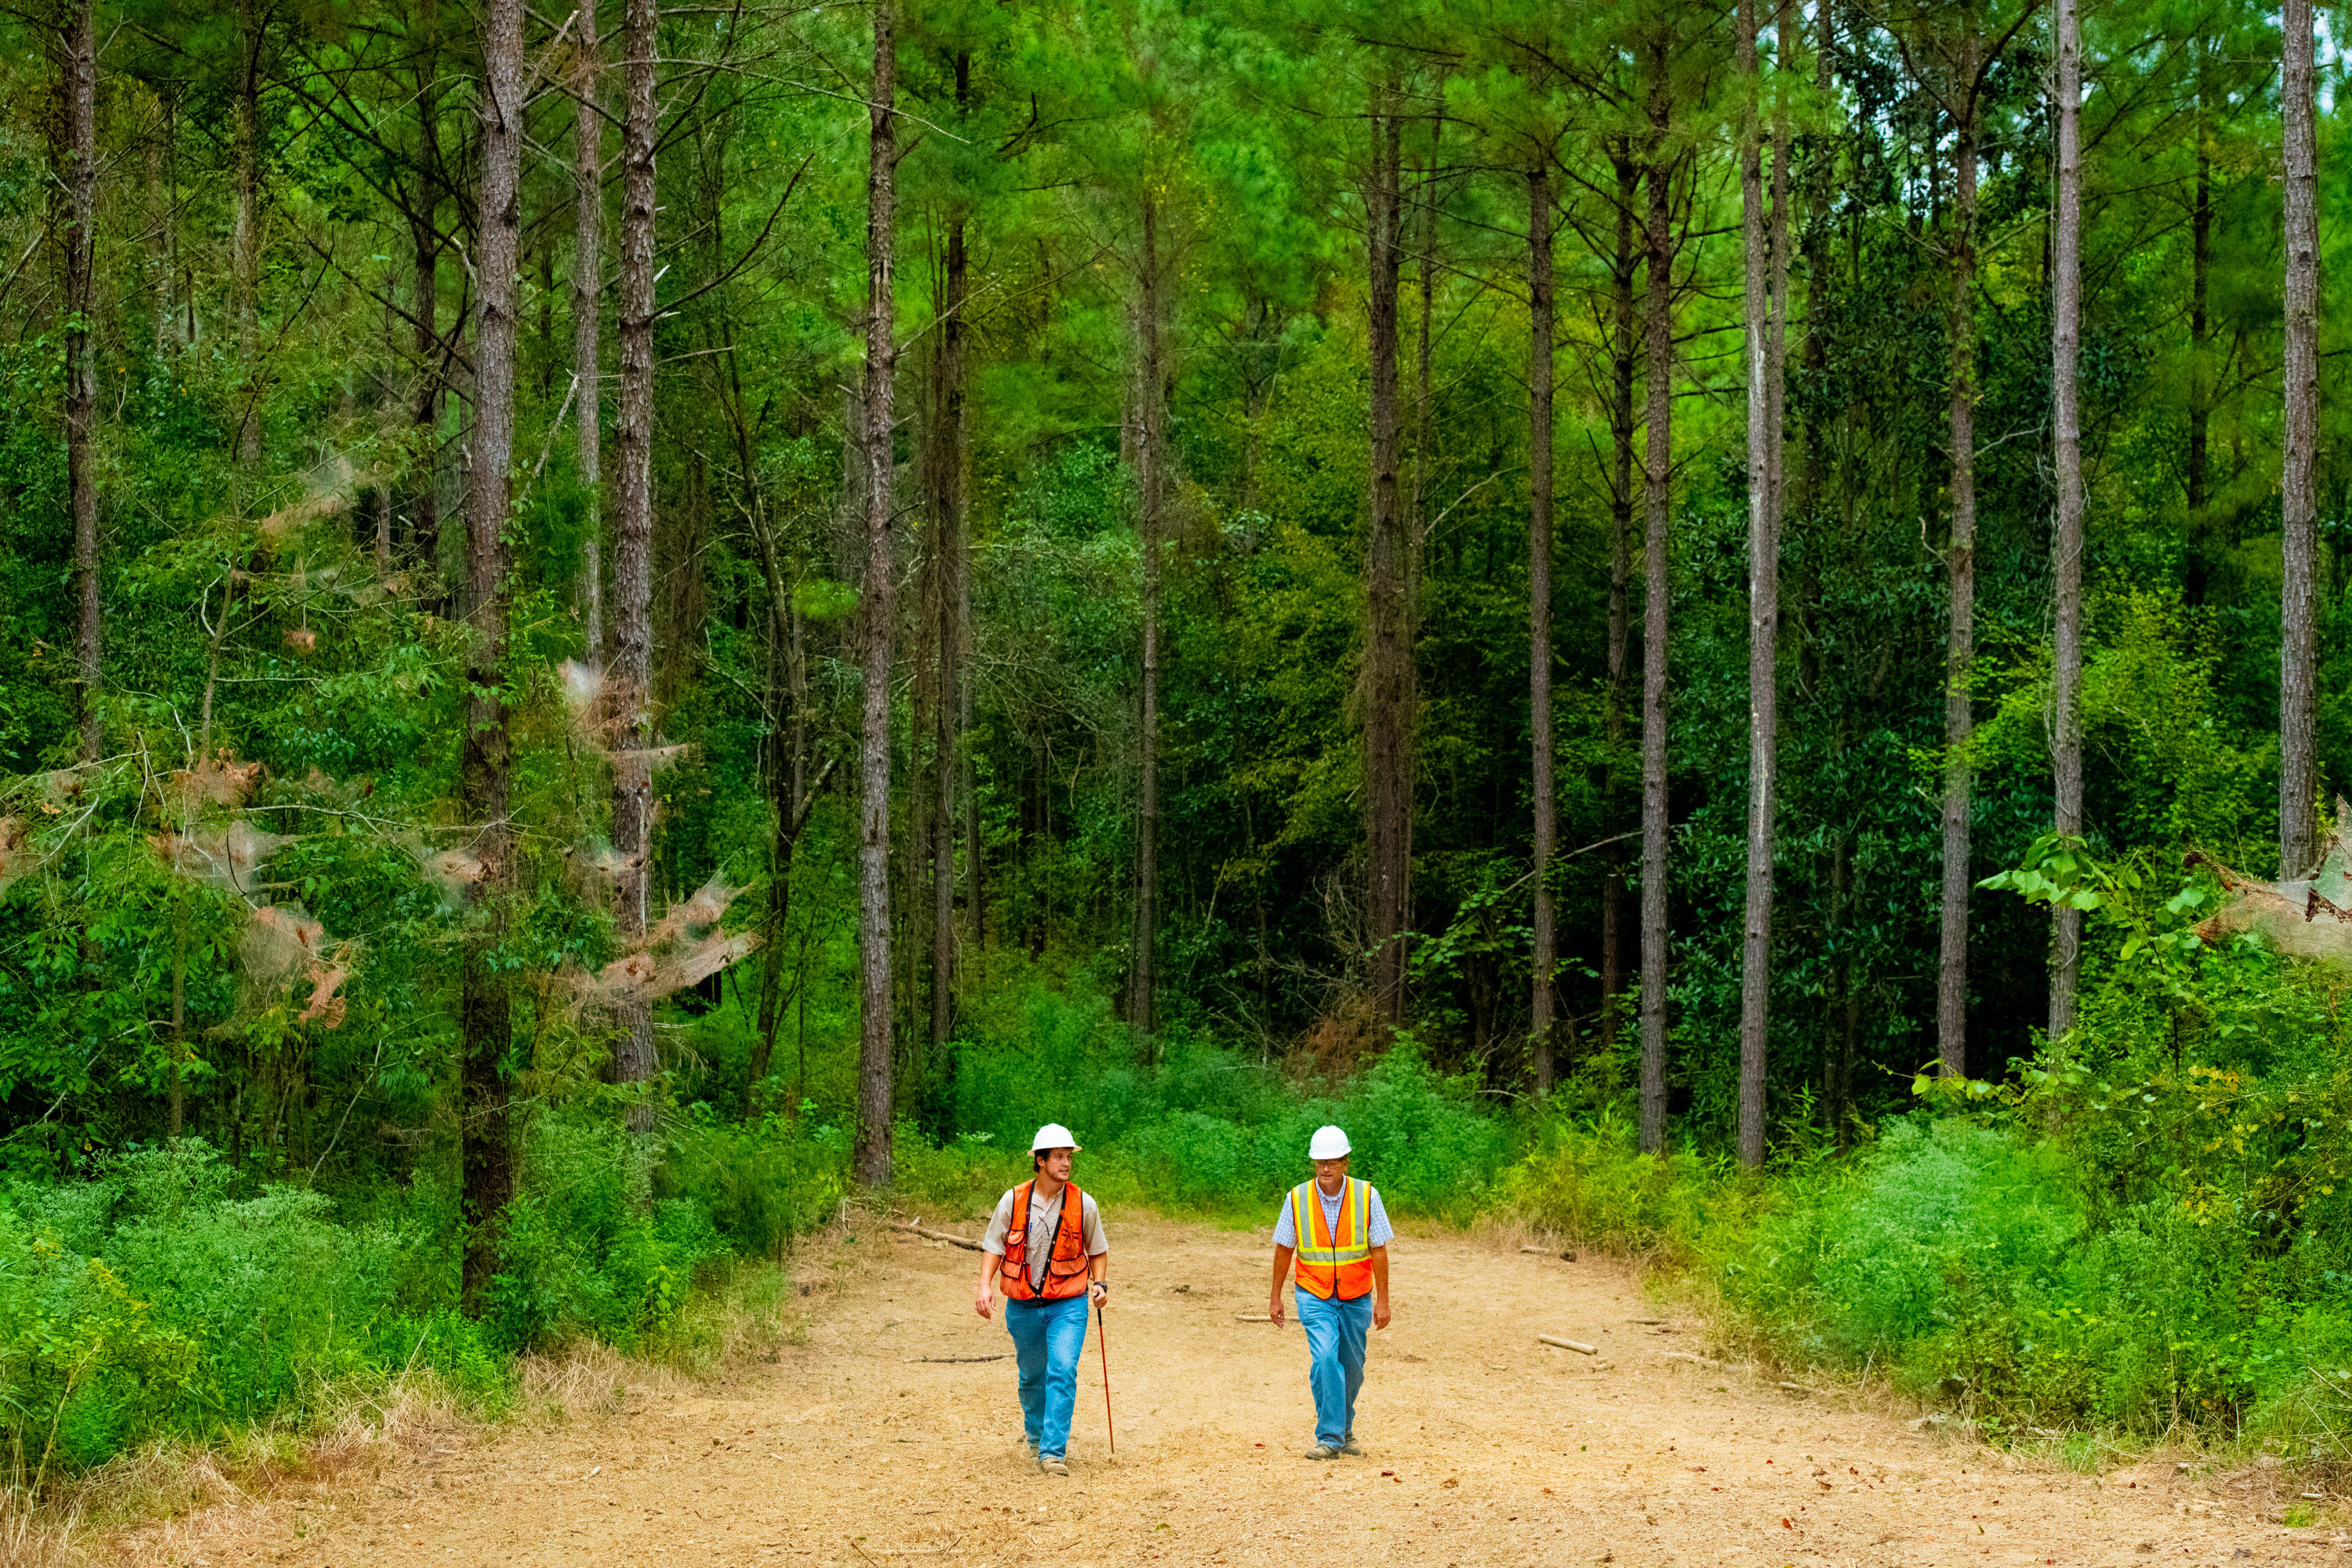
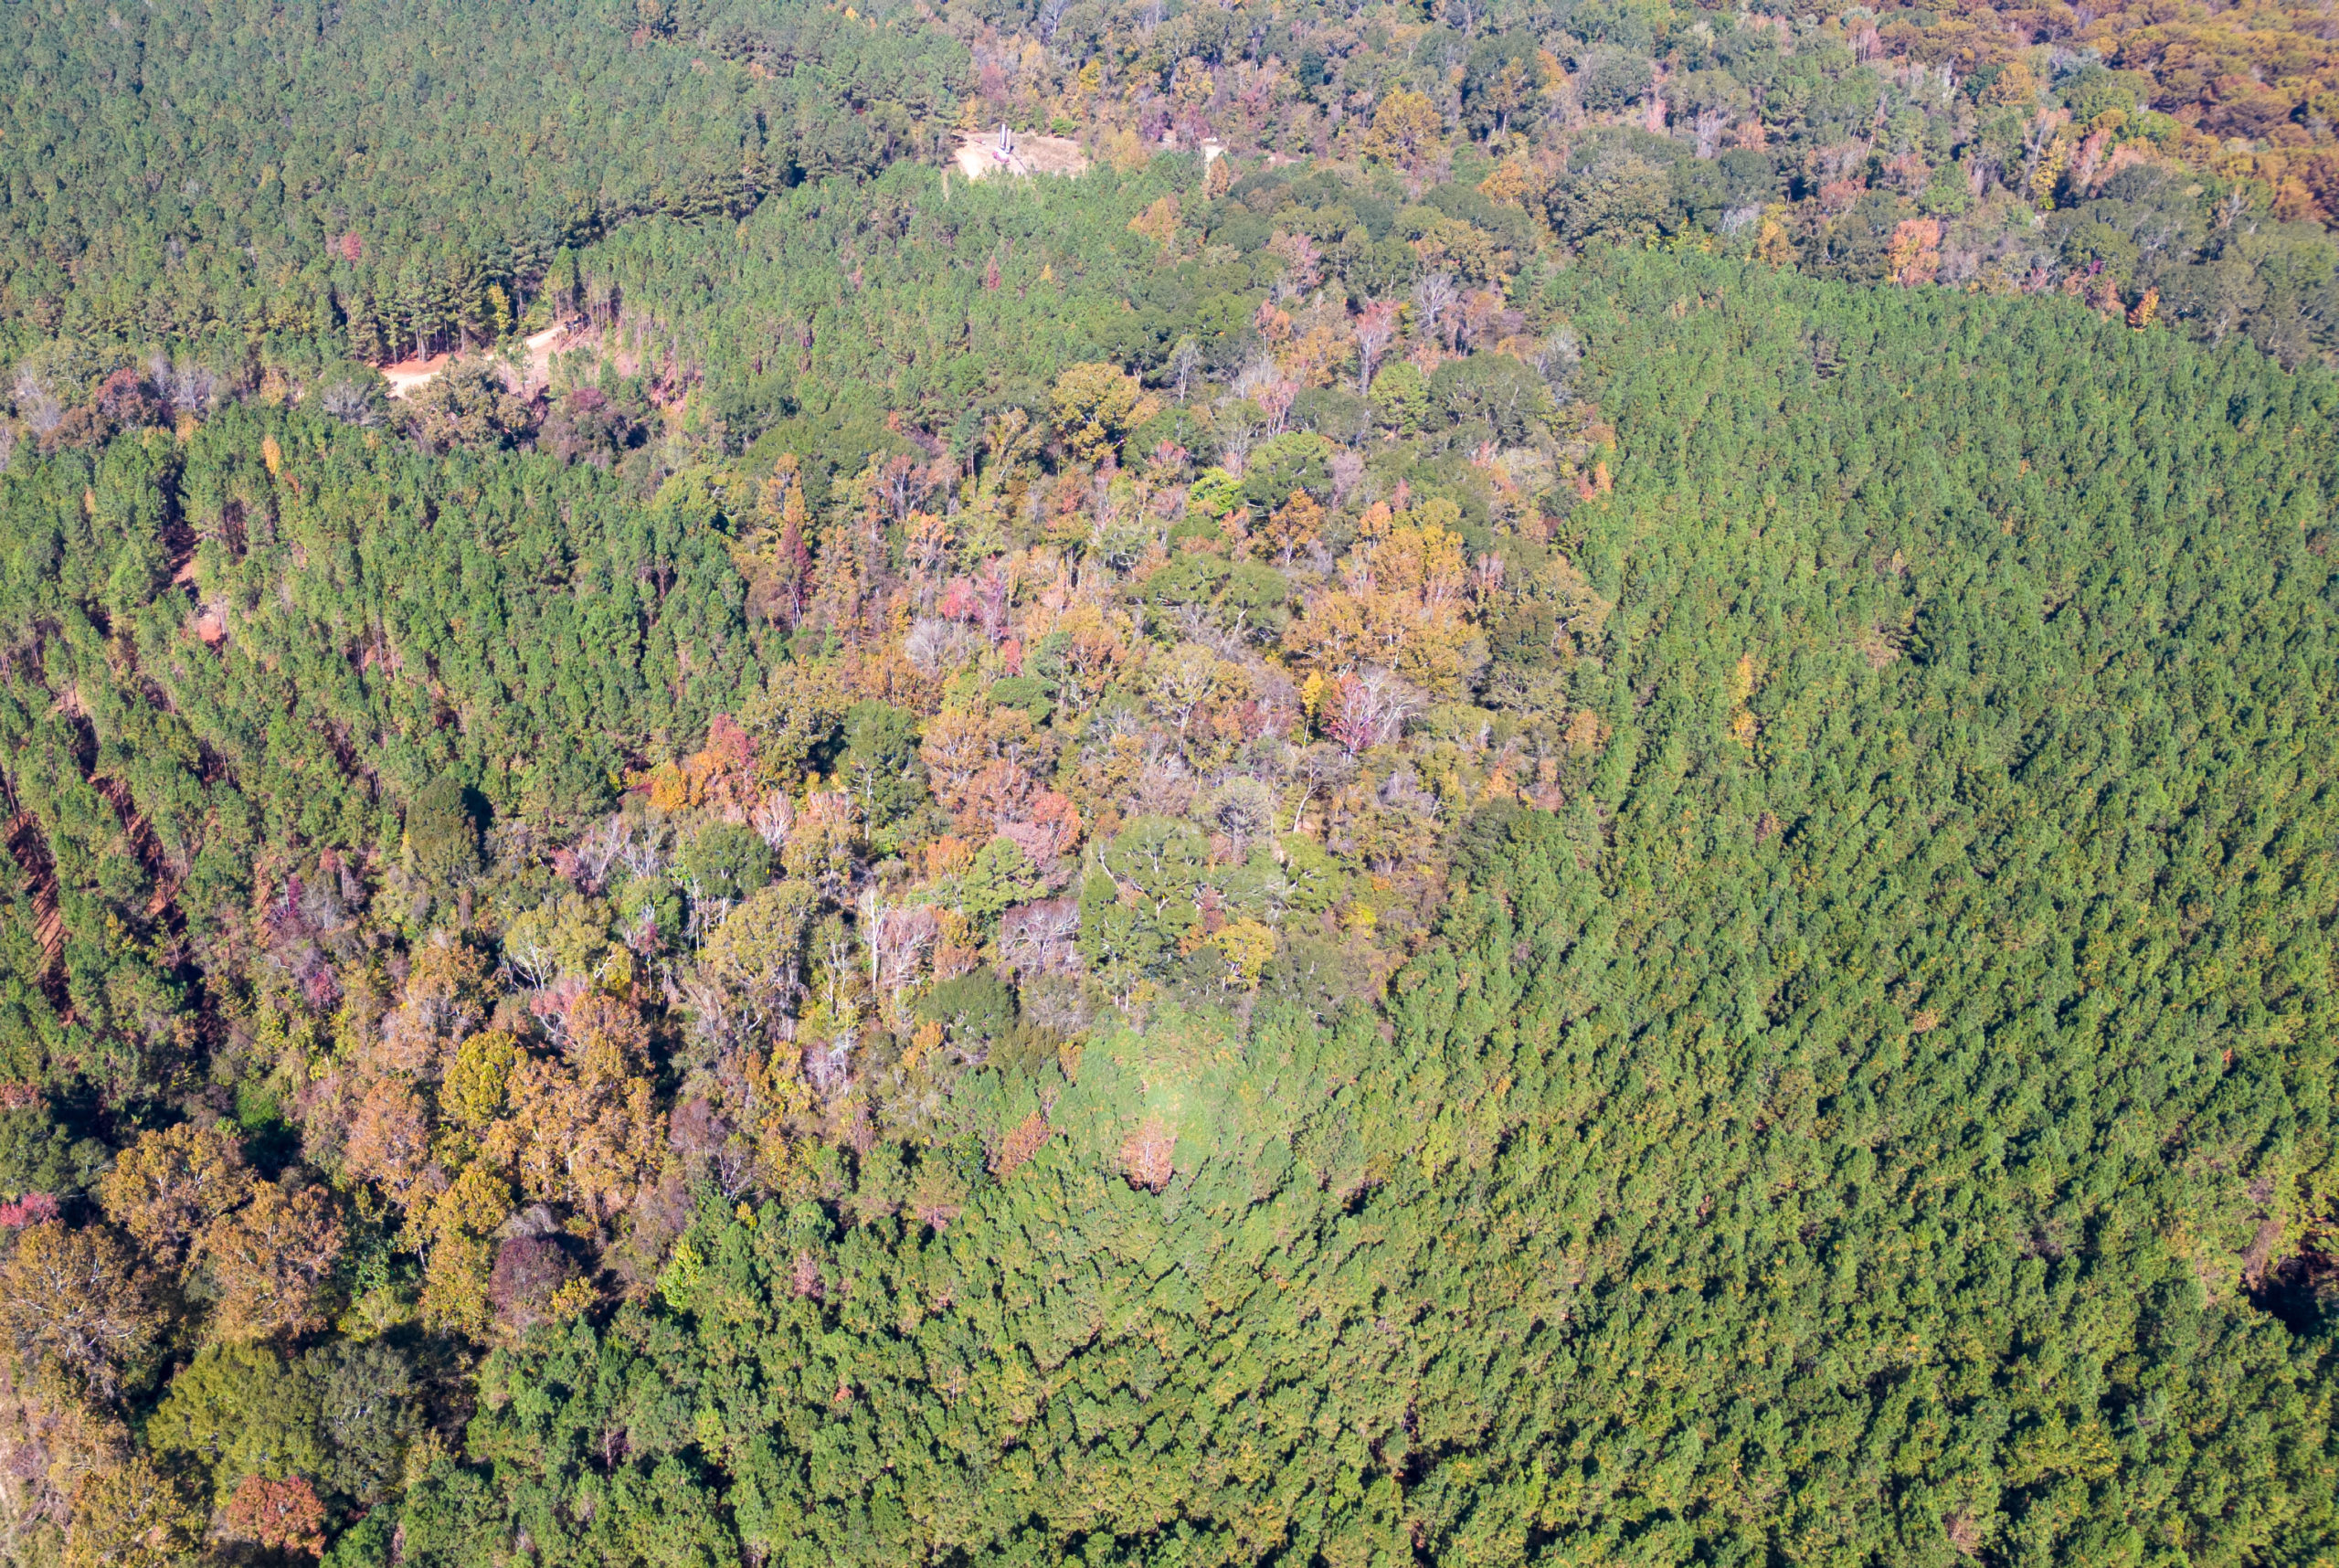
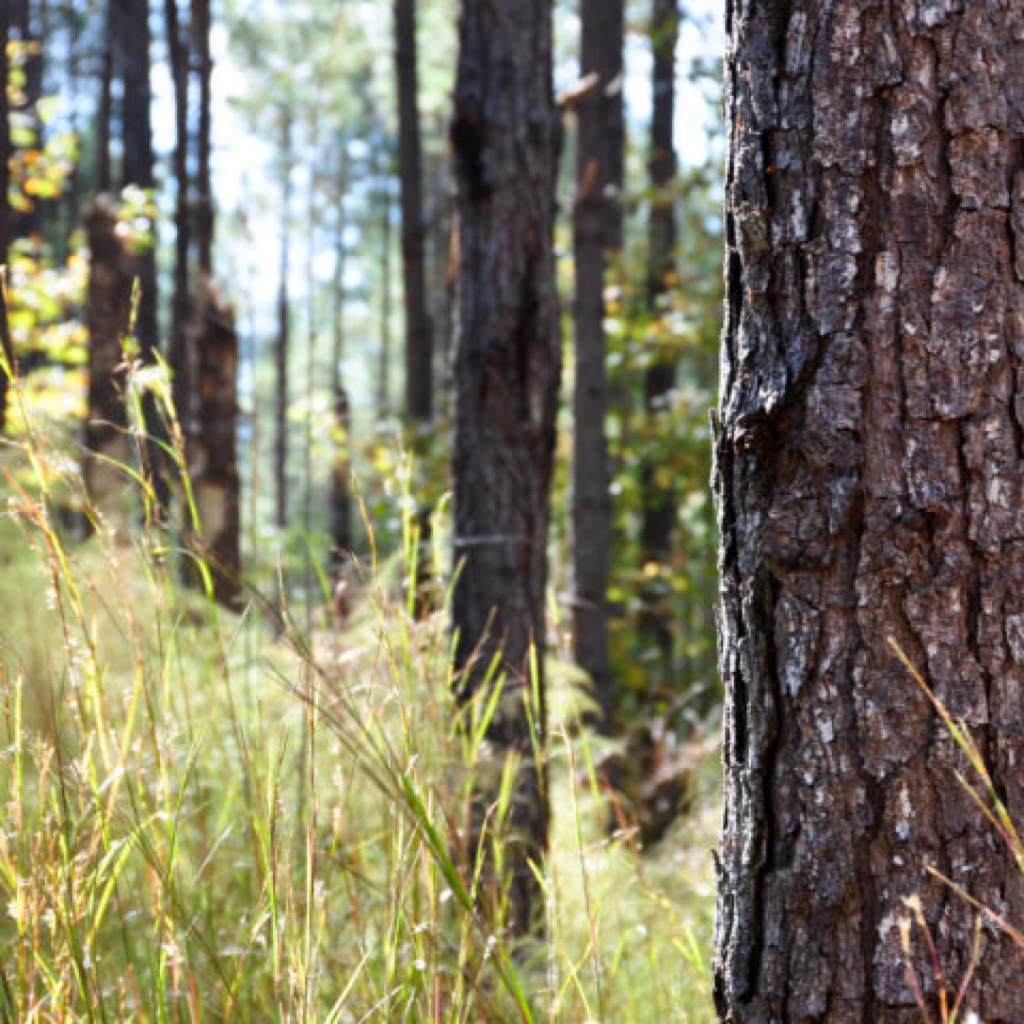
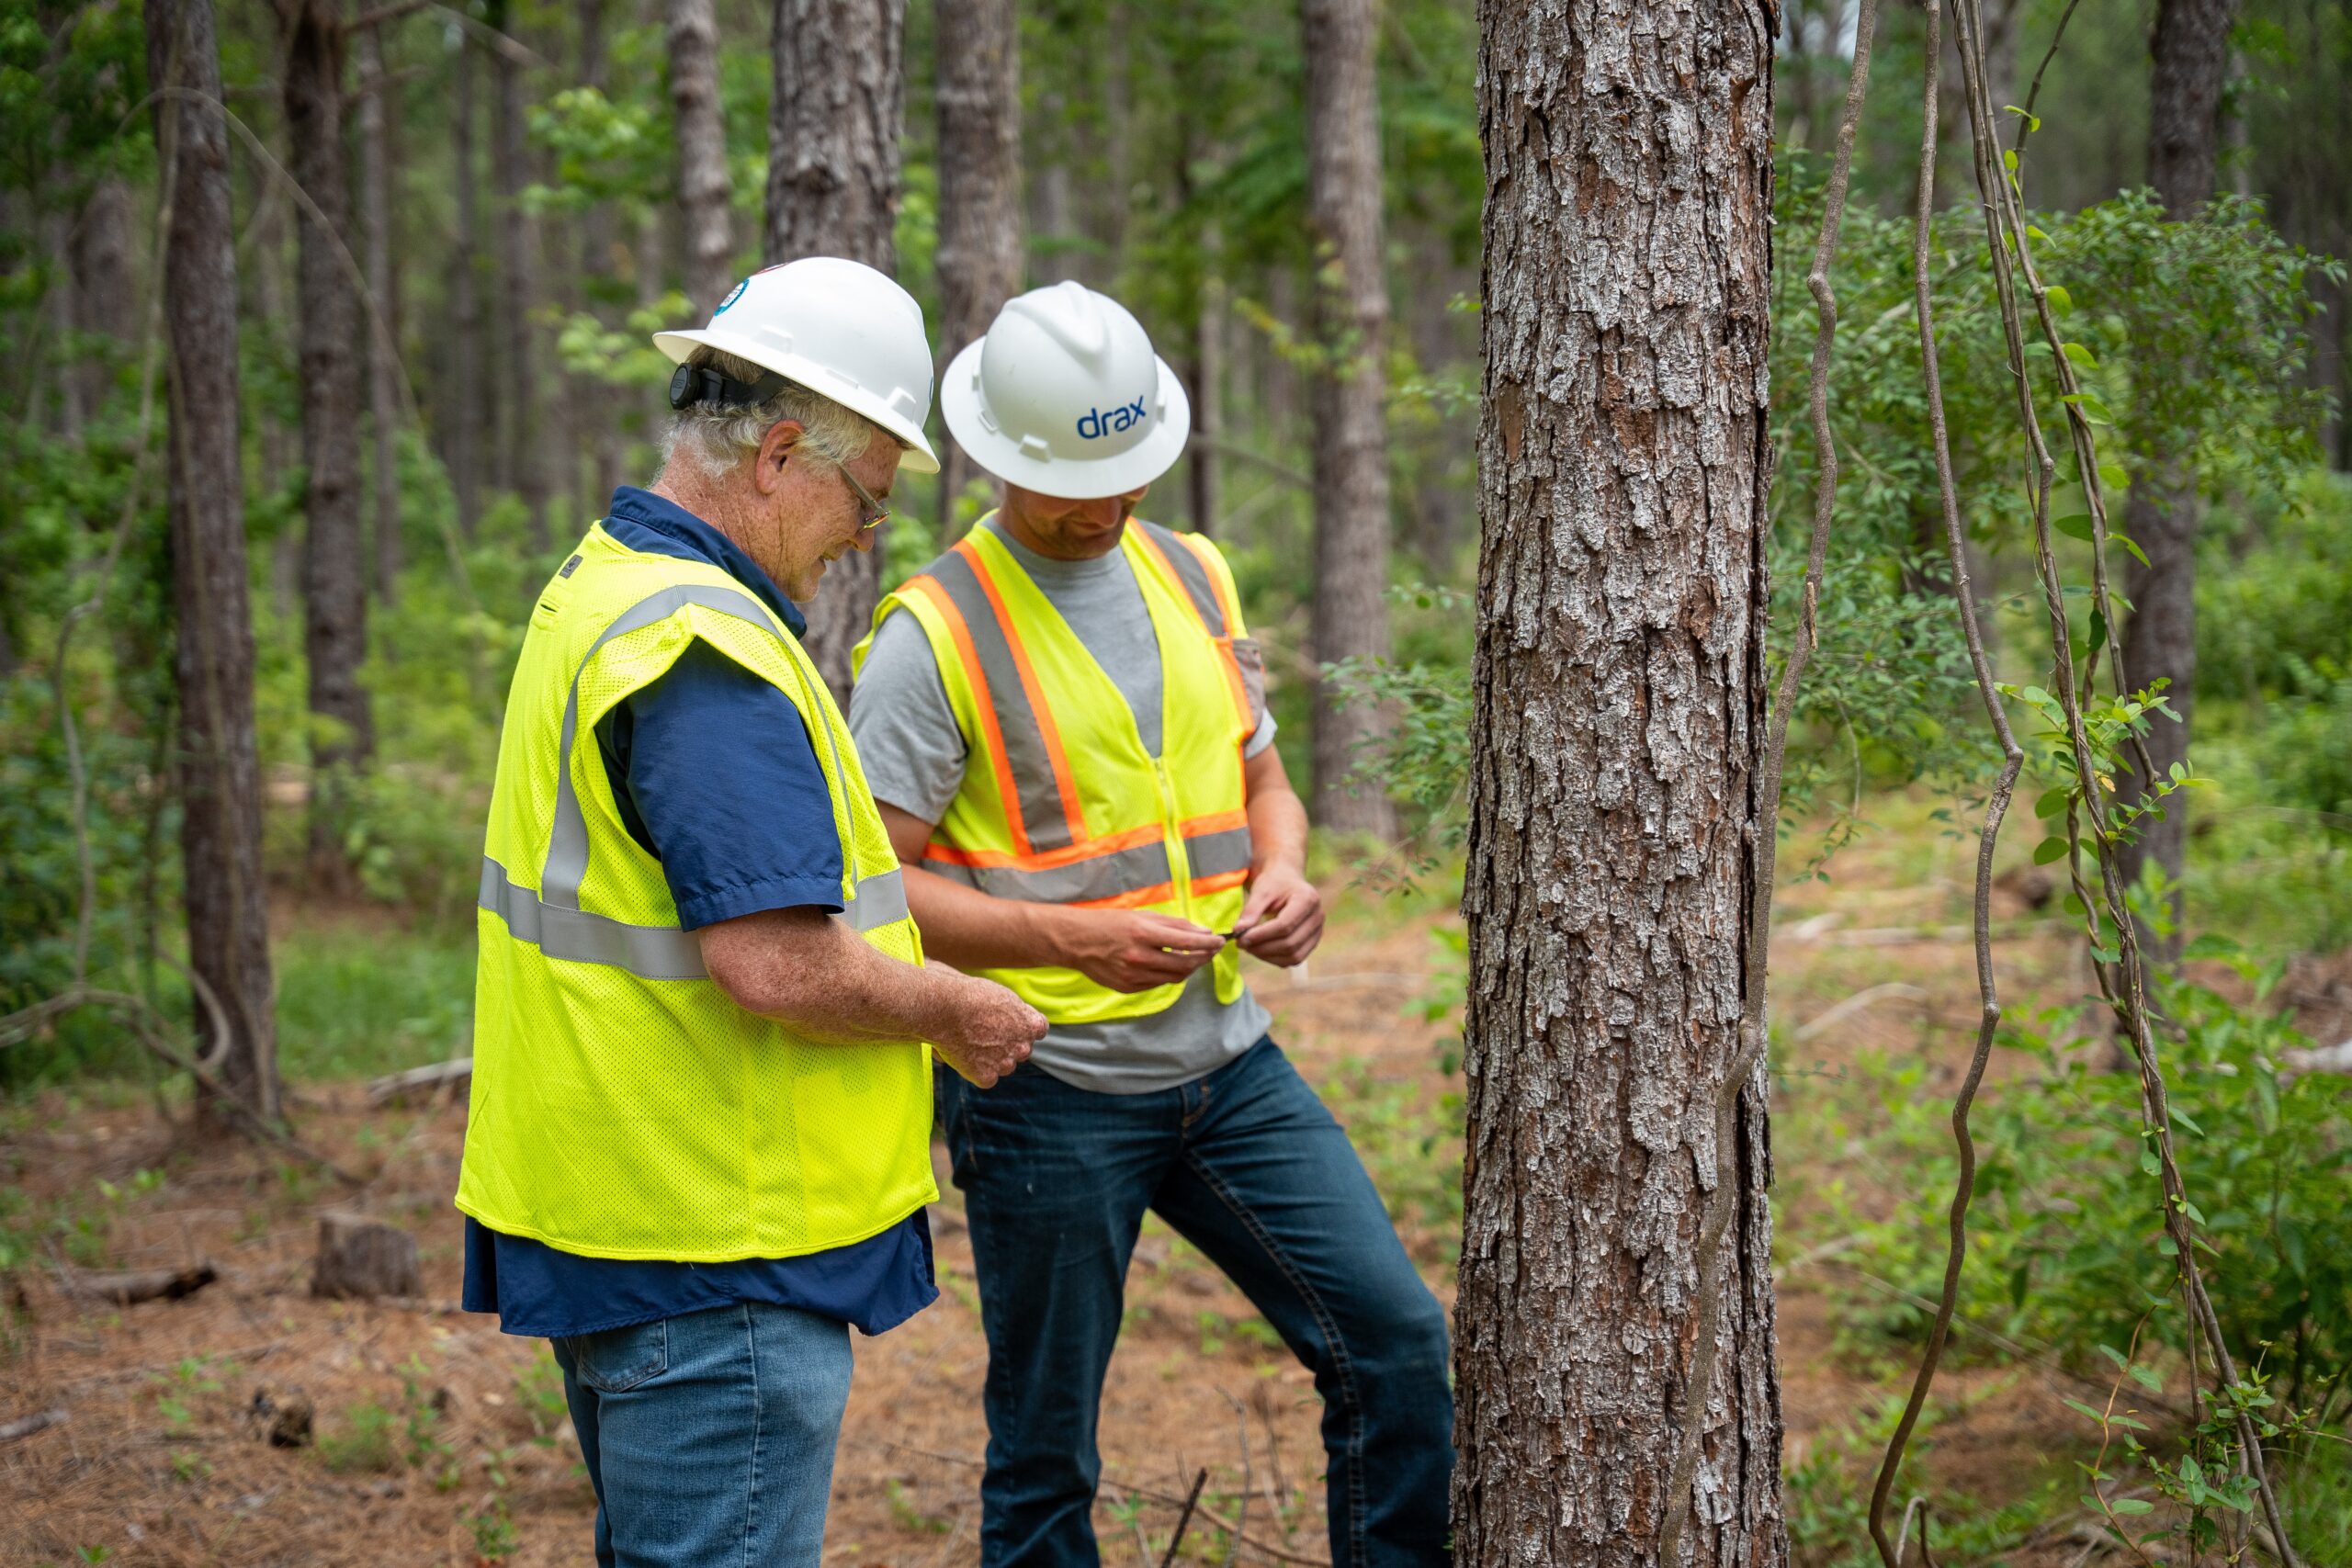
A managed working forest in the US South

Estonia: Seeding the future

Though Estonia is not a large country, approximately half of it is covered in trees, meaning forestry is integral to the country’s way of life. Historically, harvesting trees has been an important part of the national economy, and the government has established strict laws to ensure sustainable management practices.

These regulations have helped Estonia increase its overall forest cover from about 34% 80 years ago to over 50% today. And, as in the U.S. South, the volume of wood harvested from Estonia’s forests each year is less than the volume added by tree growth.

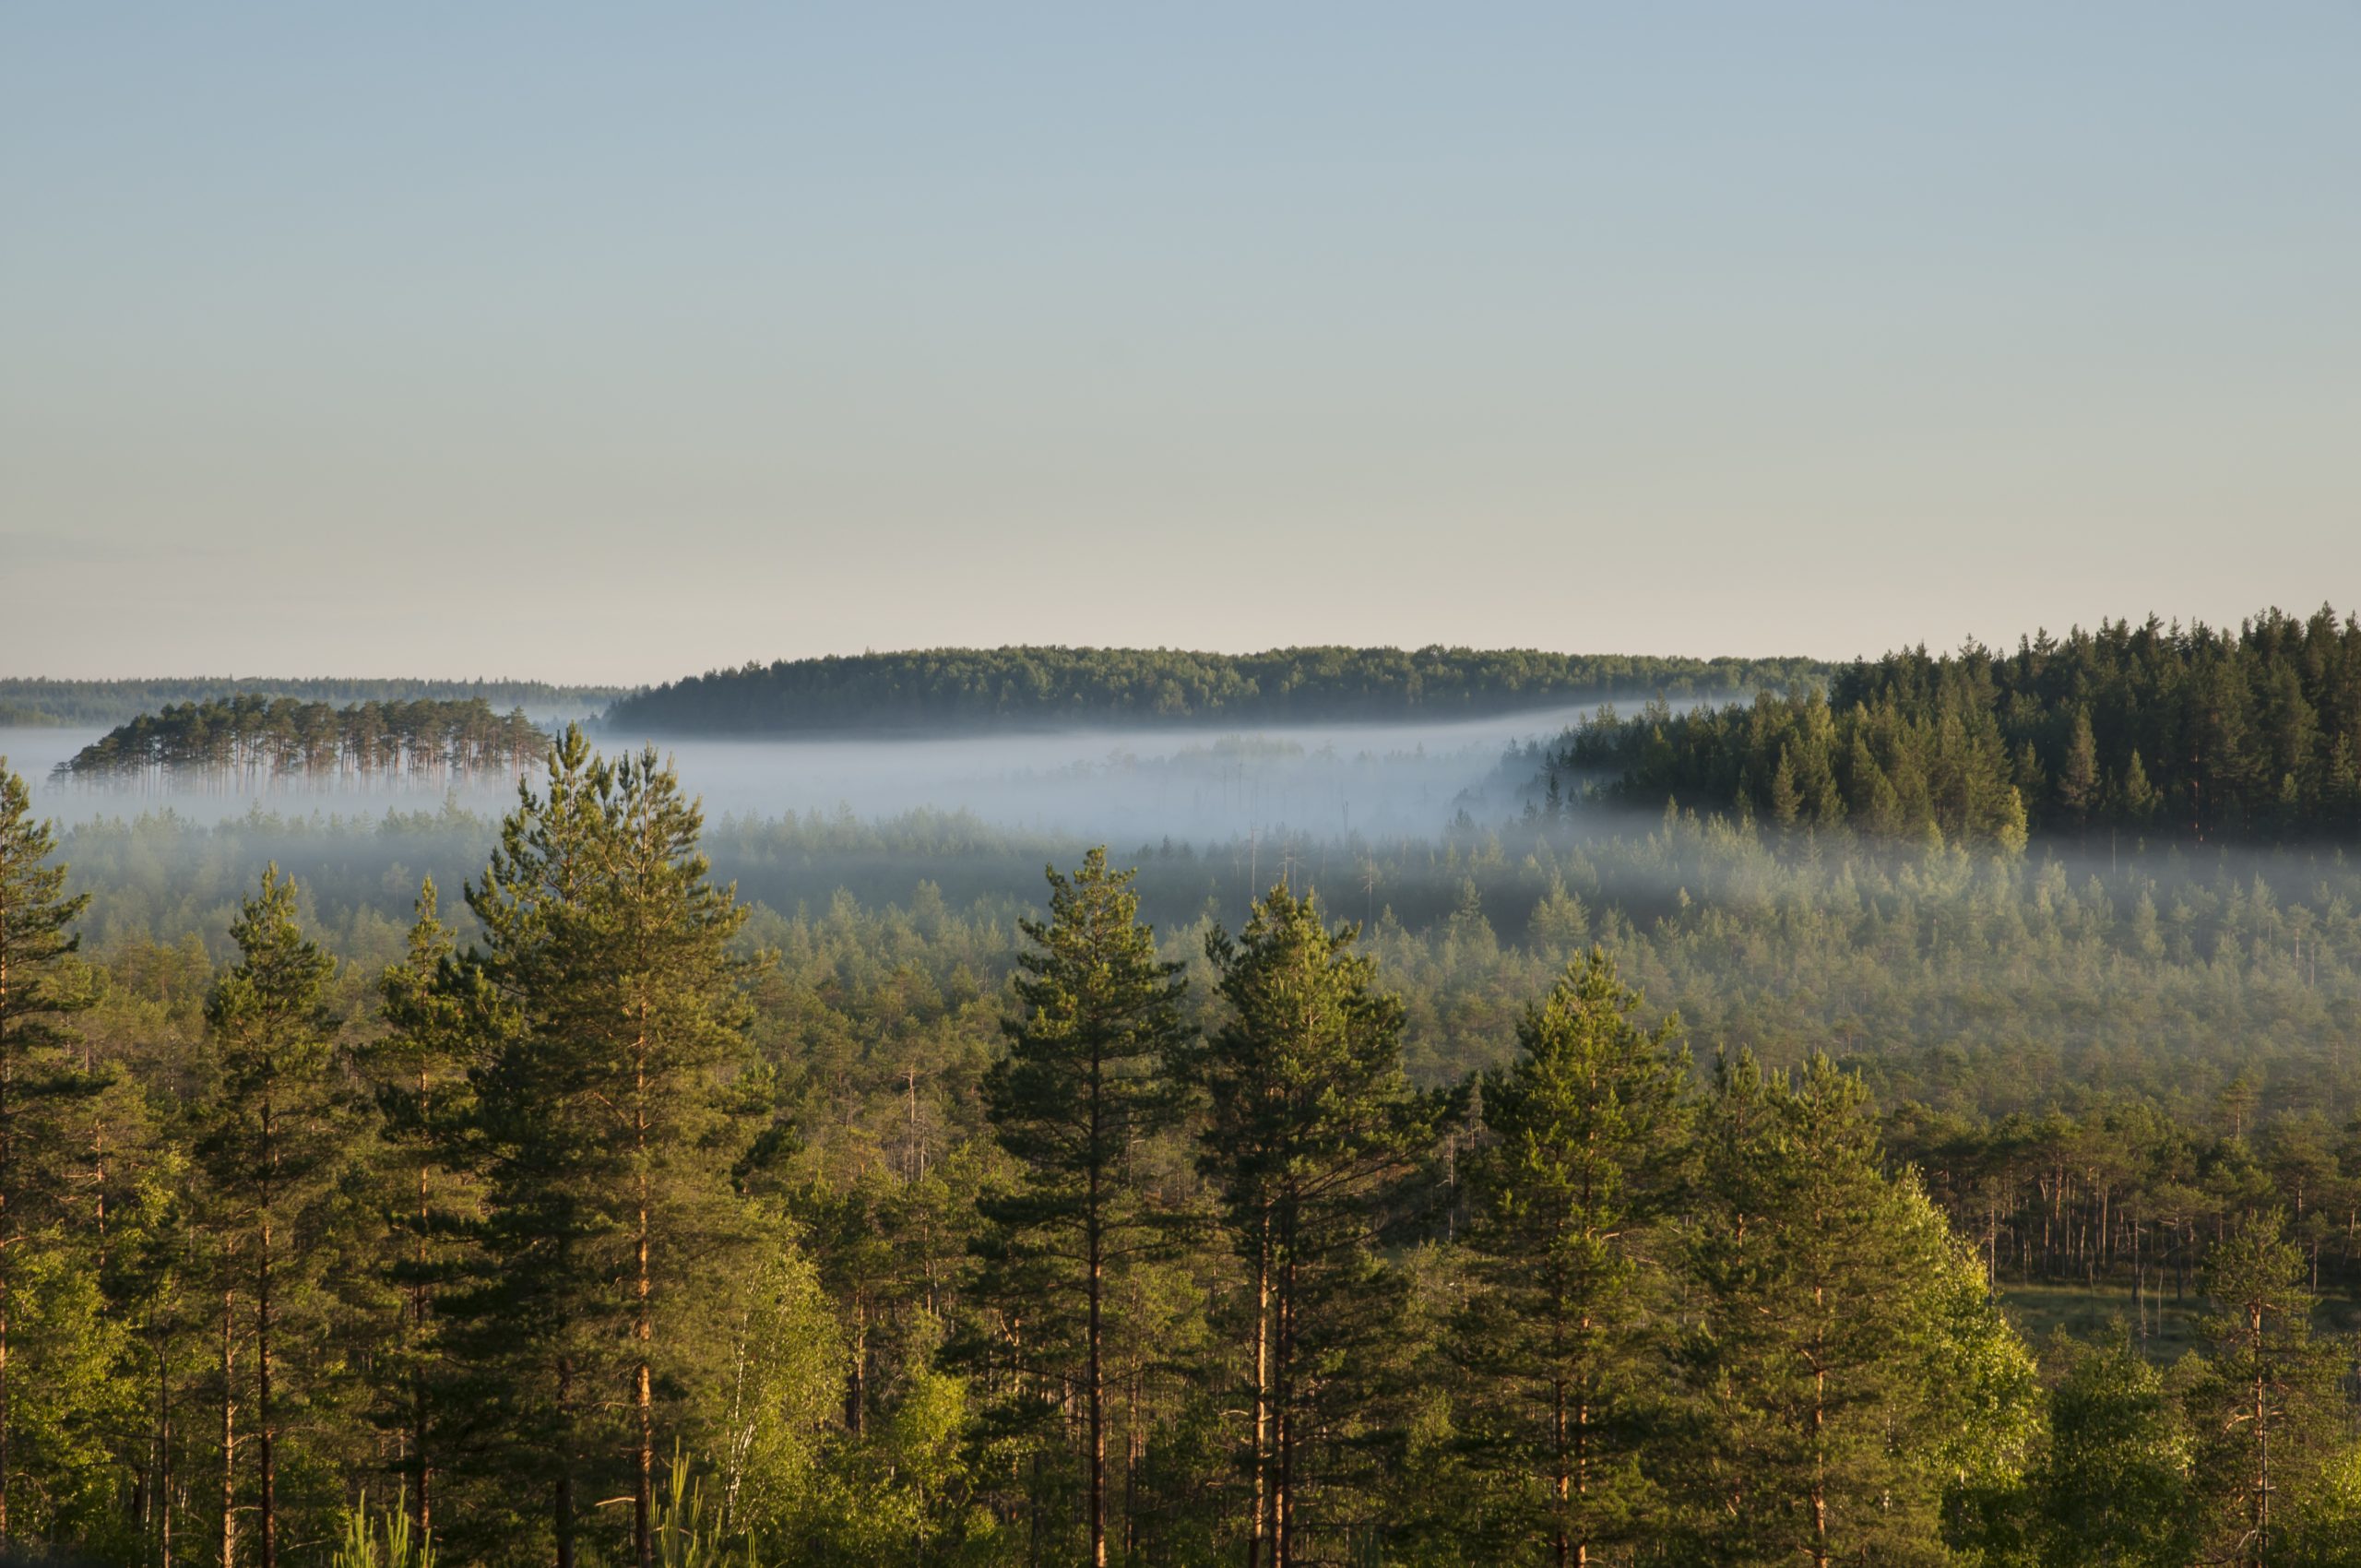
Sunrise and fog over forest landscape in Estonia

Sunrise and fog over forest landscape in Estonia

Estonia has managed to increase its growing forest stock by letting the average age of its forests increase. This is partially due to Estonia having young, fast-growing forests in areas where tree growth is relatively new. But it is also due to regulations that require harvesters to leave seed trees.

Seed trees are healthy, mature trees, the seeds from which become the forest’s next generation. By enforcing laws that ensure seed trees are not harvested, Estonia is encouraging natural regeneration of forests. As in the U.S. South protecting these seed trees from competition for water and nutrients means removing smaller trees in the area. While these smaller trees may not all be suitable for lumber, they are a suitable feedstock for biomass. It means managing for natural regeneration can still have economic, as well as environmental, advantages.

Different methods, similar results

Laws, landownership, and forestry practices differ greatly between the U.S. South, British Columbia, and Estonia, but all three are excellent examples of how local forest management contributes to healthy rural economies and sustained forest coverage.

While there are many different strategies for creating a balance between economic and environmental interests, all successful strategies have something in common: They encourage healthy, growing forests.

Supporting a circular economy in the forests

Every year in British Columbia, millions of tonnes of waste wood – known in the industry as slash – is burned by the side of the road.

Land managers are required by law to dispose of this waste wood – that includes leftover tree limbs and tops, and wood that is rotten, diseased and already fire damaged – to reduce the risks of wildfires and the spread of disease and pests.

The smoke from these fires is choking surrounding communities – sometimes “smoking out entire valleys,” air quality meteorologist from BC’s Environment Ministry Trina Orchard recently told iNFOnews.ca.

It also impacts the broader environment, releasing some 3 million tonnes of CO2 a year into the atmosphere, according to some early estimates.

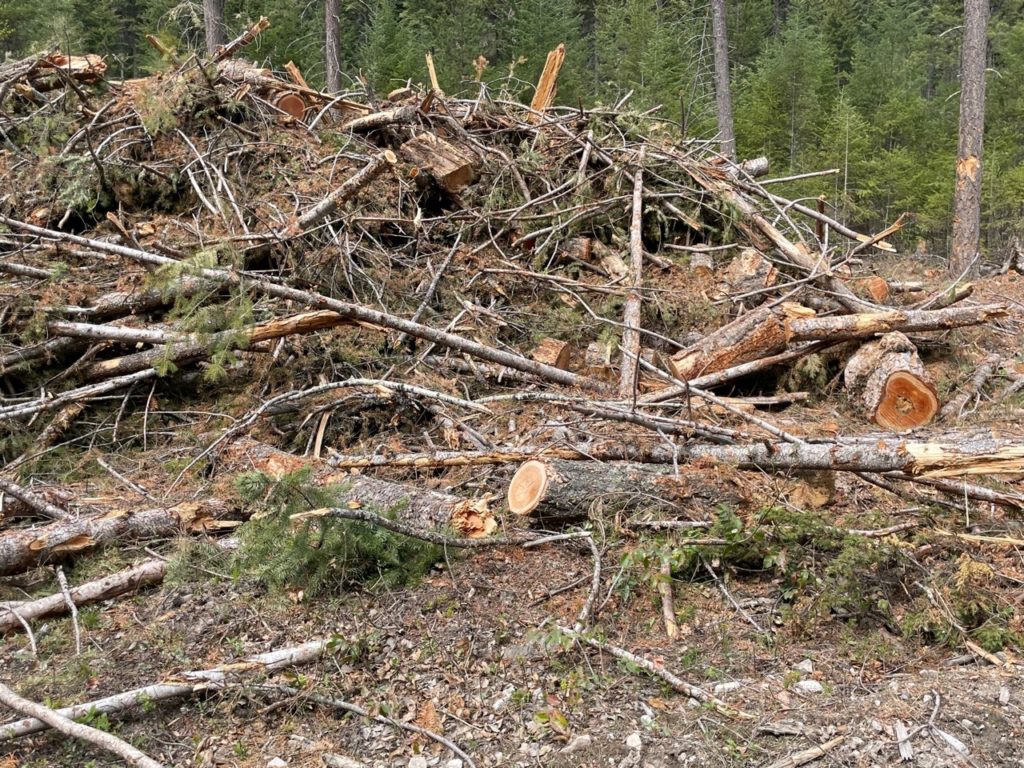
Slash pile in British Columbia

Landfilling this waste material from logging operations isn’t an option as it would emit methane – a greenhouse gas that is about 25 times more potent than CO2. So you can see why it ends up being burned.

In its Modernizing Forest Policy in BC, the government has already identified its intention to phase out the burning of this waste wood left over after harvesting operations and is working with suppliers and other companies to encourage the use of this fibre.

This is a very positive move as this material must come out of the forests to reduce the fuel load that can help wildfires grow and spread to the point where they can’t be controlled, let alone be extinguished.

The wildfire risk is real and growing. Each year more forests and land are destroyed by wildfire, impacting communities, nature, wildlife and the environment.

In the past two decades, wildfires burned two and a half times more land in BC than in the previous 50-year period. According to very early estimates, emissions from last year’s wildfires in the province released around 150 million tonnes of CO2 – equivalent to around 30 million cars on the road for a year.

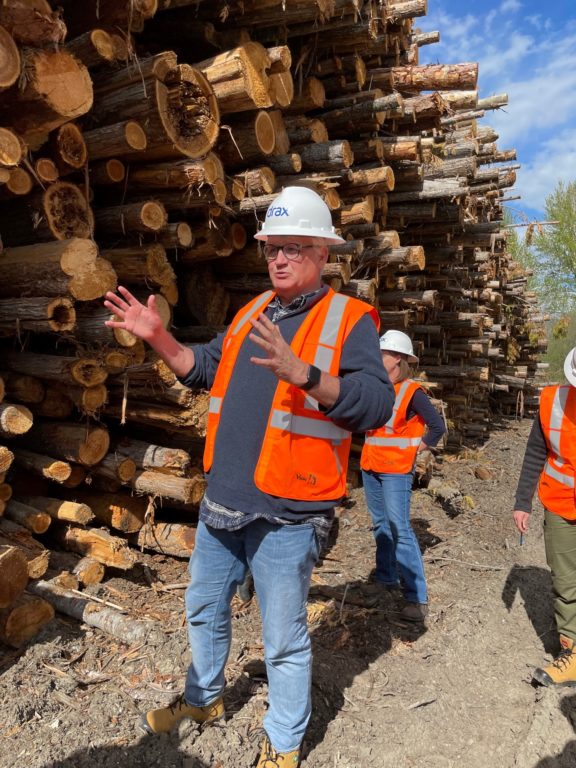
Alan Knight at the log yard for Lavington Pellet Mill in British Columbia

During my recent trip to British Columbia in Canada, First Nations, foresters, academics, scientists and government officials all talked about the burning piles of waste wood left over after logging operations.

Rather than burning it, it would be far better, they say, to use more of this potential resource as a feedstock for pellets that can be used to generate renewable energy, while supporting local jobs across the forestry sector and helping bolster the resilience of Canada’s forests against wildfire.

I like this approach because it brings pragmatism and common sense to the debate over Canada’s forests from the very people who know the most about the landscape around them.

Burning it at the roadside is a waste of a resource that could be put to much better use in generating renewable electricity, displacing fossil fuels, and it highlights the positive role the bioenergy industry can play in enhancing the forests and supporting communities.

Drax is already using some of this waste wood – which I saw in the log yard for our Lavington Pellet mill in British Columbia. This waste wood comprises around 20% of our feedstock. The remaining 80% comes from sawmill residues like sawdust, chips and shavings.

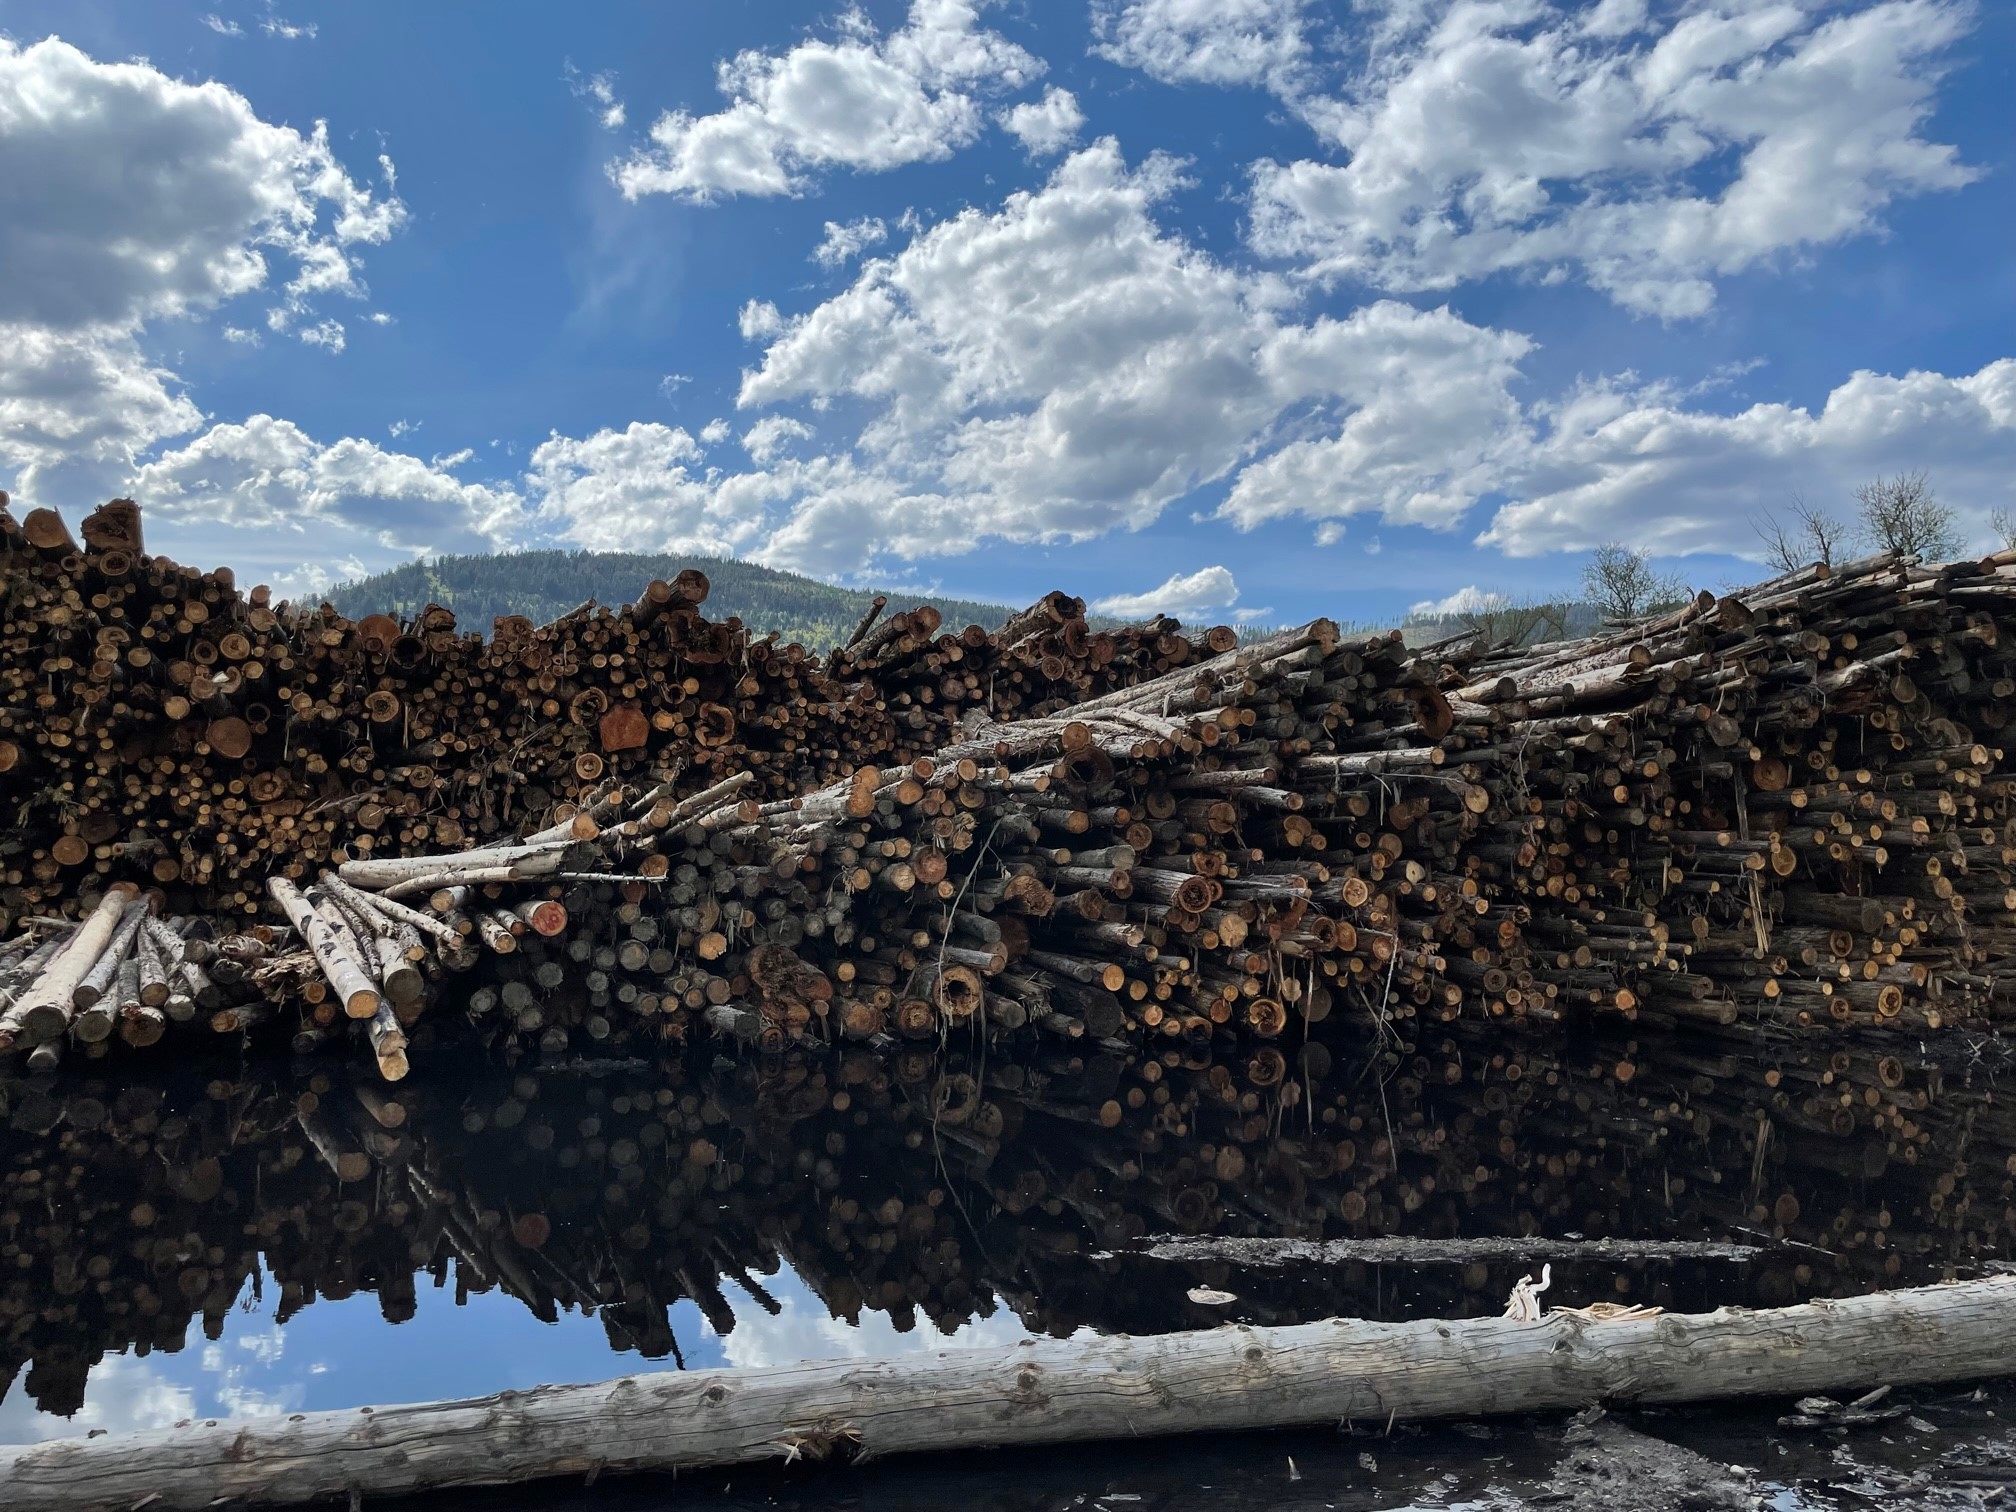
Waste wood for pellets at Lavington Pellet Mill log yard

It’s clear to me that using this waste material that has little other use or market value to make our pellets is an invaluable opportunity to deliver real benefits for communities, jobs and the environment while supporting a sustainable circular economy in the forestry sector.

An introduction to carbon accounting

Key takeaways:

  • Tracking, reporting, and calculating carbon emissions are a key part of progressing countries, industries, and companies towards net zero goals.
  • As a newly established discipline, carbon accounting still lacks standardisation and frameworks in how emissions are tracked, reduced, and mitigated.
  • The main carbon accounting standard used by businesses is the Greenhouse Gas (GHG) Protocol, which lays out three ‘Scopes’ businesses should report and act upon.
  • Carbon accounting evolves from reporting in the use of goals and timeframes in which targets are met.
  • Timeframes are crucial in the deployment of technologies like carbon capture, removals, and achieving net zero.

How can countries and companies find a route to net zero emissions? Many organisations, countries and industries have pledged to balance their emissions before mid-century. They intend to do this through a combination of cutting emissions and removing carbon from the atmosphere.

Tracking and quantifying emissions, understanding output, reducing them, and setting tangible targets that can be worked towards are all central to tackling climate change and reducing greenhouse gas emissions – especially when it comes to carbon dioxide (CO2). Emissions and energy consumption reporting is already common practice and compulsory for businesses over a certain size in the UK. However, carbon accounting takes this a step further.

“Carbon reporting is a statement of physical greenhouse gas emissions that occur over a given period,” explains Michael Goldsworthy, Head of Climate Change and Carbon Strategy at Drax. “Carbon accounting relates to how those emissions are then processed and counted towards specific targets. The methodologies for calculating emissions and determining contributions against targets may then have differing rules depending on which framework or standard is being reported against.”

Carbon accounting tools can help companies and counties understand their carbon footprint – how much carbon is being emitted as part of their operations, who is responsible for them, and how they can be effectively mitigated.

Like how financial accounting may seek to balance a company’s books and calculate potential profit, carbon accounting seeks to do the same with emissions, tracking what an entity emits, and what it reduces, removes, or mitigates. Carbon accounting is, therefore, crucial in understanding how countries and companies can contribute to reaching net zero.

A new space

How different organisations, countries and industries approach carbon accounting is still an evolving process.

“It’s as complex as financial accounting, but with financial accounting, there’s a long standing industry that relies on well-established practices and principles. Carbon accounting by contrast is such a new space,” explains Goldsworthy.

Regardless of its infancy, businesses and countries are already implementing standardised approaches to carbon accounting. Regulations such as emissions trading schemes and reporting systems, such as Streamlined Energy and Carbon Reporting (SECR) and the Taskforce on Climate Related Financial Disclosure (TCFD), are beginning to deliver some degree of consistency in businesses’ carbon reporting.

Other standards such as the GHG Protocol have sought to provide a standardised basis for corporate reporting and accounting. Elsewhere, voluntary carbon markets (e.g. carbon offsets) have also evolved to allow transferral of carbon reductions or removals between businesses, providing flexibility to companies in delivering their climate commitments.

The challenge is in aligning these frameworks so that they work together. For example, emissions within a corporate inventory or offset programme must be accounted for in a way that is consistent with a national inventory.

To date, these accounting systems have evolved independently with different rules and methodologies. Beginning to implement detailed carbon accounting, upon which emissions reductions and removals can be based, requires standardised understanding of what they are and where they come from.

Reporting and tackling Scope One, Two, and Three emissions

The main carbon accounting standard used by businesses is the Greenhouse Gas (GHG) Protocol. This voluntary carbon reporting standard can be used by countries and cities, as well as individual companies globally.

The GHG protocol categorises emissions in three different ‘scopes’, called Scope 1, Scope 2, and Scope 3. Understanding, measuring, and reporting these is a key factor in carbon accounting and can drive meaningful emissions reduction and mitigation.

Scope One – Direct emissions

Scope One emissions are those that come as a direct result of a company or country’s activities. These can include fuel combustion at a factory’s facilities, for example, or emissions from a fleet of vehicles.

Scope One emissions are the most straightforward for an organisation to measure and report, and easier for organisations to directly act on.

Scope Two – Indirect energy emissions

Scope Two emissions are those which come from the generation of energy an organisation uses. These can include emissions form electricity, steam, heating, and cooling.
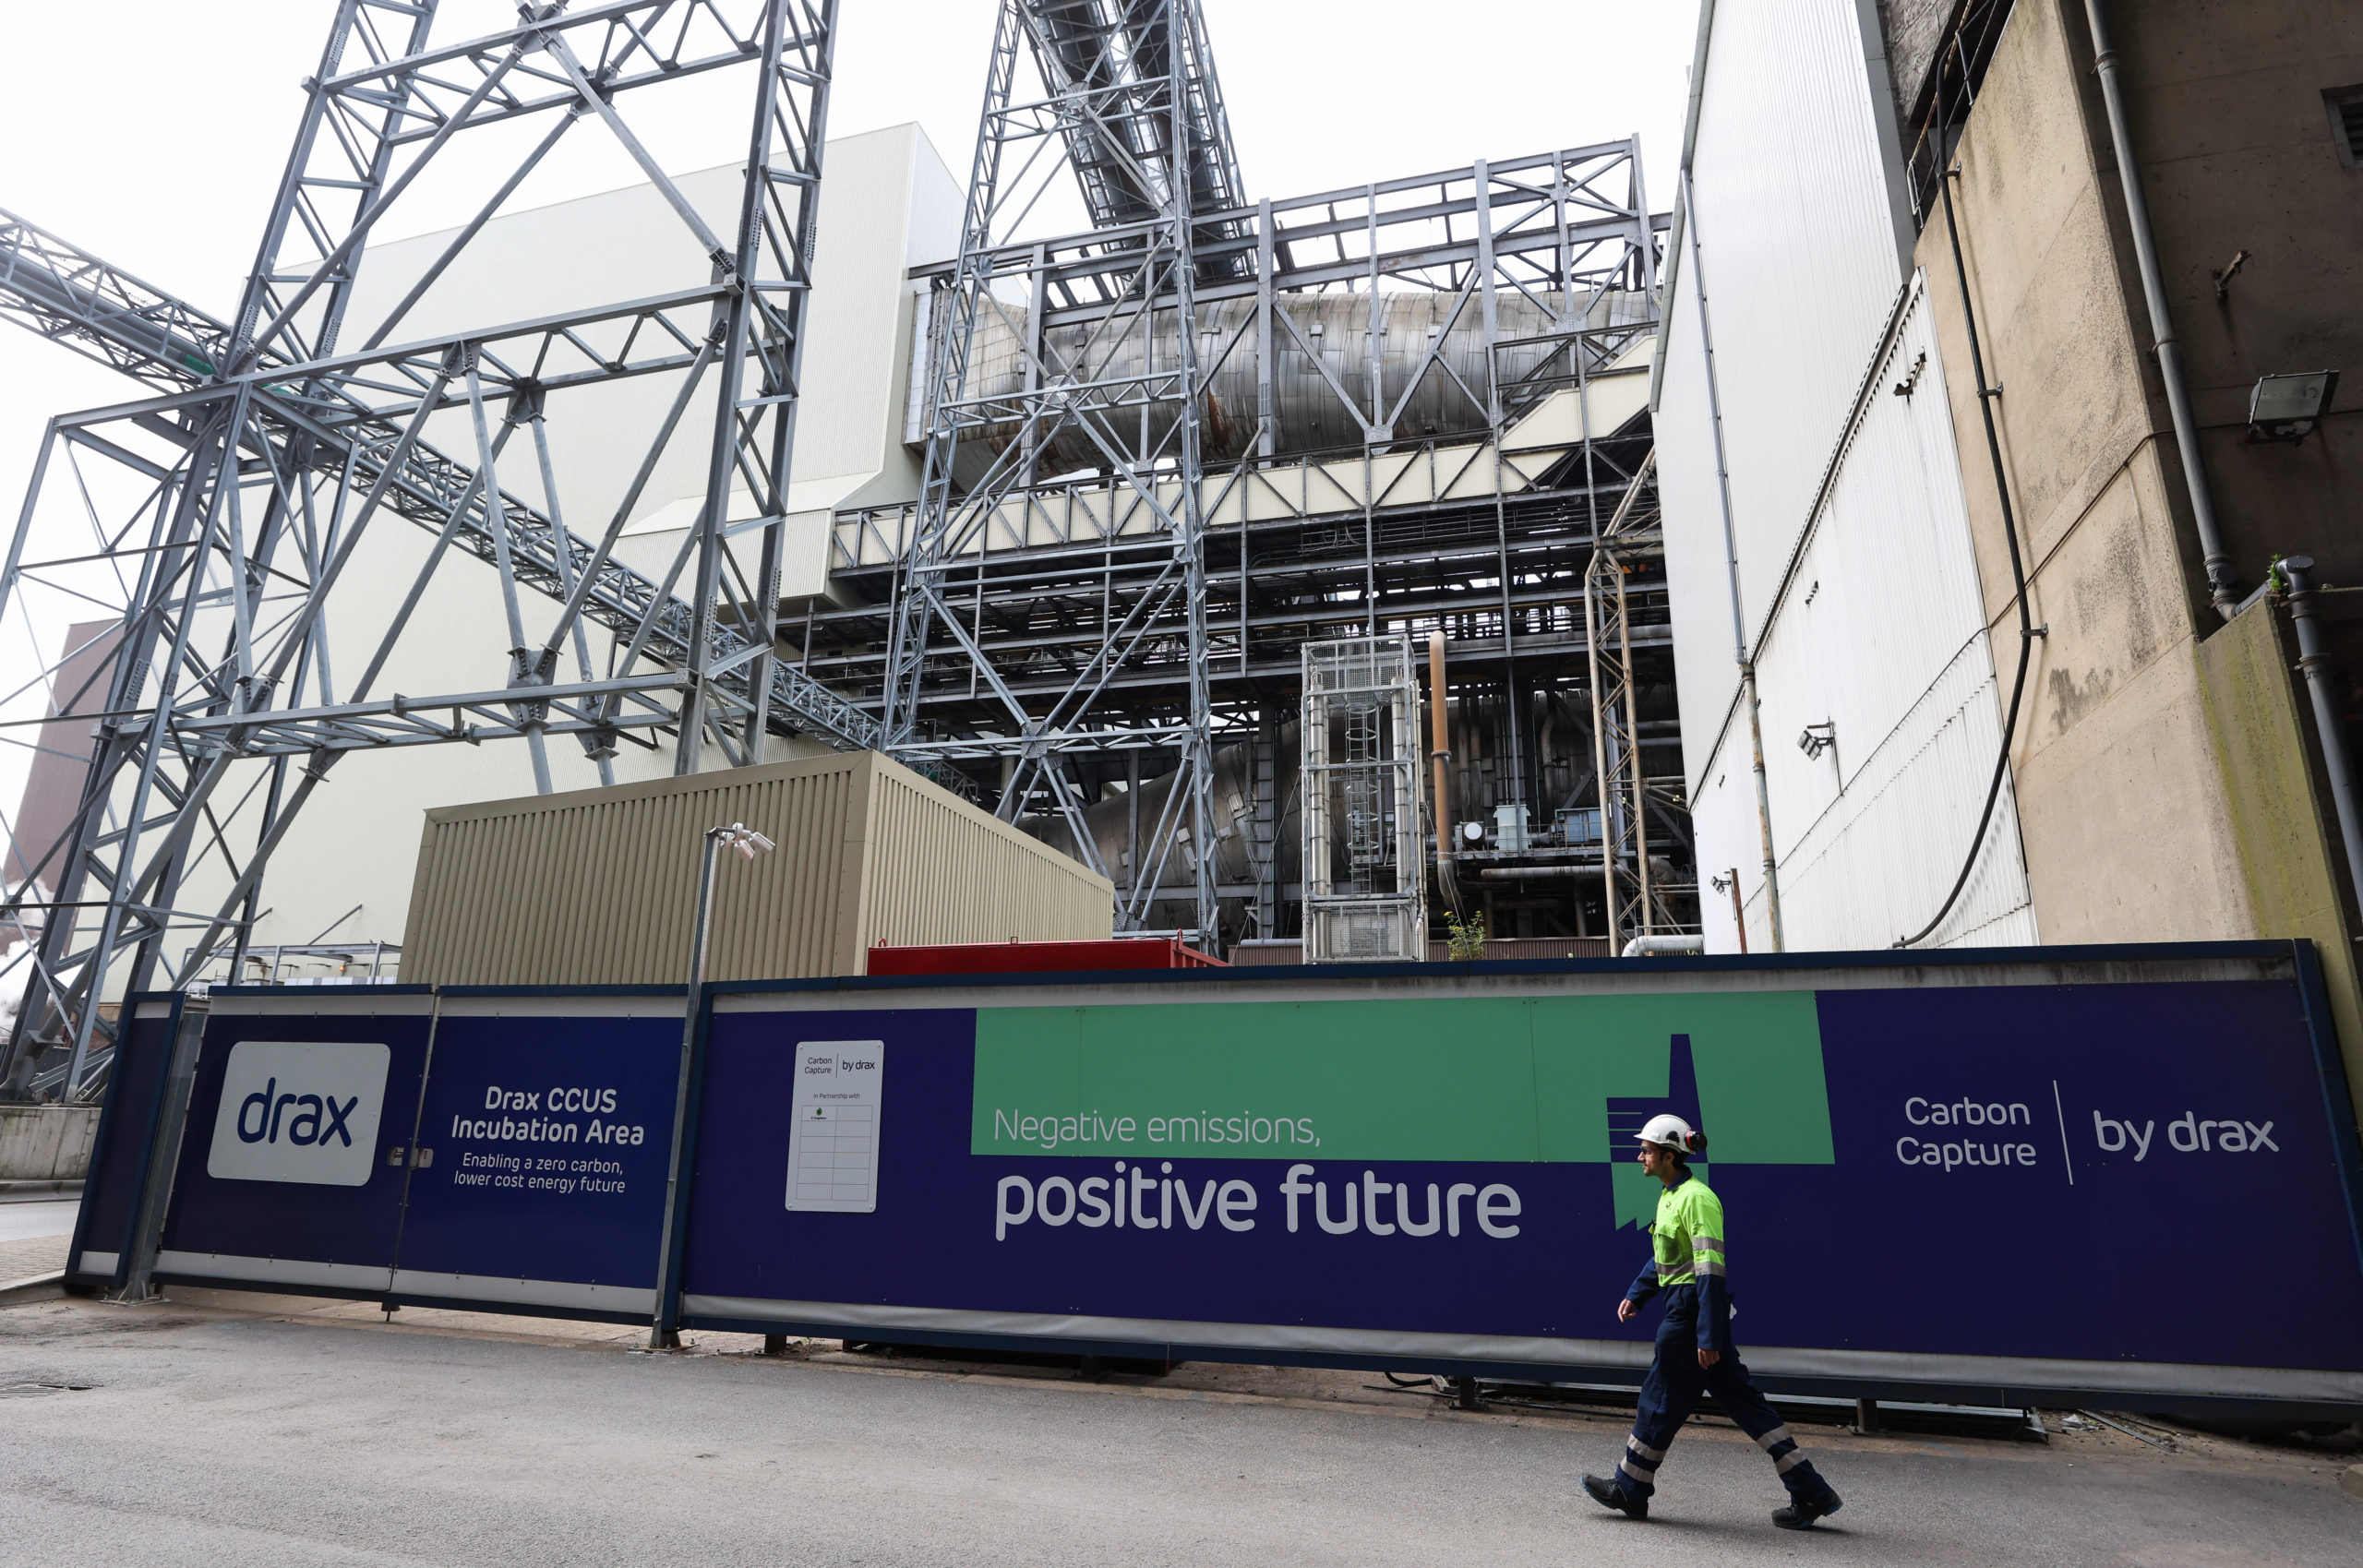
A business may buy electricity, for example, from an electricity supplier, which acquires power from a generator. If that generator is a fossil-fuelled power station the energy consumer’s Scope Two emissions will be greater than if it buys power from a renewable electricity supplier or generates its own renewable power.

The ability to change energy suppliers makes Scope Two relatively straightforward for organisations to act on, assuming renewable energy sources are available in the area.

Scope Three – All other indirect emissions

Scope Three is much broader. It covers upstream and downstream lifecycle emissions of products used or produced by a company, as well as other indirect emissions such as employee commuting and business travel emissions.

Identifying and reducing these emissions across supply and value chains can be difficult for businesses with complex supply lines and global distribution networks. They are also hard for companies to directly influence.

Add in factors like emissions mitigations or offsetting, and the carbon accounting can quickly become much more complex than simply reporting and reducing emissions that occur directly from a company’s activities. Nevertheless, these full-system overviews and whole-product lifecycle accounting are crucial to understanding the true impact of operations and organisations, and to reach climate goals.

Working to timelines

Setting goals with defined timelines and the development of rules that ensure consistent accounting is also crucial to implementing effective climate change mitigation frameworks throughout the global economy. Consider the UK’s aim to be net zero by 2050, or Drax’s ambition to be net negative by 2030, as goals with set timelines.

For many technologies, the time scales over which targets are set have added relevance. There are often upfront emissions to account for and operational emissions that may change over time. Take for example an electric vehicle: the climate benefit will be determined by emissions from construction and the carbon intensity of the electricity used to power it.

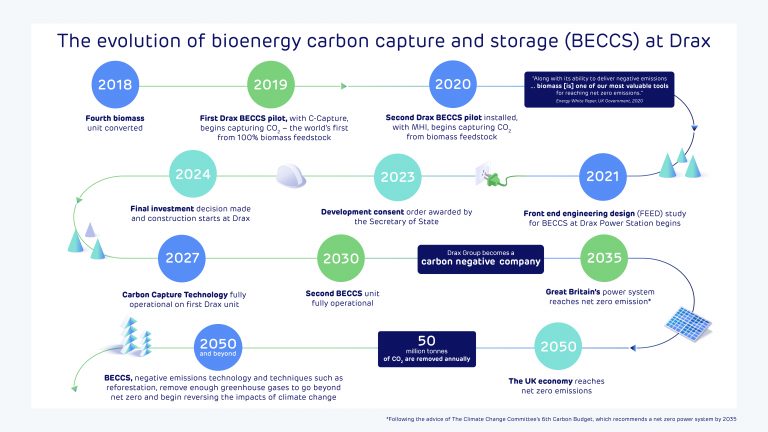
A timeline of BECCS at Drax [click to view/download]

Looking at a brief snapshot at the beginning of its life, say the first couple of years, might not show any climate benefit compared to a vehicle using an internal combustion engine. Over the lifetime of the vehicle, however, meaningful emissions savings may become clear – especially if the electricity powering the vehicle continues to decarbonise over time.

This provides a challenge when setting carbon emissions targets. Targets set too far in the future potentially risk inaction in the short term, while targets set over short periods risk disincentivising technologies that have substantial long-term mitigation potential. 

Delivering net zero

Some greenhouse gas emissions will be impossible to fully abate, such as methane and nitrous oxide emissions from agriculture, while other sectors, like aviation, will be incredibly difficult to fully decarbonise. This makes carbon removal technologies all the more critical to ensuring net zero is achieved.

Technologies such as bioenergy with carbon capture and storage (BECCS) – which combines low-carbon, biomass-fuelled renewable power generation with carbon capture and storage (CCS) to permanently remove emissions from the atmosphere – are already under development.

However, it is imperative that such technologies are accounted for using robust approaches to carbon accounting, ensuring all emission and removals flows across the value chain are accurately calculated in accordance with best scientific practice. In the case of BECCS, it’s vital that not only are emissions from processing and transporting biomass considered, but also its potential impact on the land sector.

Forests from which biomass is sourced will be managed for a variety of reasons, such as mitigating natural disturbance, delivering commercial returns, and preserving ecosystems. Accurate accounting of these impacts is therefore key to ensuring such technologies deliver meaningful reductions in atmospheric CO2within timeframes guided by science.

Accounting for net zero

While carbon accounting is crucial to reaching a true level of net zero in the UK and globally, where residual emissions are balanced against removals, the practice should not be used exclusively to deliver numerical carbon goals.

“To deliver net zero, it’s vital we have robust carbon accounting systems and targets in place, ensuring we reduce fossil emissions as far as possible while also incentivising carbon removal solutions,” says Goldsworthy.

“However, many removal solutions rely on the natural world and so it is critical that ecosystems are not only valued on a carbon basis but consider other environmental factors such as biodiversity as well.”

Cruachan Power Station: Protecting biodiversity while generating power

Key points:

  • The Scottish Highlands are home to a wide variety of landscapes, with a wealth of biodiversity that must be preserved.
  • Cruachan pumped storage hydro station sits within Ben Cruachan and has operated for nearly 60-years without damaging wildlife.
  • Regular surveys and reporting allow Drax to understand the health of different fauna and species over time.
  • It’s promising that even species of bird and insects that are declining in other parts of the UK are regularly spotted around Cruachan.
  • The expansion of the power station has required and will continue to need careful assessment of the area’s biodiversity to minimise any impact the project could cause.

The Scottish Highlands are home to some of the UK’s most stunning natural wonders. From dramatic plunging lochs to the craggy, ice capped Munros, the varied landscape holds some of the most biodiverse areas in the UK. The region’s fauna ranges from red deer to golden eagles, while its flora includes the ancient oak and moss-covered forests that make up the ‘temperate rainforest’ of the Atlantic coast.

Preserving these landscapes and the life that thrives in them is crucial to both the environment and economy of the region. It’s the job of Roddy Davies, Health, Safety, and Environmental Advisor at Drax’s Cruachan Power Station to ensure operations at the site do not damage the natural environment.

“This is a very biodiverse, rich environment. There are a lot of different species, a large variety of natural habitats and plant life,” says Davies. “It’s good that we can say we’ve operated here for nearly 60 years, and all of that is still there. It’s testament that we don’t have a demonstrable negative effect on the wildlife that lives around us.”

Source: Blue Leaf Nature

Energy storage inside a mountain

The pumped storage hydro station sits a kilometre inside Ben Cruachan, a Munro peak in the Western Highland region of Argyll and Bute. It’s not an area you would normally associate with power generation, but it’s perfect for pumped storage hydro. The site has two bodies of water at differing elevations, Loch Awe at the bottom and a reservoir at the top allowing Cruachan to generate power when it’s needed, as well as absorb electricity when there is an excess on the grid by pumping water back up the mountain. Storing it until power is needed and helping to keep the grid balanced.

The subterranean nature of the power station means the massive machinery, including the four reversible turbines, and the heat and noise they generate, is hidden underground.

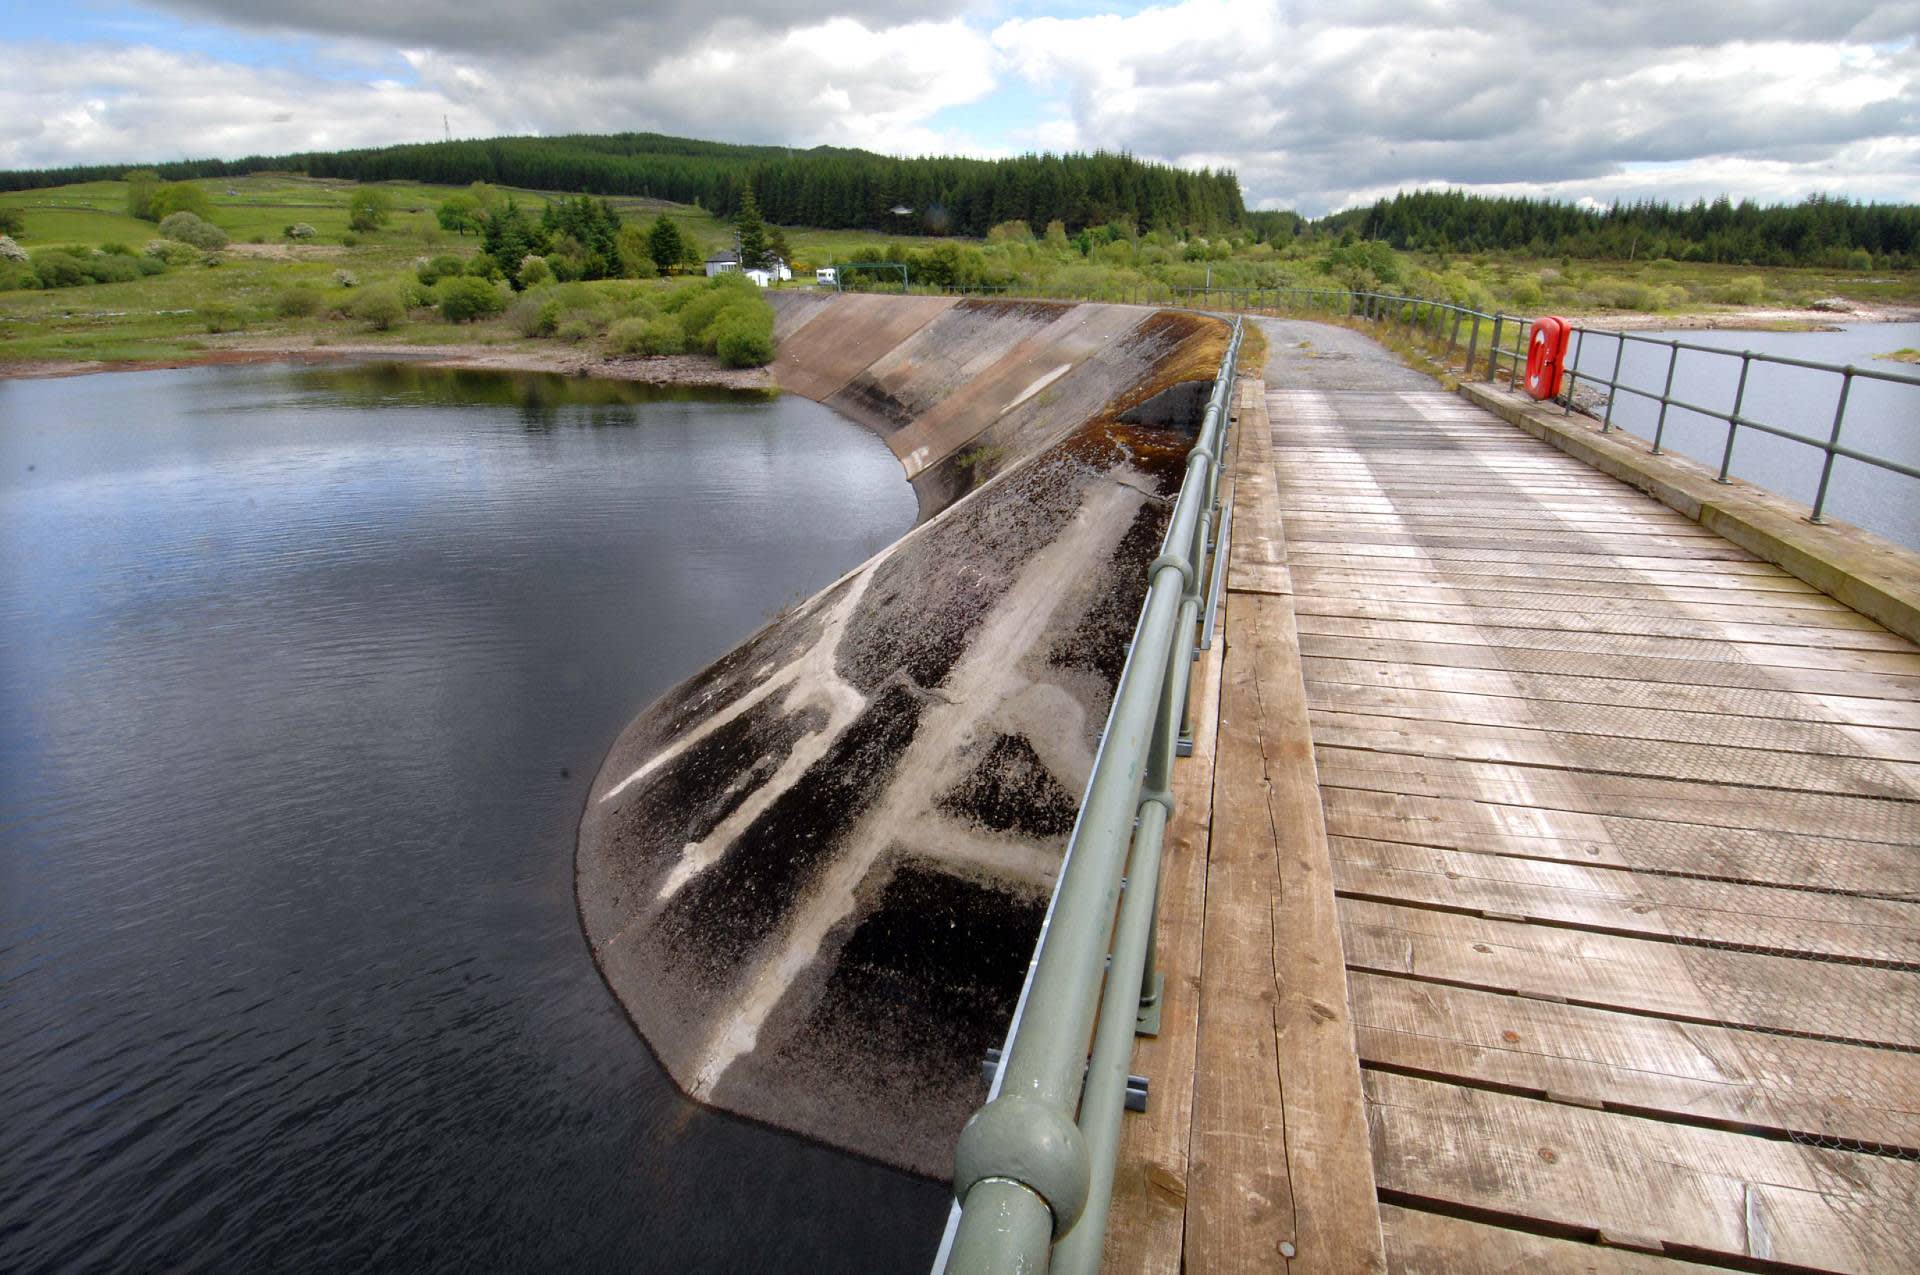
Features on the surface are limited to a few buildings by the entrance tunnel at the banks of Loch Awe, and the dam which contains the upper reservoir on the slopes of Ben Cruachan, as well as several pylons and cables transporting electricity. Even the 316-metre buttress dam takes the landscape into account.

“When Cruachan was built in the ’50s and ’60s, the visual impact of it was very much in the minds of the people who built it and the authorities who approved it. The dam is almost impossible to see from a public place,” explains Davies. “Our presence on the surface is very limited. All the busy goings-on are underground. There’s lots of noise underground, but it doesn’t travel outside.”

Ensuring that the area surrounding Drax’s operation continues to function without damaging the surrounding environment is an ongoing process. Davies deploys annual biodiversity surveys and reporting that gives Drax over a decade of information and analysis to help identify trends.

The wildlife of Ben Cruachan

The Cruachan Power Station Biodiversity Survey for 2021 is the 11th completed by Blue Leaf Nature, a biodiversity service provider. The comprehensive report highlights the incredible diversity of fauna surrounding Cruachan, some of which are declining in other parts of the country.

While the majestic red stags found in other parts of the Highlands are extremely uncommon around Cruachan, 2021 was a particularly exciting year for other types of large mammals. Pine martens – a cat-sized relative of the weasel – are relatively common, appearing alongside red squirrels, red foxes, and otters. Badgers were also added to the site’s list of species for the first time.

Source: Blue Leaf Nature

Mammals, however, are exceeded by the range of birds found around Cruachan, with 53 different species spotted in 2021. Of these, 17 species appear on the Birds of Conservation Concern Five’s red list, the highest threat status to the UK’s bird population, including the Ring Ouzel, Yellowhammer and Tree Pipet. A further 27 appear on the Regional International Union for the Conservation of Nature (IUCN) Red List of Threatened Species. Additionally, six of the spotted species are considered endangered (including Herring Gull and Northern Wheatear) and 11 vulnerable by the IUCN.

Sightings of these threatened species around Cruachan come despite particularly unfavourable weather in 2021. One of the driest Aprils on record followed by an exceptionally wet May disrupted the bird breeding season. This in turn resulted in a difficult nesting season, exacerbated by food shortages due to the weather’s effect on insect life.

In the report’s survey of invertebrates, 150 different species were recorded in 2021, down from 170 in 2018. However, it’s promising that among Cruachan’s creepy-crawlies are many that are in decline elsewhere in the UK, with the numbers of some important insect types are increasing. Dragonfly and damselfly species, for example, increased from five in the previous survey to nine in 2021.

Moths and butterflies are particularly important to monitor, as Davies explains: “they’re a very strong indicator species for the health and quality of an ecosystem. They’re also very sensitive to climatic changes and  react quickly to temperature change.”

Source: Blue Leaf Nature

In 2021, 78 moth species were recorded around Cruachan, including one of Butterfly Conservation’s noted priority species (Yellow-ringed carpet), as well as six species that feature on IUCN’s red or amber lists. There were 11 butterfly species recorded in 2021, including four priority species, as well as two newly spotted species: the Small Copper and the Chequered Skipper.

That species in decline around the country are increasingly thriving at Cruachan is further testament to the power station’s lack of disruption to the environment. And as the UK’s electricity system continues to evolve, and Cruachan power station with it, closely observing the surrounding environment and its inhabitants will become even more important.

Expanding Cruachan while preserving nature

While Cruachan first started generating and storing power in the 1960s, its capabilities are becoming ever more critical as the national grid decarbonises and power generation becomes increasingly decentralised. This is why Drax is undertaking an ambitious project to expand Cruachan.

Cruachan 2 would add a further 600 MW of generation capacity to the plant for a total of 1.04 GW of power. By providing stability services to the grid, the expansion could enable an additional 300-gigawatt hours of renewable power to come online.

Source: Blue Leaf Nature

The project is epic in scale. New underground tunnels and subterranean caverns will house the reversible pump-turbines and will be carved out of the mountain, vastly increasing the size of the power station. But as with any activity in such a landscape, careful planning is essential. Detailed surveys and assessments of the area are a key requirement for planning approval.

“We need to acknowledge what’s here and show that we understand what surveys have found,” says Davies. “Then we have to present our proposals for how we will protect them and mitigate any potential disturbance.”

An advantage of pumped storage hydro is that much of the intensive excavating and construction work will take place underground, with little disturbance on the surface. Cruachan 2 has the added benefit of utilising Cruachan’s existing infrastructure. For example, it would not require flooding a valley to create a new upper reservoir.

Ultimately, Cruachan’s half century-plus of operation has not damaged or degraded the biodiversity of the Western Highlands landscape. And Davies is keen to ensure that legacy is preserved: “As a company, it’s not just something we have to do; we have a moral responsibility to be a responsible operator and look after what’s around us.”

View the Cruachan Power Station Biodiversity Survey 2022 here and find out more about Green Tourism at Cruachan here

What is the carbon cycle?

What is the carbon cycle?

All living things contain carbon and the carbon cycle is the process through which the element continuously moves from one place in nature to another. Most carbon is stored in rock and sediment, but it’s also found in soil, oceans, and the atmosphere, and is produced by all living organisms – including plants, animals, and humans.

Carbon atoms move between the atmosphere and various storage locations, also known as reservoirs, on Earth. They do this through mechanisms such as photosynthesis, the decomposition and respiration of living organisms, and the eruption of volcanoes.

As our planet is a closed system, the overall amount of carbon doesn’t change. However, the level of carbon stored in a particular reservoir, including the atmosphere, can and does change, as does the speed at which carbon moves from one reservoir to another.

What is the role of photosynthesis in the carbon cycle?

Carbon exists in many different forms, including the colourless and odourless gas that is carbon dioxide (CO2). During photosynthesis, plants absorb light energy from the sun, water through their roots, and CO2 from the air – converting them into oxygen and glucose.

The oxygen is then released back into the air, while the carbon is stored in glucose, and used for energy by the plant to feed its stem, branches, leaves, and roots. Plants also release CO2 into the atmosphere through respiration.

Animals – including humans – who consume plants similarly digest the glucose for energy purposes. The cells in the human body then break down the glucose, with CO2 emitted as a waste product as we exhale.

CO2 is also produced when plants and animals die and are broken down by organisms such as fungi and bacteria during decomposition.

What is the fast carbon cycle?

The natural process of plants and animals releasing CO2 into the atmosphere through respiration and decomposition and plants absorbing it via photosynthesis is known as the biogenic carbon cycle. Biogenic refers to something that is produced by or originates from a living organism. This cycle also incorporates CO2 absorbed and released by the world’s oceans.

The biogenic carbon cycle is also called the “fast” carbon cycle, as the carbon that circulates through it does so comparatively quickly. There are nevertheless substantial variations within this faster cycle. Reservoir turnover times – a measure of how long the carbon remains in one location – range from years for the atmosphere to decades through to millennia for major carbon sinks on land and in the ocean.

What is the slow carbon cycle?

In some circumstances, plant and animal remains can become fossilised. This process, which takes millions of years, eventually leads to the formation of fossil fuels. Coal comes from the remains of plants that have been transformed into sedimentary rock. And we get crude oil and natural gas from plankton that once fell to the ocean floor and was, over time, buried by sediment.

The rocks and sedimentary layers where coal, crude oil, and natural gas are found form part of what is known as the geological or slow carbon cycle. From this cycle, carbon is returned to the atmosphere through, for example, volcanic eruptions and the weathering of rocks. In the slow carbon cycle, reservoir turnover times exceed 10,000 years and can stretch to millions of years.

How do humans impact the carbon cycle?

Left to its own devices, Earth can keep CO2 levels balanced, with similar amounts of CO2 released into and absorbed from the air. Carbon stored in rocks and sediment would slowly be emitted over a long period of time. However, human activity has upset this natural equilibrium.

Burning fossil fuel releases carbon that’s been sequestered in geological formations for millions of years, transferring it from the slow to the fast (biogenic) carbon cycle. This influx of fossil carbon leads to excessive levels of atmospheric CO2, that the biogenic carbon cycle can’t cope with.

As a greenhouse gas that traps heat from the sun between the Earth and its atmosphere, CO2 is essential to human existence. Without CO2 and other greenhouse gases, the planet could become too cold to sustain life.

However, the drastic increase in atmospheric CO2 due to human activity means that too much heat is now retained between Earth and the atmosphere. This has led to a continued rise in the average global temperature, a development that is part of climate change.

Where does biomass fit into the carbon cycle?

One way to help reduce fossil carbon is to replace fossil fuels with renewable energy, including sustainably sourced biomass. Feedstock for biomass energy includes plant material, wood, and forest residue – organic matter that absorbs CO2 as part of the biogenic carbon cycle. When the biomass is combusted in energy or electricity generation, the biogenic carbon stored in the organic matter is released back into the atmosphere as CO2.

This is distinctly different from the fossil carbon released by oil, gas, and coal. The addition of carbon capture and storage to bioenergy – creating BECCS – means the biogenic carbon absorbed by the organic matter is captured and sequestered, permanently removing it from the atmosphere. By capturing CO2 and transporting it to geological formations – such as porous rocks – for permanent storage, BECCS moves CO2 from the fast to the slow carbon cycle.

This is the opposite of burning fossil fuels, which takes carbon out of geological formations (the slow carbon cycle) and emits it into the atmosphere (the fast carbon cycle). Because BECCS removes more carbon than it emits, it delivers negative emissions.

Fast facts

  • According to a 2019 study, human activity including the burning of fossil fuels releases between 40 and 100 times more carbon every year than all volcanic eruptions around the world.
  • In March 2021, the Mauna Loa Observatory in Hawaii reported that average CO2 in the atmosphere for that month was 14 parts per million. This was 50% higher than at the time of the Industrial Revolution (1750-1800).
  • There is an estimated 85 billion gigatonne (Gt) of carbon stored below the surface of the Earth. In comparison, just 43,500 Gt is stored on land, in oceans, and in the atmosphere.
  • Forests around the world are vital carbon sinks, absorbing around 7.6 million tonnes of CO2 every year.

Go deeper

Full year results for the twelve months ended 31 December 2021

RNS Number : 6410C
Drax Group PLC
24 February 2022

Twelve months ended 31 December20212020
Key financial performance measures
Adjusted EBITDA (£ million) (1)(2)398412
Continuing operations378366
Discontinued operations – gas generation2046
Net debt (£ million) (3)1,044776
Adjusted basic EPS (pence) (1)26.529.6
Total dividend (pence per share)18.817.1
Total financial performance measures from continuing operations
Operating profit / (loss) (£ million)197(156)
Profit / (loss) before tax (£ million)122(235)

Will Gardiner, CEO of Drax Group, said:

Drax Group CEO Will Gardiner

Drax Group CEO Will Gardiner

“2021 was a transformational year for Drax as we became the world’s leading sustainable biomass generation and supply company, whilst continuing to invest in delivering positive outcomes for the climate, nature and people.

“Over the past ten years Drax has invested over £2 billion in renewable energy and has plans to invest a further £3 billion this decade, supporting the global transition to a low-carbon economy. Our investment has reduced our emissions from power generation by over 95% and we are the UK’s largest producer of renewable power by output. We are proud to be one of the lowest carbon intensity power generators in Europe – a significant transformation from being the largest coal power station in Western Europe.

“We have significantly advanced our plans for bioenergy with carbon capture and storage (BECCS) in the UK and globally. By 2030 we aim to deliver 12 million tonnes of negative emissions and lead the world in providing a critical technology which scientists agree is key to delivering the global transition to net zero.”

Financial highlights

  • Adjusted EBITDA £398 million (2020: £412 million)
  • Strong liquidity and balance sheet – £549 million of cash and committed facilities at 31 December 2021
    • Expect to be below 2x net debt to Adjusted EBITDA by the end of 2022
  • Total dividend – 10% increase to 18.8 pence per share (2020: 17.1 pence per share)
    • Proposed final dividend of 11.3 pence per share (2020: 10.3 pence per share)

Strategic highlights

  • Acquisition of Pinnacle Renewable Energy Inc. for C$385 million (£222 million) (enterprise value of C$796 million)
  • Sale of Combined Cycle Gas Turbine (CCGT) generation assets for £186 million
  • Development of the world’s leading sustainable biomass generation and supply company
    • Supply – 17 pellet plants and developments across three major fibre baskets, production capacity of c.5Mt pa
    • 22Mt (c.$4.5 billion) of long-term contracted sales to high-quality customers in Asia and Europe
    • 14Mt of own-use sales through 2026
    • Generation – 2.6GW of biomass generation – UK’s largest source of renewable power by output
  • Development of BECCS in UK
    • East Coast Cluster – selected as one of two priority carbon capture and storage clusters
    • Government – BECCS included in Net Zero Strategy and Interim Bioenergy Strategy
    • Drax Power Station – planning application started, technology partner selected and FEED study commenced

Strategic outlook – growth plans aligned with global low-carbon growth

  • To be a global leader in sustainable biomass
    • Targeting 8Mt pa of production capacity and 4Mt pa of biomass sales to third parties by 2030
  • To be a global leader in negative emissions
    • Targeting 12Mt pa of negative CO2 – UK and international BECCS
  • To be a UK leader in dispatchable, renewable generation
    • Key system support role for biomass and expansion of Cruachan Pumped Storage Power Station
  • All underpinned by continued focus on safety, sustainability and biomass cost reduction
  • Investments totalling £3bn in period to 2030, fully funded through cash generation
    • Pellet production, UK BECCS and Cruachan expansion

Future positive – people, nature, climate

  • CO2 – >95% reduction in generation emissions since 2012 – sale of CCGT generation assets and end of commercial coal in March 2021 and closure in September 2022 following fulfilment of Capacity Market agreements
  • Sustainable biomass sourcing
    • Science-based sustainability policy compliant with current UK and EU law on sustainable biomass
    • Biomass produced using sawmill and forest residuals, and low-grade roundwood, which often have few alternative markets and would otherwise be landfilled, burned or left to rot, releasing CO2 and other GHGs
    • Significant increase in sawmill residues used by Drax to produce pellets – 57% of total fibre (2020: 21%)
    • 100% of woody biomass produced by Drax verified against SBP, SFI, FSC®(4) or PEFC Chain of Custody certification with third-party supplier compliance primarily via SBP certification
    • Glasgow Declaration launched at COP26 to establish a world-wide industry standard on biomass sustainability
  • People – Diversity, Equity and Inclusion – female representation in the UK business increased to 36% (2020:34%)
  • Governance – two new North America based Non-Executive Directors – Kim Keating and Erika Peterman

Operational review

Pellet Production – acquisition of Pinnacle, capacity expansion and biomass cost reduction

  • Adjusted EBITDA (including Pinnacle since 13 April 2021) up 65% to £86 million (2020: £52 million)
    • Pellet production up 107% to 3.1Mt (2020: 1.5Mt), with 1.2Mt sales to third parties and increased own-use
    • Total $/t cost of production down 7% to $143/t(5) (2020: $153/t(5))
  • Developments in US southeast (2021-22) – addition of c.0.6Mt of new production capacity
    • Completion of LaSalle and Morehouse plant expansions
    • Commissioning of Demopolis and first satellite plant (Leola)
    • Commencement of construction of second satellite plant (Russellville)
  • Further opportunities for growth and cost reduction – increased production capacity, sales to third parties, continued operational efficiencies and improvement, wider range of sustainable biomass and technical innovation

Generation – dispatchable renewable generation and system support services

  • UK’s largest generator of renewable power by output – 12% of total
  • Adjusted EBITDA from discontinued CCGT generation assets £20 million (2020: £46 million)
  • Adjusted EBITDA from continuing operations £352 million (2020: £400 million)
    • Biomass – 5% increase in generation less major planned outage on CfD unit (successfully completed November 2021), higher cost from historic foreign exchange hedging and system charges
    • Pumped storage / hydro – good operational performance
    • Strong portfolio system support role (balancing mechanism, ancillary services and optimisation)
    • Limited role for coal in H2 at request of system operator
  • Ongoing cost reductions to support operating model for biomass generation at Drax Power Station from 2027
    • Reduction in fixed cost base – end of commercial coal operations March 2021, closure September 2022
    • Third biomass turbine upgrade, delivering improved thermal efficiency and lower maintenance cost
    • Trials to expand range of lower cost sustainable biomass – up to 35% blend achieved in test runs on one unit
  • As at 21 February 2022, Drax had 20.4TWh of power hedged between 2022 and 2024 on its ROC and hydro generation assets at £70.2/MWh, with a further 0.9TWh equivalent of gas sales (transacted for the purpose of accessing additional liquidity for forward sales from ROC units and highly correlated to forward power prices) plus additional sales under the CfD mechanism
Contracted power sales 21 February 2022202220232024
ROC (TWh(6))10.96.92.4
ROC (£ per MWh)70.070.070.6
Hydro (TWh)0.2--
Hydro (£ per MWh)90.9--
Gas hedges (TWh equivalent)(7)0.50.4
Pence per therm105101
CfD(6/8) typical annual output c.5TWh and current strike price £118.5/MWh

Customers – renewable power under long-term contracts to high-quality I&C customers and decarbonisation products

  • Adjusted EBITDA of £6 million inclusive of impact of mutualisation changes and Covid-19 (2020: £39 million loss)
  • Continued development of Industrial & Commercial (I&C) portfolio
    • Focusing on key sectors to increase sales to high-quality counterparties supporting generation route to market
    • Energy services to expand the Group’s system support capability and customer sustainability objectives
  • Rebranding of the Haven Power I&C business to Drax Energy Solutions
  • Closure of Oxford and Cardiff offices as part of Small & Medium-Size (SME) strategic review and continuing to evaluate options for SME portfolio to maximise value and align with strategy

Other financial information

  • Total operating profit from continuing operations of £197 million (2020: £156 million loss, including exceptional costs totalling £275 million principally in respect of the announced closure of coal operations)
  • Total profit after tax from continuing operations of £55 million including a £49 million non-cash charge from revaluing deferred tax balances following confirmation of UK corporation tax rate increases from 2023 (2020: loss of £195 million)
  • 2021 capital investment of £230 million (2020: £183 million) – continued investment in biomass strategy
  • 2022 expected capital investment of £230–250 million – £70-80 million maintenance, £20 million enhancements, £110-120 million strategic, (primarily biomass and BECCS), and £30 million other (primarily safety and systems)
    • Excludes any material investment in non-core Open Cycle Gas Turbine developments – continuing to evaluate options, including sale, but continue to invest as appropriate to fulfil obligations under the Capacity Market agreements and to maximise value from any sale. In the event of a sale Drax expects to recover any capital expenditure incurred during 2022, which could total up to £100 million
  • Group cost of debt below 3.5%
    • Refinancing of Canadian facilities (July 2021) with lower cost ESG facility following Pinnacle acquisition
  • Net debt of £1,044 million (31 December 2020: £776 million), including cash and cash equivalents of £317 million (31 December 2020: £290 million)
    • Expect net debt to Adjusted EBITDA below 2x by the end of 2022
Forward Looking Statements
This announcement may contain certain statements, expectations, statistics, projections and other information that are, or may be, forward-looking. The accuracy and completeness of all such statements, including, without limitation, statements regarding the future financial position, strategy, projected costs, plans, beliefs and objectives for the management of future operations of Drax Group plc (“Drax”) and its subsidiaries (the “Group”), are not warranted or guaranteed. By their nature, forward-looking statements involve risk and uncertainty because they relate to events and depend on circumstances that may occur in the future. Although Drax believes that the statements, expectations, statistics and projections and other information reflected in such statements are reasonable, they reflect the Company’s current view and no assurance can be given that they will prove to be correct. Such events and statements involve risks and uncertainties. Actual results and outcomes may differ materially from those expressed or implied by those forward-looking statements. There are a number of factors, many of which are beyond the control of the Group, which could cause actual results and developments to differ materially from those expressed or implied by such forward-looking statements. These include, but are not limited to, factors such as: future revenues being lower than expected; increasing competitive pressures in the industry; and/or general economic conditions or conditions affecting the relevant industry, both domestically and internationally, being less favourable than expected. We do not intend to publicly update or revise these projections or other forward-looking statements to reflect events or circumstances after the date hereof, and we do not assume any responsibility for doing so.

Results presentation and webcast arrangements

Management will host a webcast presentation for analysts and investors at 11:00am (UK Time) on Thursday 24 February 2022.

The presentation can be accessed remotely via a live webcast link, as detailed below. After the meeting, the webcast recording will be made available and access details of this recording are also set out below.

A copy of the presentation will be made available from 7:00am (UK time) on Thursday 24 February 2022 for download at: https://www.drax.com/investors/announcements-events-reports/presentations/

Event Title: Drax Group plc: Full Year Results
Event Date: Thursday 24 February 2022
Event Time: 11:00am (UK time)
Webcast Live Event Link:  https://secure.emincote.com/client/drax/drax019
Conference call and pre-register Link: https://secure.emincote.com/client/drax/drax019/vip_connect
Start Date:  Thursday 24 February 2022
Delete Date:  Friday 24 February 2023
Archive Link:  https://secure.emincote.com/client/drax/drax019


For further information, please contact: [email protected]

View investor presentation here

Alabama Cluster Catchment Area Analysis

The area of timberland in the Alabama cluster catchment area has remained stable over the last 20 years, increasing slightly from 4.08 million ha to 4.16 million ha, an increase of 79 thousand hectares.  This area represents 79.6% of the total land area in 2020, up from 78.1% in 2020.  The total area of forestland and woodland was 86% of the catchment area in 2020, with farmland making up 13% and urban areas 1%.  This land base can be considered to be heavily forested and dominated by timberland.

Figure 1: Land Use Type – Alabama cluster

The timberland area is classified by growth rate potential, capable of achieving a minimum of 0.57 m3/ha/year.  More than 95% of the timberland area is in private ownership.  This proportion has remained stable since 2000 as shown in Figure 2.

Figure 2: Timberland Ownership Profile – Alabama cluster

The total standing volume, the amount of carbon stored in the forest area, has increased by 115 million m3 since 2000 an increase of 30%. Most of this increase has occurred since 2010, with 90 million m3 added to the inventory since this time, reflecting the maturing age class of the forest resource as it passes through the peak growth phase.  Almost all of this increase has been in the softwood pine forest area, with a combined increase of 86 million m3 since 2010.  Pine saw-timber and chip-n-saw both increased by 46% since 2010 and pine pulpwood by 25% over the same period. Suggesting that the average tree size is getting larger as the forest matures.

Figure 3: Standing Volume by Product Class – Alabama cluster

One measure of the sustainability of harvesting levels is to compare average annual growth against removals.  This comparison gives a growth drain ratio (GDR).  Where removals are equal to or lower than growth (a GDR of 1 or more) this is a measure of sustainability, where the ratio falls below 1, this can indicate that harvesting levels are not sustainable in the long-term.  Figure 4 shows that all pine product classes have a positive GDR since 2010.  In particular the pine pulpwood GDR ratio is in excess of 2 suggesting that there is a substantial surplus of this product category.  By contrast, the hardwood GDR for both saw-timber and pulpwood are both lower than 1 suggesting that harvesting levels for hardwood species should be reduced until growth can recover.

Figure 4: Growth Drain Ratio by Product Class – Alabama cluster

Figure 5 shows the maturing age class of the forest area, charting the change in annual surplus and deficit in each product class.  The trend shows that harvesting of pine saw-timber from 2000 to 2008 represented a deficit of growth compared to harvesting removals.  This indicates an immature forest resource with a low quantity of forest categorised as saw-timber, therefore harvesting volume in mature stands outweighed the growth in mid-rotation stands.  As the forest aged, and more standing timber grew into the saw-timber category, the surplus of annual growth compared to removals increased.  Saw-timber growth in 2020 was 3 million m3 higher than in 2000.  The surplus of pine pulpwood has remained positive and has increased substantially from 3 million m3 in 2000 to 6.5 million m3 in 2020 despite harvesting levels increasing slightly over this period.

Figure 5: Annual Surplus/Deficit of Growth and Removal by Product Class – Alabama Cluster

Biomass demand began in 2008 at a very small scale, representing just 0.5% of total pulpwood demand in the catchment area.  From around 2013 it began to increase and reached peak in 2015 with a total demand of 724,000 tons of pulpwood in that year, representing 8.1% of total pulpwood demand in the catchment area.  After that time, demand for pulpwood declined as pellet mills switched to mill residuals.  The latest data on pulpwood demand shows that the biomass sectors made up just 2.8% of total pulpwood demand in 2020 with just over 216,000 tonnes of total demand.  This demonstrates that the biomass and wood pellet sector is a very small component of the market in this region and unlikely to influence forest management decision making, as shown in Figure 6.

Figure 6: Pulpwood Demand by Market – Alabama Cluster

Pine pulpwood stumpage prices have declined significantly since a peak in 2013, falling from an annual high of $9.46 when demand was strongest to just $4.12 in 2020 as demand for pine pulpwood declined in 2020.  Pine saw-timber prices have seen a similar decline from a high point in the early 2000’s to a plateau from 2011 onwards.  Saw-timber stumpage more than halved in value over this period from $49 per ton to $22 per ton.  This can have a significant impact on forest management objectives and decision making.

Figure 7: Stumpage Price Change by Product Category – Alabama Cluster

Detailed below are the summary findings from Hood Consulting on the impact of biomass demand on key issues in the Alabama cluster catchment area.

Is there any evidence that bioenergy demand has caused the following:

Deforestation?

No. US Forest Service (USFS) data shows that total timberland area has held steady and averaged roughly 4,172,000 hectares in the Alabama Cluster catchment area since Alabama Pellets-Aliceville started up in late-2012. More importantly, planted pine timberland (the predominant source of roundwood utilized by the bioenergy industry for wood pellet production) has increased more than 75,000 hectares (+4.9%) in the catchment area since Alabama Pellets’ startup in 2012.

A change in management practices (rotation lengths, thinnings, conversion from hardwood to pine)?

Inconclusive. Changes in management practices have occurred in the catchment area over the last two decades. However, the evidence is inconclusive as to whether increased demand attributed to bioenergy has caused or is responsible for those changes.

Clearcuts and thinnings are the two major types of harvests that occur in this region, both of which are long-standing, widely used methods of harvesting timber. TimberMart-South (TMS) data shows that the prevalence of thinnings temporarily increased in the Alabama Cluster market (from 2007-2013) due to the weakening of pine sawtimber markets. Specifically, challenging market conditions saw pine sawtimber stumpages prices decline from an average of $47 per ton from 2000-2006 to just over $23 per ton in 2011, or a roughly 50% decrease from 2000-2006 average levels. This led many landowners to refrain from clearcutting (a type of harvest which typically removes large quantities of pine sawtimber), as they waited for pine sawtimber prices to improve. However, pine sawtimber stumpage prices never recovered and have held between $22 and $25 per ton since 2011. Ultimately, landowners returned to more ‘normal’ management practices by 2014, with thinnings falling back in line with pre-2007 trends.

The catchment area has also experienced some conversion. Specifically, from 2000-2020, planted pine timberland increased more than 460,000 hectares while natural hardwood and mixed pine-hardwood timberland decreased a combined 390,000 hectares. Note that the increase in planted pine timberland and decrease in natural hardwood/mixed pine-hardwood timberland over this period were both gradual and occurred simultaneously. This suggests a management trend in which natural timber stands are converted to plantation pine following final harvest. It’s also important to note that there is little evidence that links these changes to increased demand from bioenergy, as this conversion trend begun years prior to the startup of Alabama Pellets and continued nearly unchanged following the pellet mill’s startup.

Diversion from other markets?

No. Demand for softwood (pine) sawlogs increased an estimated 12% in the catchment area from 2012-2020. Also, there is no evidence that increased demand from bioenergy has caused a diversion from other softwood pulpwood markets (i.e. pulp/paper). Also, even though softwood pulpwood demand not attributed to bioenergy is down 14% since Alabama Pellets-Aliceville’s startup in 2012, there is no evidence that increased demand from bioenergy has caused this decrease. Rather, the decrease in demand from non-bioenergy sources is due to a combination of reduced product demand (and therefore reduced production) and increased utilization of sawmill residuals.

An unexpected or abnormal increase in wood prices?

No. The startup of Alabama Pellets-Aliceville added roughly 450,000 metric tons of softwood pulpwood demand to the catchment area from 2012-2016, and this increase in demand coincided with essentially no change in delivered pine pulpwood (PPW) price over this same period. Ultimately, the additional demand placed on the catchment area following the startup of Alabama Pellets-Aliceville was offset by a decrease in demand from other sources from 2012-2016, and, as a result, delivered PPW prices remained nearly unchanged.

However, the Aliceville facility was shut down for a majority of 2017 due to the catastrophic failure of a key piece of environmental equipment, and this was followed by Alabama Pellets’ strategic decision to transition to residual-consumption only beginning in 2018, which eliminated more than 360,000 metric tons of annual softwood pulpwood demand from 2016-2018. Over this same period, softwood pulpwood demand from other sources also decreased nearly 360,000 metric tons. So, with the elimination of roughly 720,000 metric tons of annual softwood pulpwood demand from all sources from 2016-2018, delivered PPW prices in the catchment area proceeded to decrease more than 6% over this period. Since 2018, total softwood pulpwood demand has increased roughly 4% in the catchment area (due to increases in demand from non-bioenergy sources), and this increase that has coincided with a simultaneous 4% increase in delivered PPW price.

Statistical analysis did identify a positive relationship between softwood biomass demand and delivered PPW price. However, the relationship between delivered PPW price and non-biomass-related softwood pulpwood demand was found to be stronger, which is not unexpected given that pine pulpwood demand not attributed to bioenergy has accounted for 94% of total pine pulpwood demand in the catchment area since 2012. Ultimately, the findings provide evidence that PPW price is influenced by demand from all sources – not just from bioenergy or from pulp/paper, but from both.

Furthermore, note that Alabama Pellets’ shift to residual-consumption only beginning in 2018 resulted in no increase in pine sawmill chip prices, as the price of pine sawmill chips in the Alabama Cluster catchment area rather decreased from 2018-2020, despite a more than 100,000-metric ton increase in pine sawmill chip consumption by the Aliceville mill over this period.

A reduction in growing stock timber?

No. From 2012 (the year Alabama Pellets started up) to 2020, total growing stock inventory increased an average of 2.6% per year (+22% total) in the Alabama Cluster catchment area. Specifically, inventories of pine sawtimber and pine chip-n-saw increased 41% and 40%, respectively, while pine pulpwood (PPW) inventory increased 25% over this same period.

A reduction in the sequestration rate of carbon?

No. US Forest Service (USFS) data shows the average annual growth rate of total growing stock timber in the Alabama Cluster catchment area increased from 6.0% in 2012 to 6.2% in 2020, suggesting that the sequestration rate of carbon also increased slightly over this period.

Note that the increase in overall growth rate (and therefore increase in the sequestration rate of carbon) can be linked to gains in pine timberland and associated changes with the catchment area forest. Specifically, growth rates decline as timber ages, so the influx of new pine timberland (due to the conversion of both hardwood forests and cropland) has resulted in just the opposite, with the average age of softwood (pine) growing stock inventory decreasing from an estimated 35.4 years of age in 2000 to 33.2 years of age in 2010 and to 32.2 years of age in 2020 (total growing stock inventory decreased from 41.9 to 41.0 and to 40.4 years of age over these periods).

An increase in harvesting above the sustainable yield capacity of the forest area?

No. Growth-to-removals (G:R) ratios, which compare annual timber growth to annual timber removals, provides a measure of market demand relative to supply as well as a gauge of market sustainability. In 2020, the latest available, the G:R ratio for pine pulpwood (PPW), the predominant timber product utilized by the bioenergy sector, equaled 3.26 (recall that a value greater than 1.0 indicates sustainable harvest levels).

Moreover, note that the PPW G:R ratio has increased in the catchment area since the Aliceville mill’s startup in 2012, despite the associated increases in pine pulpwood demand. In this catchment area, pine pulpwood demand from non-bioenergy sources decreased more than 860,000 metric tons from 2012 to 2020, and this decrease more than offset any increase in demand from bioenergy.

Impact of bioenergy demand on:

Timber growing stock inventory

Neutral. According to USFS data, inventories of pine pulpwood (PPW) increased 25% in the catchment area from 2012-2020, and this increase in PPW inventory can be linked to both increases in pine timberland and harvest levels below the sustainable yield capacity of the forest area. Specifically, pine timberland (both planted and natural combined) increased more than 185,000 hectares in the catchment area from 2012-2020. Over this same period, annual harvests of PPW were 65% below maximum sustainable levels.

Timber growth rates

Neutral. The average annual growth rate of total growing stock timber increased from 6.0% in 2012 to 6.2% in 2020 in the Alabama Cluster catchment area, despite pine pulpwood (PPW) growth rate decreasing from 15.1% to 12.5% over this period. However, this decrease in PPW growth rate was not due to increased demand attributed to bioenergy but rather to the aging of PPW within its product group and its natural movement along the pine growth rate curve. Specifically, USFS data indicates the average age of PPW inventory in the catchment area increased from an estimated 13.4 years of age in 2012 to 13.6 years of age in 2020.

Forest area

Neutral. In the Alabama Cluster catchment area, total forest (timberland) area remained nearly unchanged (decreasing only marginally) from 2012-2020. However, pine timberland – the predominant source of roundwood utilized by the bioenergy industry for wood pellet production – increased more than 185,000 hectares over this period, and this increase can be linked to several factors, including conversion from both hardwood and mixed pine-hardwood forests as well as conversion from cropland.

Specifically, the more than 185,000-hectare increase in pine timberland from 2012-2020 coincided with a roughly 197,000-hectare decrease in hardwood/mixed pine-hardwood timberland and a more than 8,000-hectare decrease in cropland over this period. Furthermore, statistical analysis confirmed these inverse relationships, identifying strong negative correlations between pine timberland area and both hardwood/mixed pine-hardwood timberland area and cropland in the catchment area from 2012-2020.

Wood prices

Negative/Neutral. Softwood pulpwood demand attributed to bioenergy increased from roughly 80,000 metric tons in 2012 (the year Alabama Pellets-Aliceville started up) to more than 655,000 metric tons in 2015 (the year biomass demand reached peak levels). However, this roughly 575,000-metric ton increase in softwood biomass demand coincided with essentially no change in delivered pine pulpwood (PPW) price – which averaged $26.40 per ton in 2012 and $26.39 per ton in 2015. Ultimately, the additional demand placed on this catchment area following the startup of Alabama Pellets-Aliceville was offset by a more than 680,000-metric ton decrease in demand from other sources over this same period, and, as a result, delivered PPW prices remained nearly unchanged. Also note that Alabama Pellets’ strategic shift to consume residuals only (a transition that begun in 2018 and had been completed by 2019) resulted in a nearly 480,000-metric ton decrease in softwood biomass demand in the catchment area from 2015 to 2020. Over this same period, softwood pulpwood demand from other sources decreased more than 180,000 metric tons. In total, softwood pulpwood demand from all sources decreased more than 660,000 metric tons from 2015 to 2020, and this decrease in demand resulted in delivered PPW prices decreasing 5% over this period.

Statistical analysis did identify a positive relationship between softwood biomass demand and delivered PPW price. However, the relationship between delivered PPW price and non-biomass-related softwood pulpwood demand was found to be stronger, which is not unexpected given that pine pulpwood demand not attributed to bioenergy has accounted for 94% of total pine pulpwood demand in the catchment area since 2012. Ultimately, the findings provide evidence that PPW price is influenced by demand from all sources – not just from bioenergy or from pulp/paper, but from both.

Markets for solid wood products

Positive. In the Alabama Cluster catchment area, demand for softwood sawlogs used to produce lumber and other solid wood products has increased an estimated 12% since 2012, and this increase in softwood lumber production has consequentially resulted in the increased production of sawmill residuals (i.e. chips, sawdust, and shavings) – by-products of the sawmilling process and materials utilized by Alabama Pellets to produce wood pellets.

Moreover, the increased availability of sawmill residuals and lower relative cost compared to roundwood (after chipping and other processing costs are considered) led Alabama Pellets to make a strategic shift to utilize residuals only for wood pellet production beginning in 2019. So, not only has Alabama Pellets benefited from the greater availability of this lower-cost sawmill by-product, but lumber producers have also benefited, as Alabama Pellets has provided an additional outlet for these producers and their by-products.

Read the full report: Alabama Cluster Catchment Area Analysis

This is part of a series of catchment area analyses around the forest biomass pellet plants supplying Drax Power Station with renewable fuel. Others in the series can be found here

The jobs needed to build a net zero energy future

Many components are needed to tackle climate change and reach environmental milestones such as meeting the goals of the Paris Agreement. One of those components is the right workforce, large enough and with the necessary skills and knowledge to take on the green energy jobs of a low-carbon future. In 2020, the renewable energy sector employed 11.5 million people around the world, but as the industry continues to expand that workforce will only grow.

Last year, a National Grid report found that in the UK alone, 120,000 jobs will need to be filled in the low-carbon energy sector by 2030, to meet the country’s climate objectives. That figure is expected to rise to 400,000 by 2050.  The UK energy sector as a whole currently supports 738,000 jobs and much of this workforce already has the skills needed for a low carbon society . Others can be reskilled and retrained, helping to bolster the future workforce by supporting employees through the green transition.

At a global level energy sector jobs are expected to increase from 18 million to 26 million by 2050. Jobs that will span the full energy spectrum; from researching and advising on low-carbon solutions to installing and implementing them.

Here are some of the roles that will be key to the low-carbon energy transformation:

A wind farm under construction off the English coast

Wind turbine technicians

According to the International Energy Agency (IEA), wind power is this year set for a 17% increase in global energy generation compared to 2020, the biggest increase of any renewable power source. The IEA also forecasts that wind power will need to grow tenfold by 2050 if the world is to meet the goals of the Paris Agreement. It’s not surprising, therefore, that wind turbine technicians – the professionals who install, inspect, maintain, and repair wind turbines – are in high demand. In the US, wind turbine technician is the fastest-growing job in the country – with 68% growth projected over the 2020-2030 period – to give just one example.

In the UK, many wind turbine technicians have a background in engineering or experience from the wider energy sector. Although there are wind turbine technician and maintenance courses available, they are not a prerequisite, and many employers offer apprenticeships and on-the-job training – smoothing the path for energy professionals to transition into the role.

Solar panel installers

Today, solar photovoltaic (solar PV) is the biggest global employer in renewable energy, accounting for 3.8 million jobs. The IEA also reported a 23% uptick in solar PV installations around the world in 2020. In the UK, there are currently 13.2 gigawatts (GW) of installed solar power capacity. Trade association Solar Energy UK predicts this will need to rise to at least 40 GW by 2030 if the UK is to succeed in becoming a net zero economy by 2050. The trade association believes this could see the creation of 13,000 new solar energy jobs.

Solar panel installers – who carry out the important job of installing and maintaining solar PV – are essential to a low-carbon future. Many solar panel installers in the UK come from a background in electrical installation or have transitioned from engineering. While there are training courses specifically designed for solar panel installers, they are not a necessity, particularly if you already have on-the-job experience in a relevant sector. This makes a move to becoming a solar panel installer relatively easy for someone already working in energy or with a mind for engineering.

Energy consultants

Businesses of all kinds must play a role in the transition to net zero. Organisations must be able to manage their energy use and begin switching to renewable sources. As professionals who advise companies on this process, renewable energy consultants are a key part of the green energy workforce. Aspects of the job include identifying how organisations use their electric assets and helping businesses optimise those assets to build responsiveness and flexibility into energy-intensive operations. The core responsibilities of a renewable energy consultant are to reduce a company’s environmental impact while helping the business reduce energy costs and identifying opportunities.

Carbon accountants

A growing number of businesses are setting targets for reducing their greenhouse gas (GHG) emissions. But that’s only possible if you can first determine what your GHG emissions are and where they come from, which is where the relatively young field of carbon accounting comes in. Through what is known as physical carbon accounting, companies can assess the emissions their activities generate, and where in the supply chain the emissions are occurring. This allows businesses to implement more accurate actions and be realistic in their timelines for reducing emissions.

On a wider scale, accurate carbon accounting will be crucial in certifying emissions reductions or abatement, as well as in the distribution of carbon credits or penalties as whole economies push towards net zero.

Battery technology researchers

Energy storage is essential to a low-carbon energy future.  The ability to store and release energy from intermittent sources such as wind and solar will be crucial in meeting demand and balancing a renewables-driven grid. While many forms of energy storage already exist, developing electric batteries that can be deployed at scale is still a comparatively new and expanding area.

Global patenting activities in the field of batteries and other electricity storage increased at an annual rate of 14% –  four times faster than the average for technology – between 2005 and 2018. However, it’s estimated that to meet climate objectives, the world will need nearly 10,000 GW hours of battery and other electricity storage by 2040. This is 50 times the current level and research and innovation will be crucial to delivering bigger and more efficient batteries.

Farmers and foresters

How we use and manage land will be important in lowering carbon emissions and creating a sustainable future for people and the planet. Crops like corn, sugarcane, and soybean can serve as feedstock for biofuel and bioenergy, and farming by-products such as cow manure can be used in the development of biofuel.

Techniques adopted in the agricultural sector will also be important in optimising soil sequestration capabilities while ensuring it is nutrient-rich enough to grow food. These techniques include the use of biochar, a solid form of charcoal produced by heating biomass without oxygen. Research indicates that biochar can sequester carbon in the soil for centuries or longer. It also helps soil retain water and could contribute to reducing the use of fertilisers by making the soil more nutrient-dense.

Forests, meanwhile, provide material for industries like construction, the by-products from which can serve as feedstock for woody biomass, primarily in the shape of low-grade wood that would otherwise remain unused. Sustainably managed forests, such as those from which Drax sources its biomass, have two-fold importance. They both enable woody biomass for bioenergy and ensure CO2 is removed from the atmosphere as part of the natural carbon cycle.

Biofuel engineers and scientists

Farmers and foresters provide feedstock for biofuels, but it’s biofuel scientists and engineers who research, develop, and enhance them, opening the door to alternative fuels for vehicles, heating, and even jet engines.

According to the IEA, production of biofuel that can be used as an alternative to fossil fuels in the transport sector grew 6% in 2019. However, the organisation forecasts that production will need to increase 10% annually until 2030to be in line with Paris Agreement climate targets.

Scientific innovations that can help boost the production of biofuel around the world, therefore, continues to be vital. As is the work of biofuel engineers who assess and improve existing biofuel systems and develop new ones that can replace fossil fuels like petrol and diesel.

The wealth of knowledge around fuels in the oil and gas industries means there is ample opportunity for scientists and engineers who work with fossil fuels to bring their skills to crucial low-carbon roles.

Geologists

The overriding goal of the Paris Agreement is to limit global warming to “well below” 2 and preferably to 1.5 degrees Celsius, compared to pre-industrial levels. This is an objective the IEA has said will be “virtually impossible” to fulfil without carbon capture and storage (CCS) technologies. CCS entails capturing CO2 and transporting it for safe and permanent underground storage in geological formations such as depleted oil and gas fields, coal seams, and saline aquifers.

According to the Global CCS Institute, the world will need a 100-fold increase on the 27 CCS project currently in operation by 2050. Knowledge and research into rock types, formations, and reactivity will be important in helping identify sites deep underground that can be used for safe, permanent carbon storage, and sequestration. Skills and expertise gained in the oil and gas industries will allow professionals in these sectors to make the switch from careers in fossil fuel to roles that help power a net zero economy.  

Employees working at Drax Power Station

Chemists

The role of chemists is also vital to decarbonisation. Knowledge and research around CO2 is a potent force in the effort to reduce and remove it from the atmosphere.

Technologies like CCS, bioenergy with carbon capture and storage (BECSS) and direct air carbon capture and storage (DACCS) are based around such research. Carbon capture processes are chemical reactions between emissions streams and solvents, often based on amines, and GHGs. Understanding and controlling these processes makes chemistry a key component of delivering carbon capture at the scale needed to help meet climate targets.

Chemists’ role in decarbonisation is far from limited to carbon capture methods. From battery technology to reforestation, chemists’ understanding of the elements can help drive action against climate change.

Bringing together disciplines

Tackling climate change on the scale needed to achieve the aims of the Paris Agreement depends on collaboration between industries, countries, and disciplines. Decarbonisation projects such as the UK’s East Coast Cluster, which encompasses both Zero Carbon Humber and Net Zero Teesside, fuse engineering and construction jobs with scientific and academic work.

Zero Carbon Humber, which brings together 12 organisations, including Drax, is expected to create as many as 47,800 jobs in the region by 2027. Among these are construction sector jobs for welders, pipefitters, machine installers and technicians. In addition, indirect jobs are predicted to be created across supply chains, from material manufacturing to the logistics of supporting a workforce.

Meeting climate challenges and delivering projects on the scale of Zero Carbon Humber, depends on creating an energy workforce that combines the knowledge of the past with the green energy skills of the future.

Drax’s apprenticeships have readied workers for the energy sector for decades, and will continue to do so as we build a low-carbon future. Options include four-year technical apprenticeships in mechanical, electrical, and control and instrumentation engineering. Getting on-the-job training and practical experience, apprentices receive a nationally recognised qualification, such as a BTEC or an NVQ Level 3, at the end of the programme.

Apprentices at Drax Power Station [2021]

The workforce needed to make low carbon societies a reality will be a diverse one – stretching from apprentices to experienced professionals with a background in traditional or renewable energy. It will also span every aspect of the renewable energy field, from the chemists and biofuel scientists who develop key technologies to the solar panel installers and wind turbine technicians who fit and maintain the necessary equipment.

The skills needed to take on these roles are already plentiful in the UK and around the world. Overcoming challenges on the road to net zero requires refocussing these existing talents, skills, and careers towards a new goal.