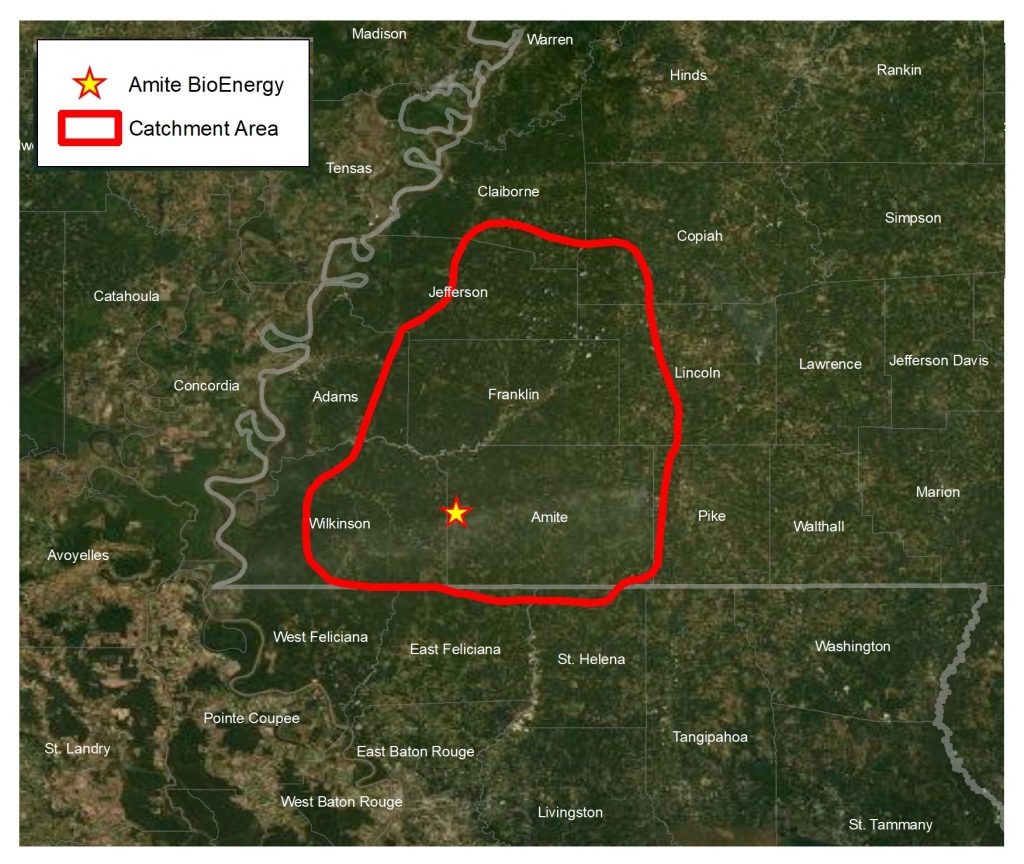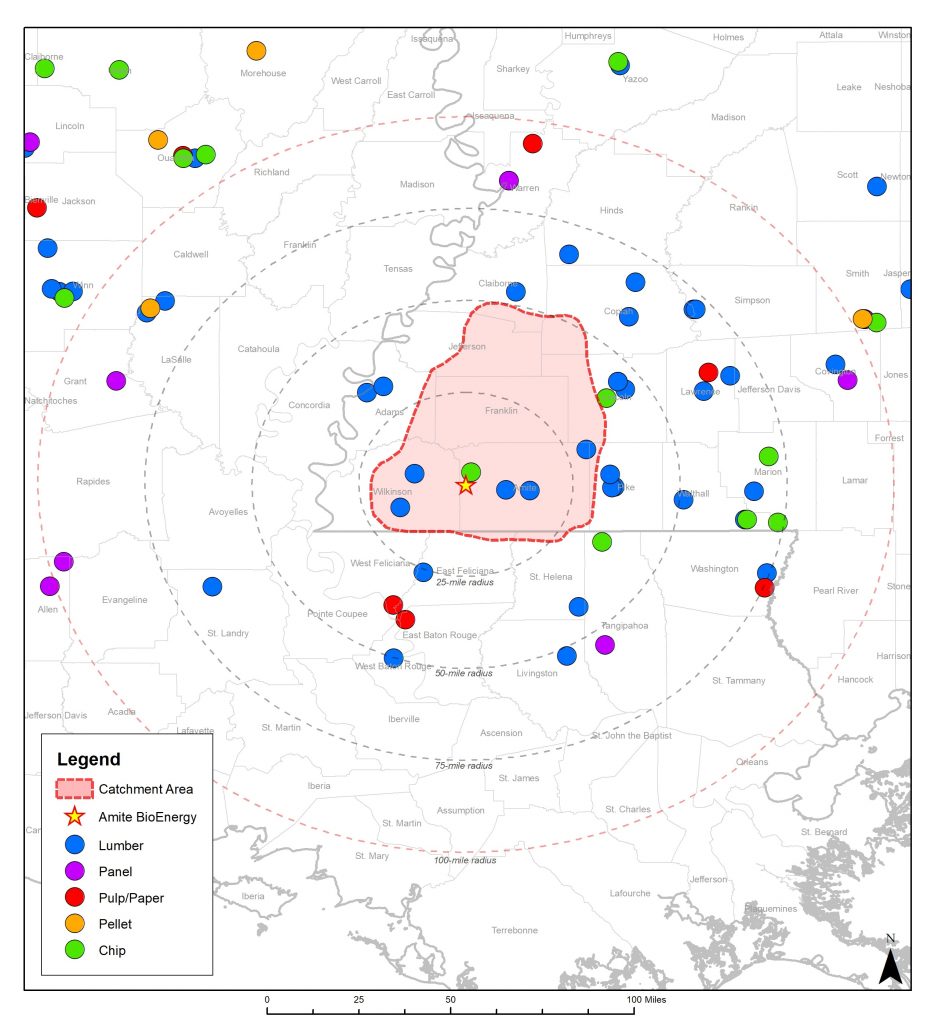
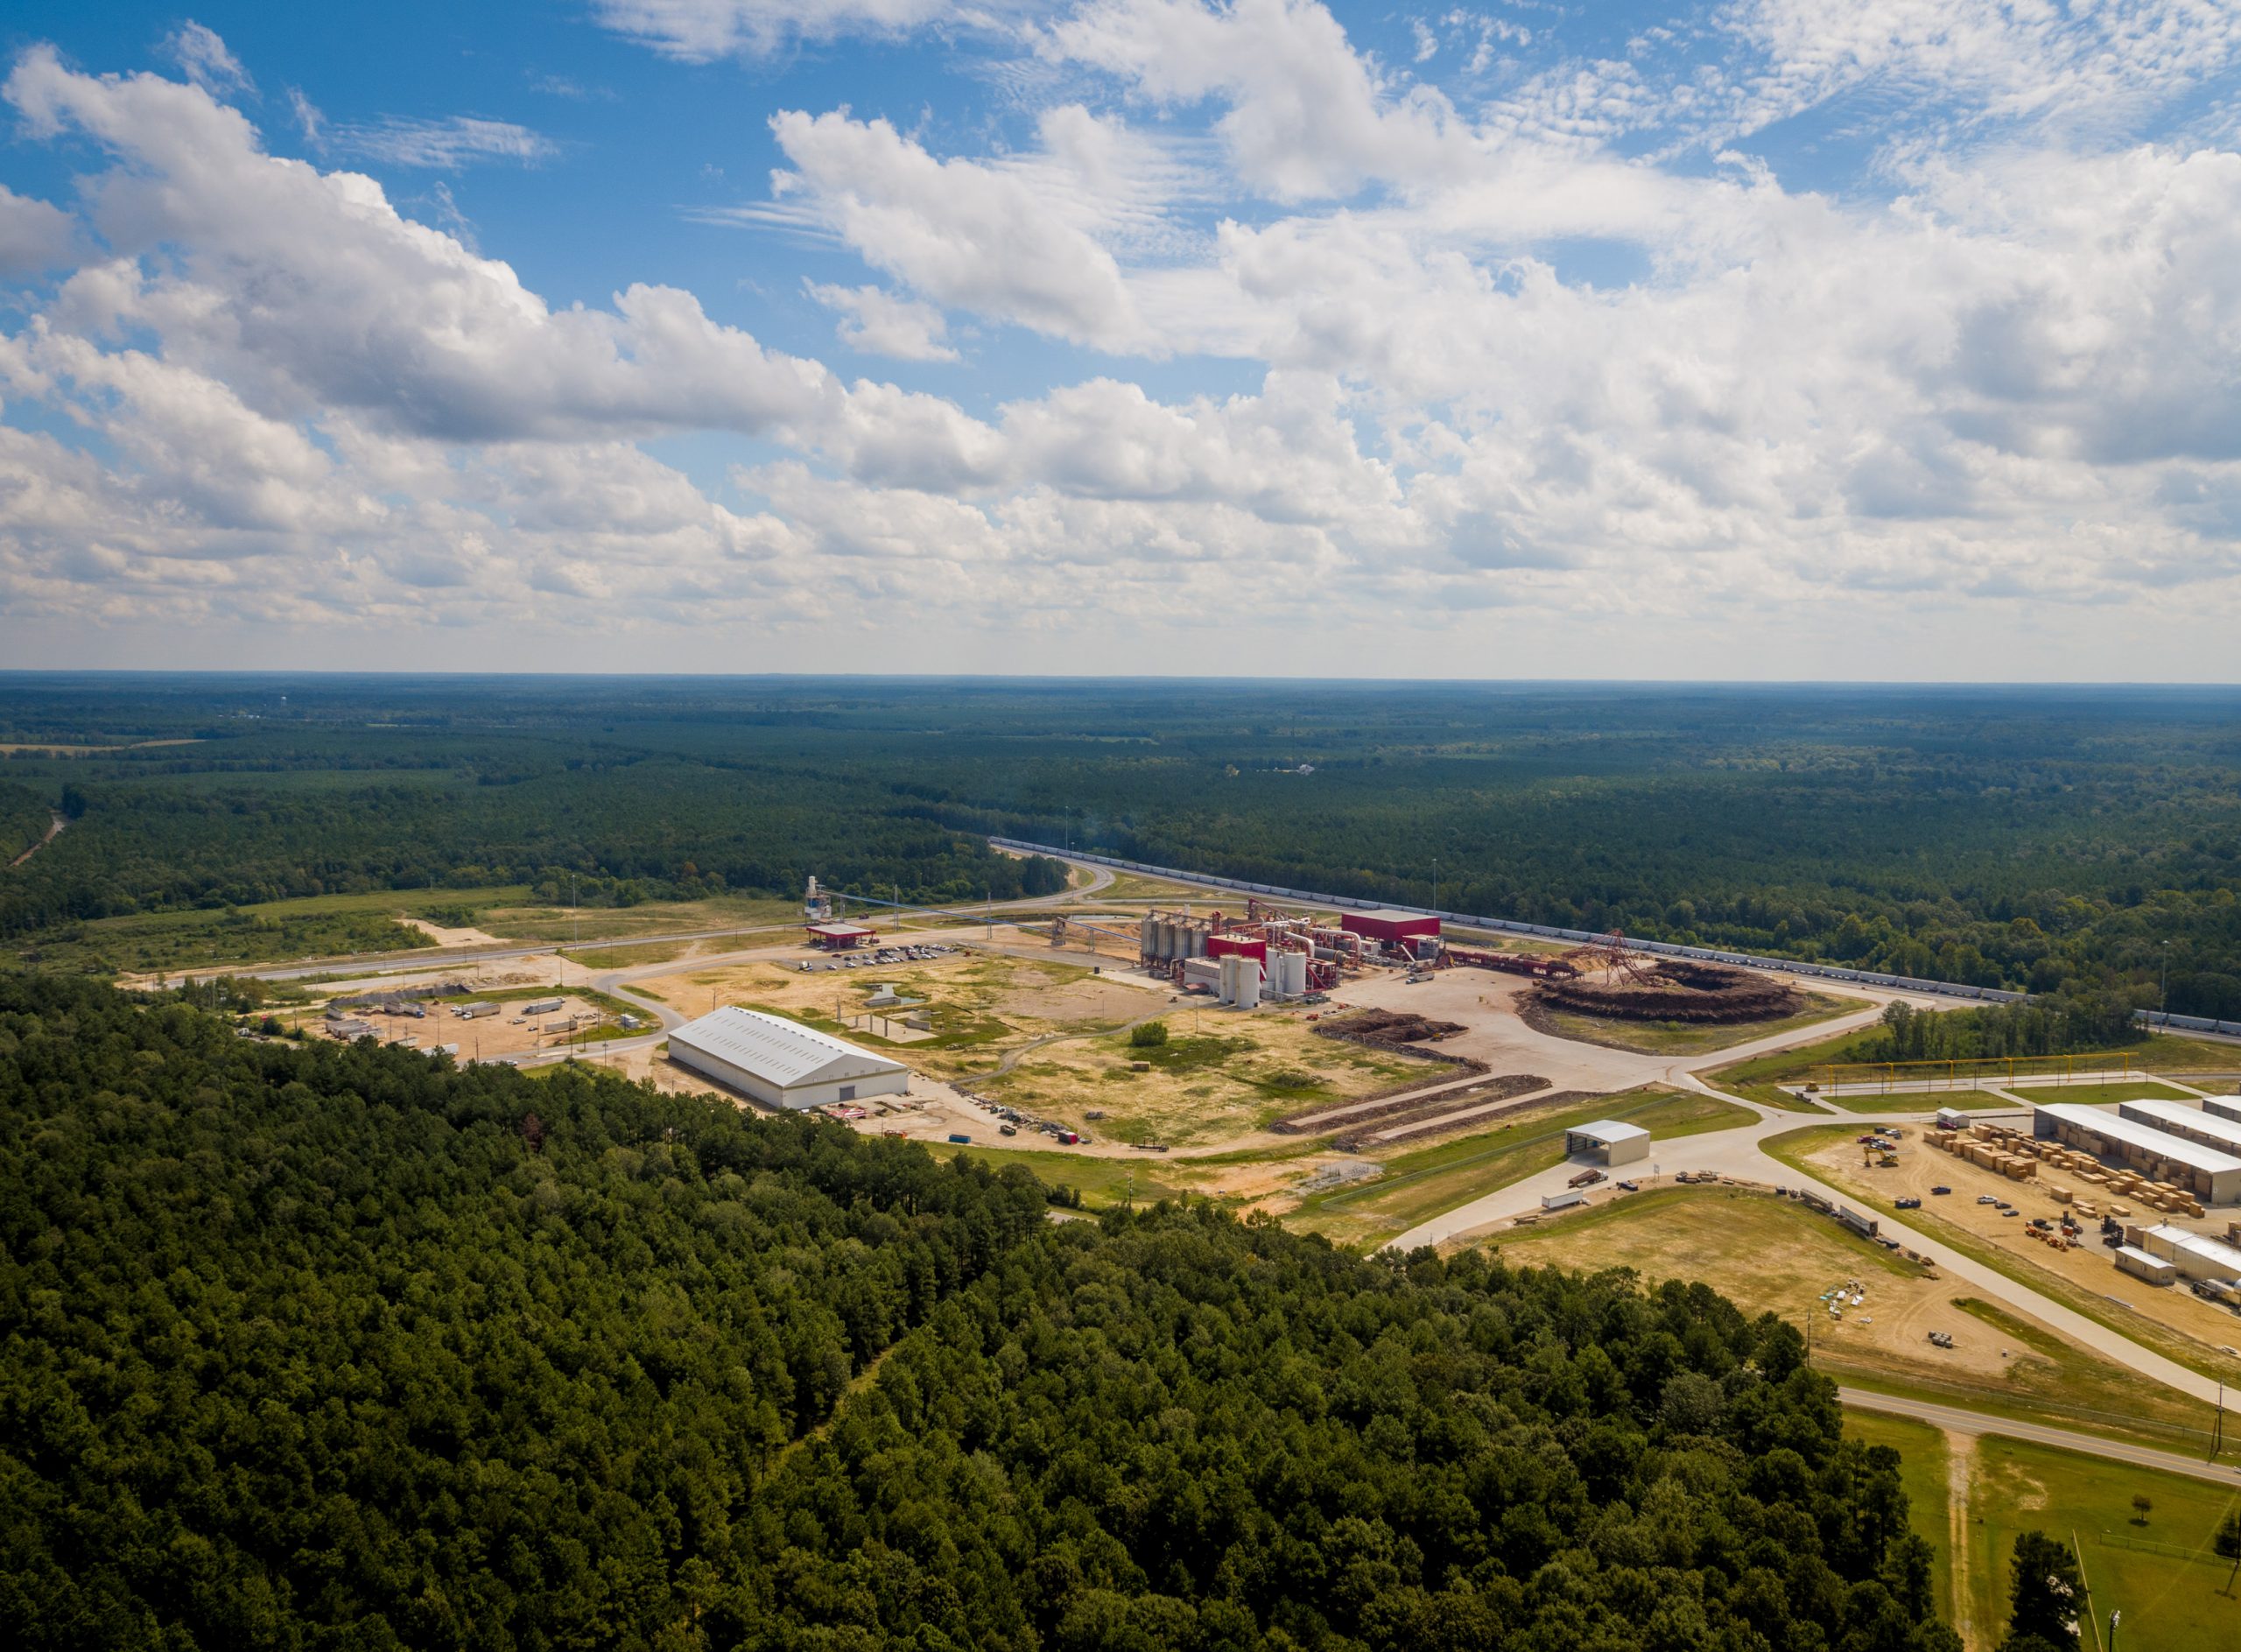
The first of our planned Catchment Area Analysis reports is complete, looking at Amite BioEnergy, our compressed wood pellet manufacturing plant in Mississippi.
The aim of this analysis is to evaluate the trends occurring in the forestry sector around the plant and to determine what impact the pellet mill may have had in influencing those trends, positively or negatively. This includes the impact of increased harvesting levels, changes in carbon stock and sequestration rate, wood prices and the production of all wood products.
Analysis shows a maturing forest resource with a substantial surplus of annual growth; increasing in age and growing stock; increasing production of sawtimber and higher value wood products; stable wood prices and no market displacement.
Key report data
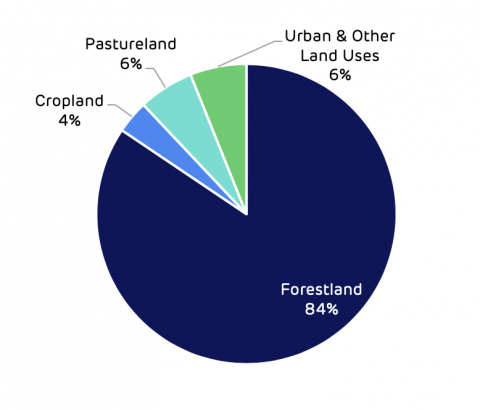
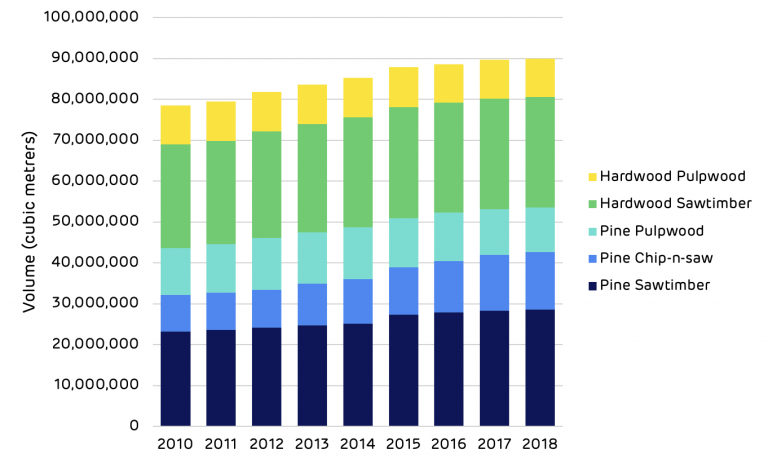
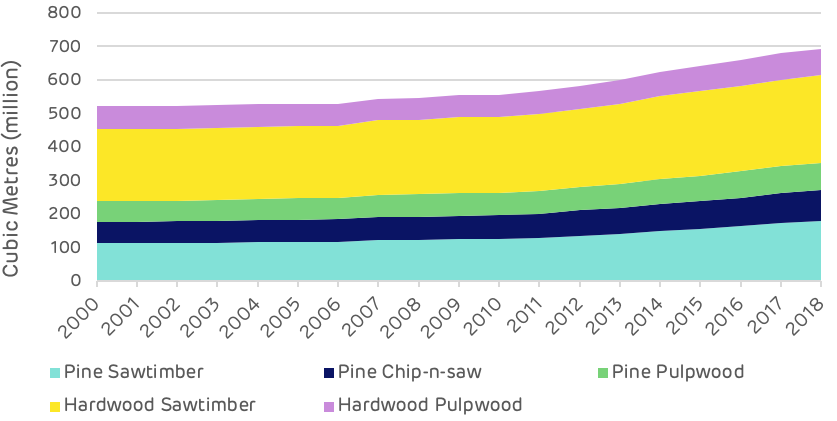
Since 2010 the total growing stock (the amount of wood stored in the forest) around Amite BioEnergy has increased by 11.1 million cubic metres (m3). This is partly due to an increase in the area of Timberland (which increased by more than 5,200 hectares (ha)), but predominantly due to the forest ageing and increasing the average size class (the average tree gets bigger, moving from a small diameter pulpwood tree to a larger sawtimber grade tree).
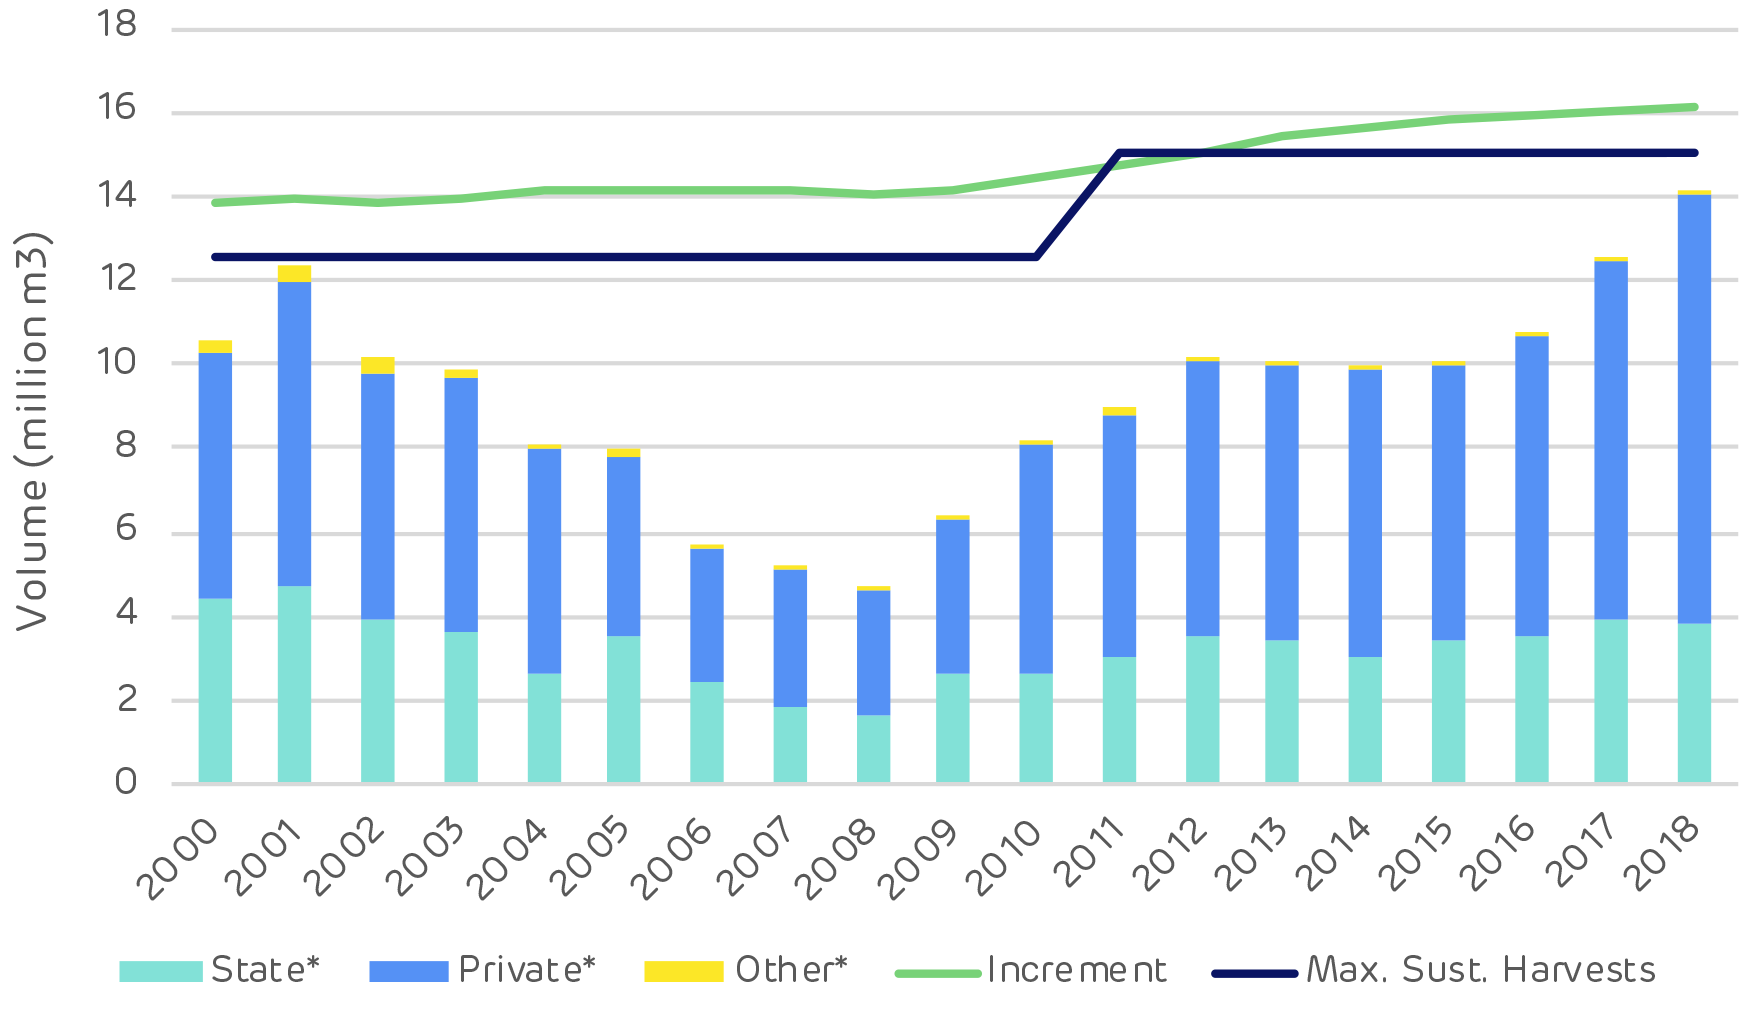
The chart below shows that the increase in volume is entirely within the private sector, where forests are more actively managed. The public sector has declined in growing stock by 1.5 million m3 whilst the private sector has increased by 12.6 million m3. The continual cycle of thinning, harvesting and replanting in the private forests, helps to keep the growing stock increasing.
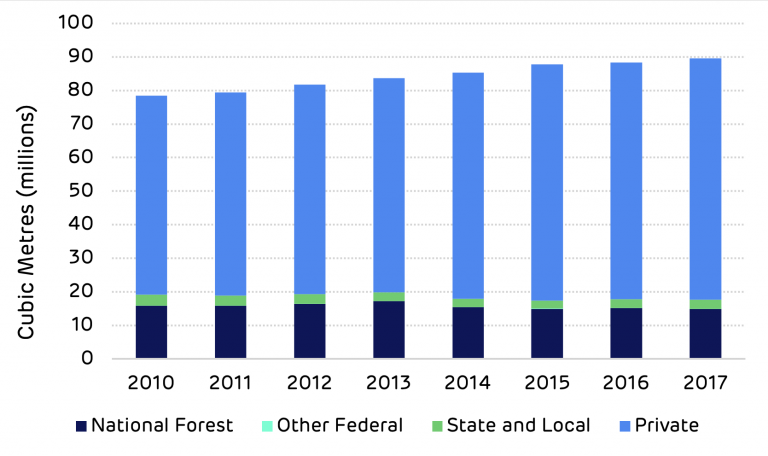
Total growing stock volume on timberland, in cubic meters, by ownership group. Source: US Forest Service – FIA
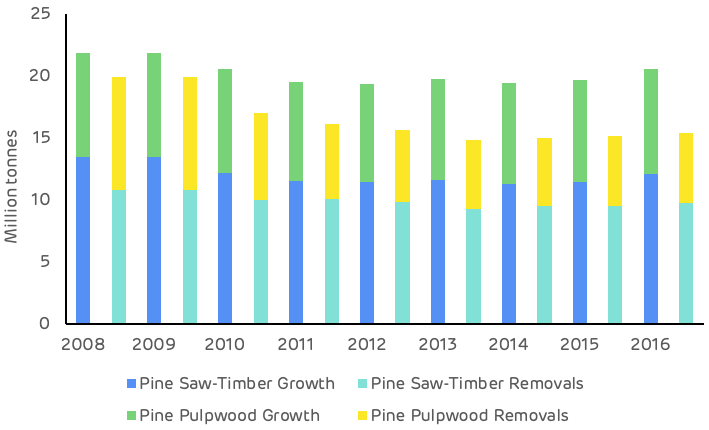
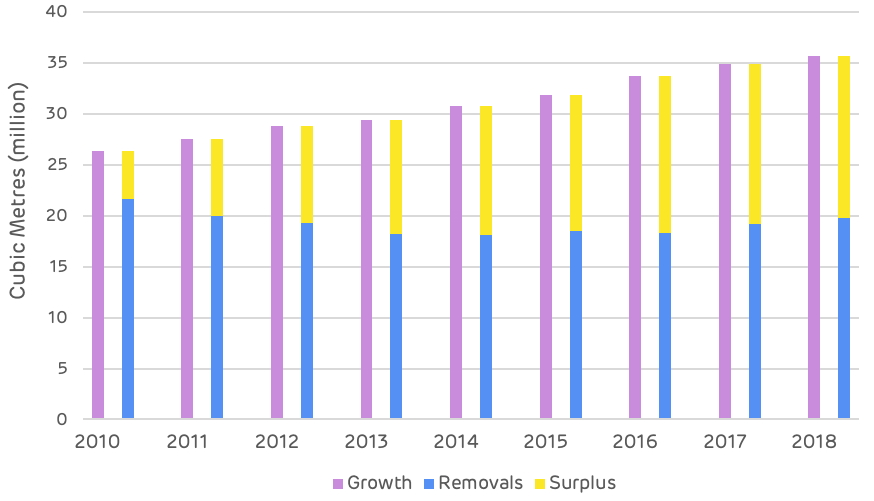
Harvesting in the catchment area has increased, due to the increased demand from the pellet mill, but this is still substantially lower than average annual growth. The average annual surplus of growth compared to harvesting between 2010 and 2017 has been 3.5 million m3 p.a. with a surplus of 2.7 million m3 in 2017.
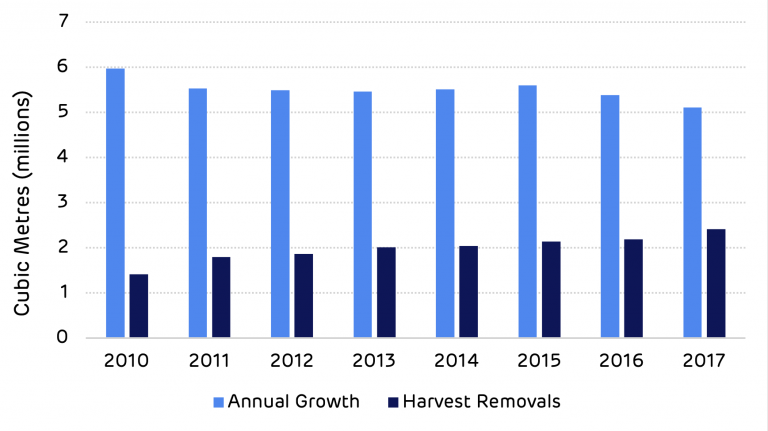
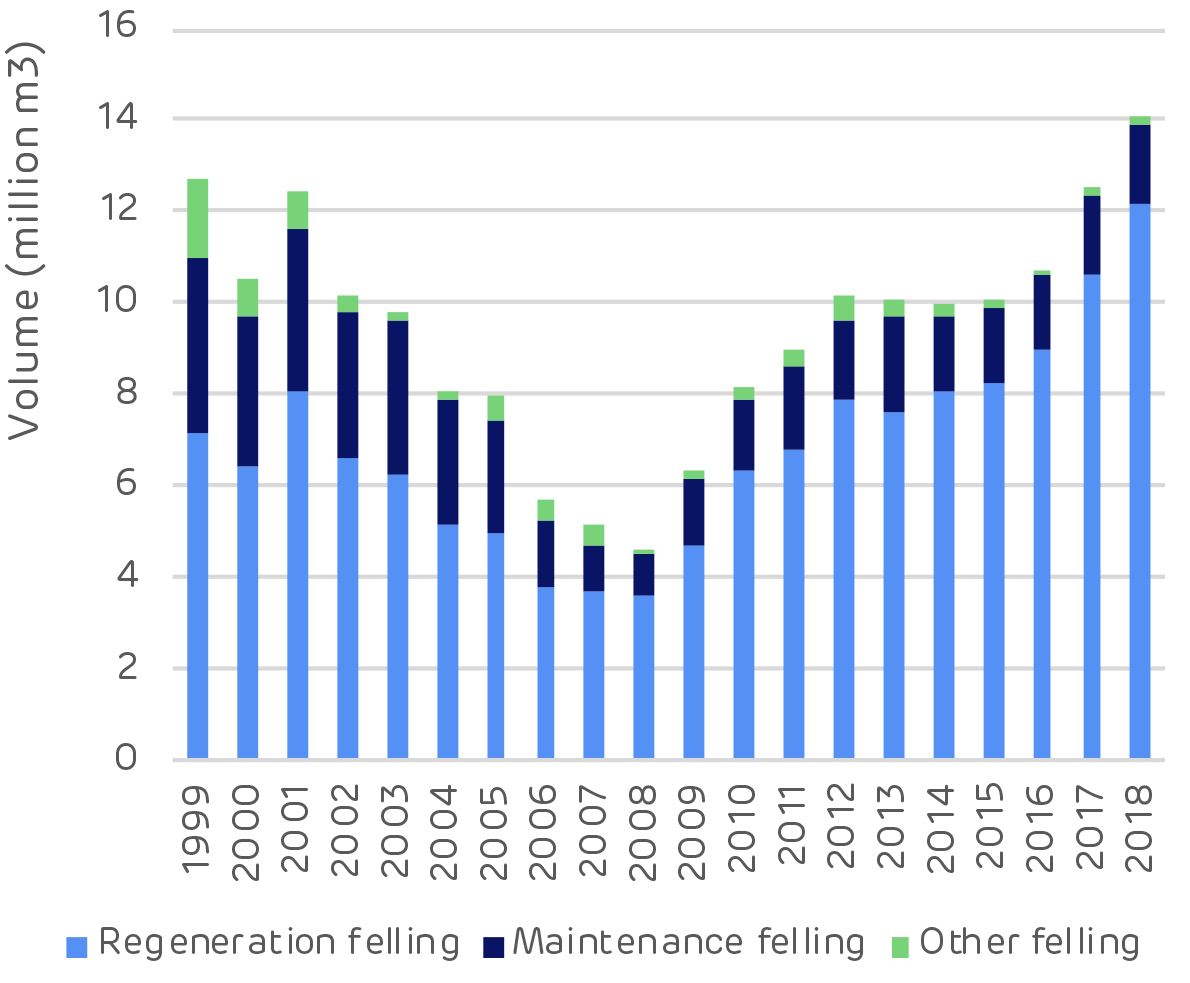
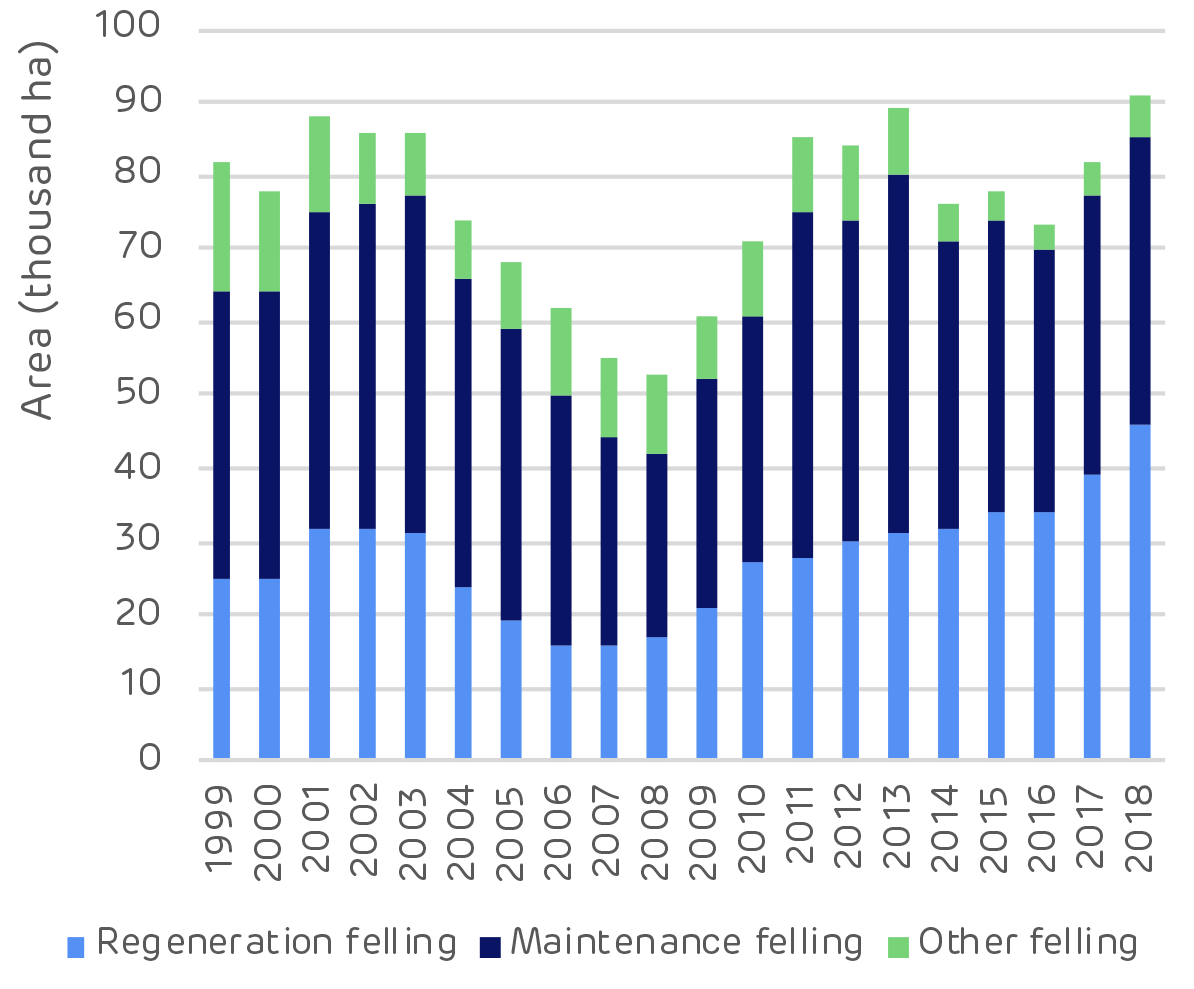
Average annual growth and harvest removals of total growing stock timber, in cubic meters, on timberland – Amite Catchment Area. Source: US Forest Service – FIA
Average annual growth and harvest removals of total growing stock timber, in cubic meters, on timberland – Amite Catchment Area. Source: US Forest Service – FIA
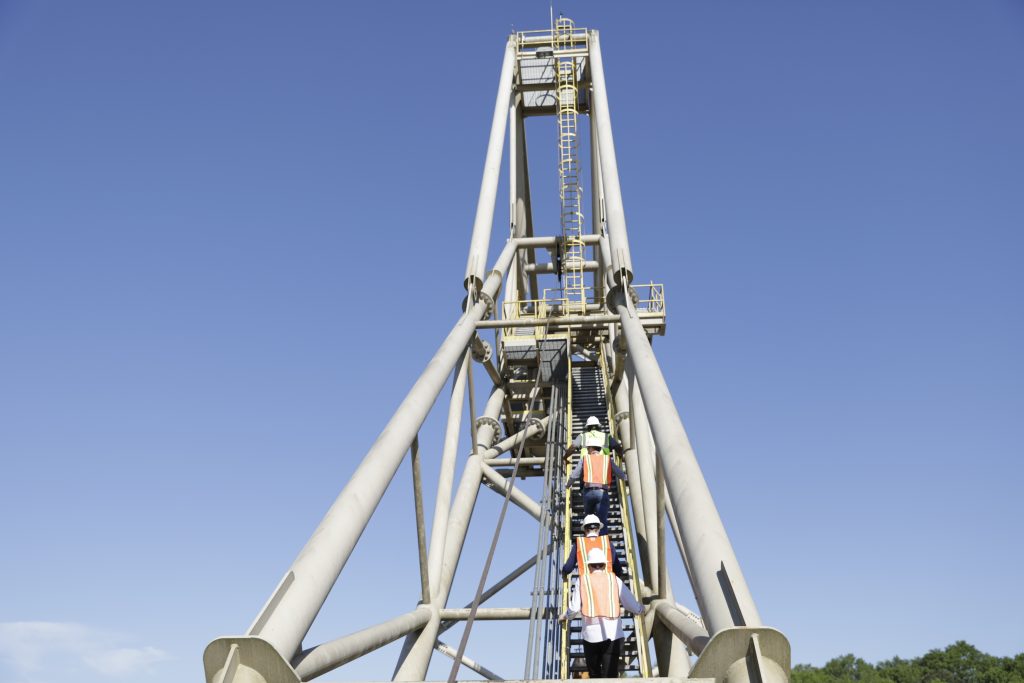
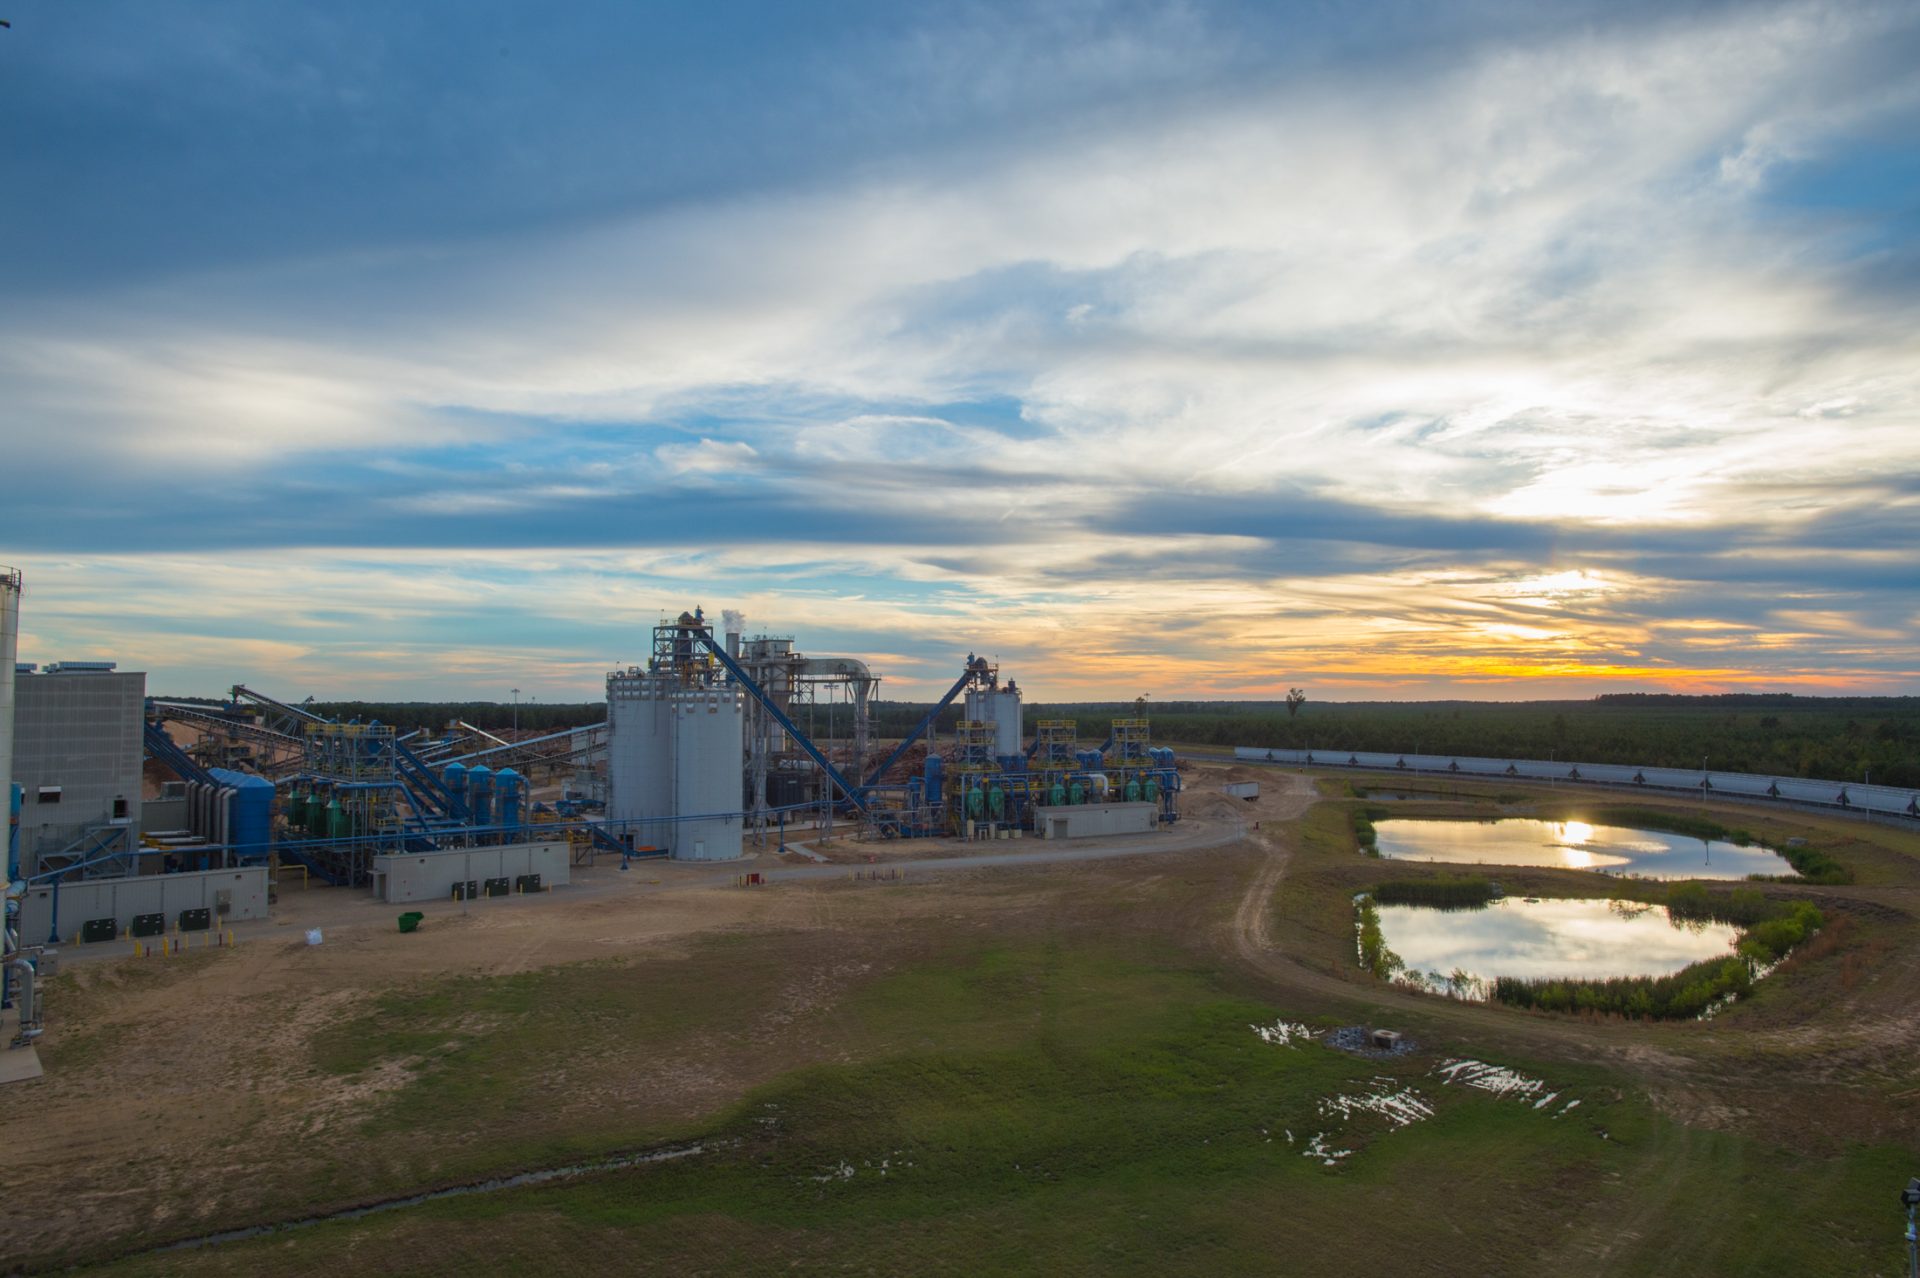
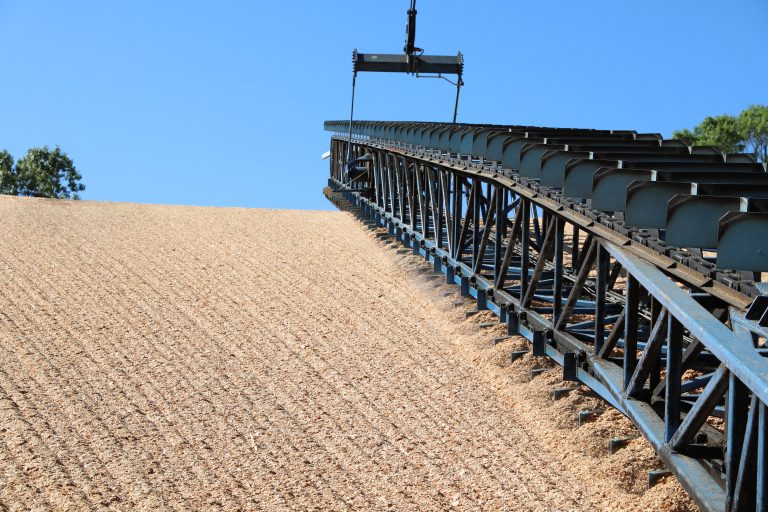
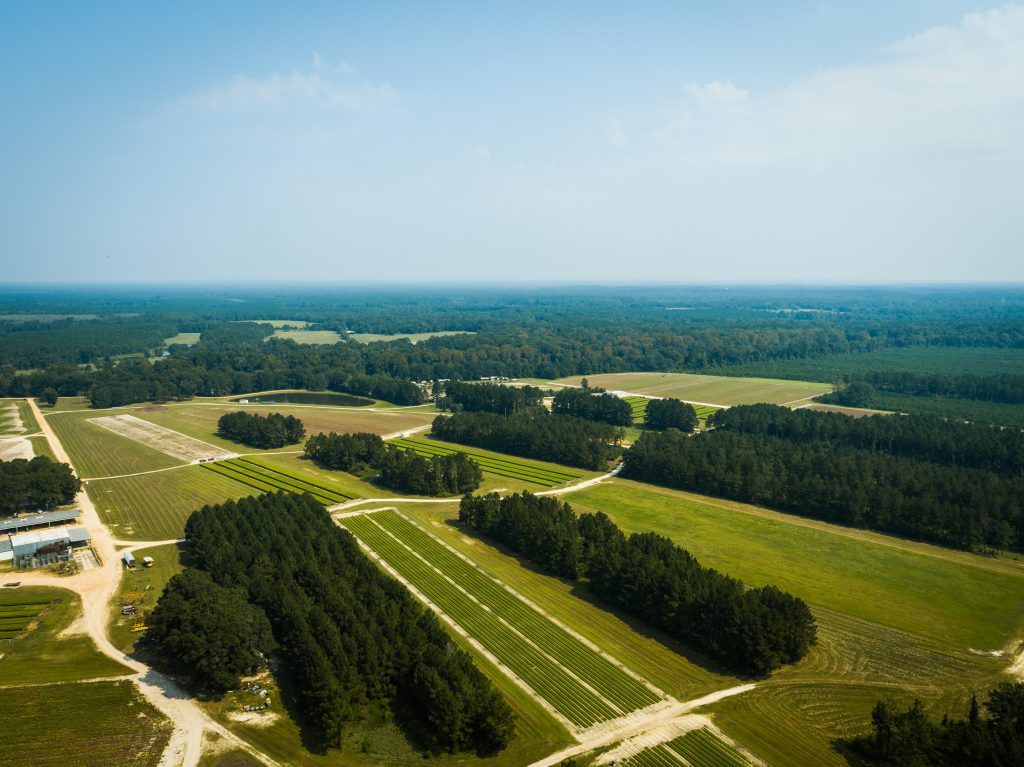
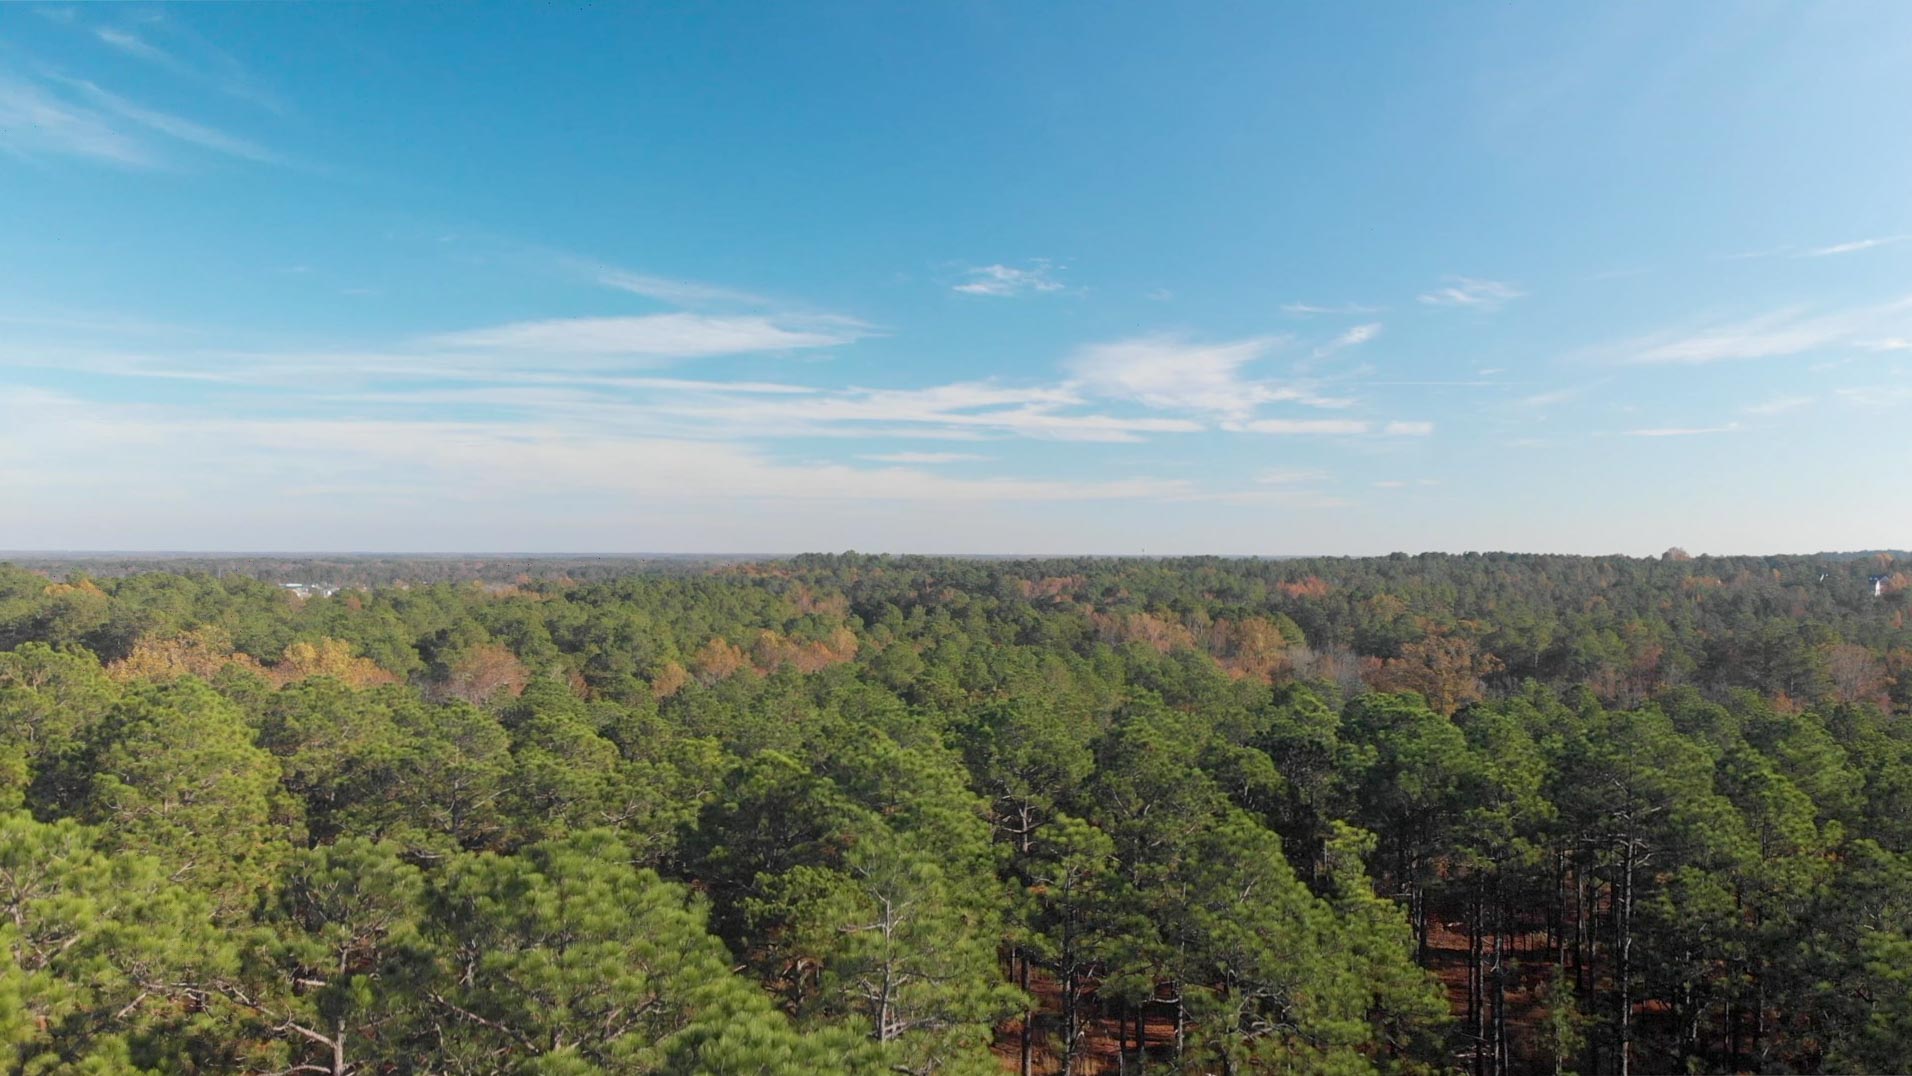
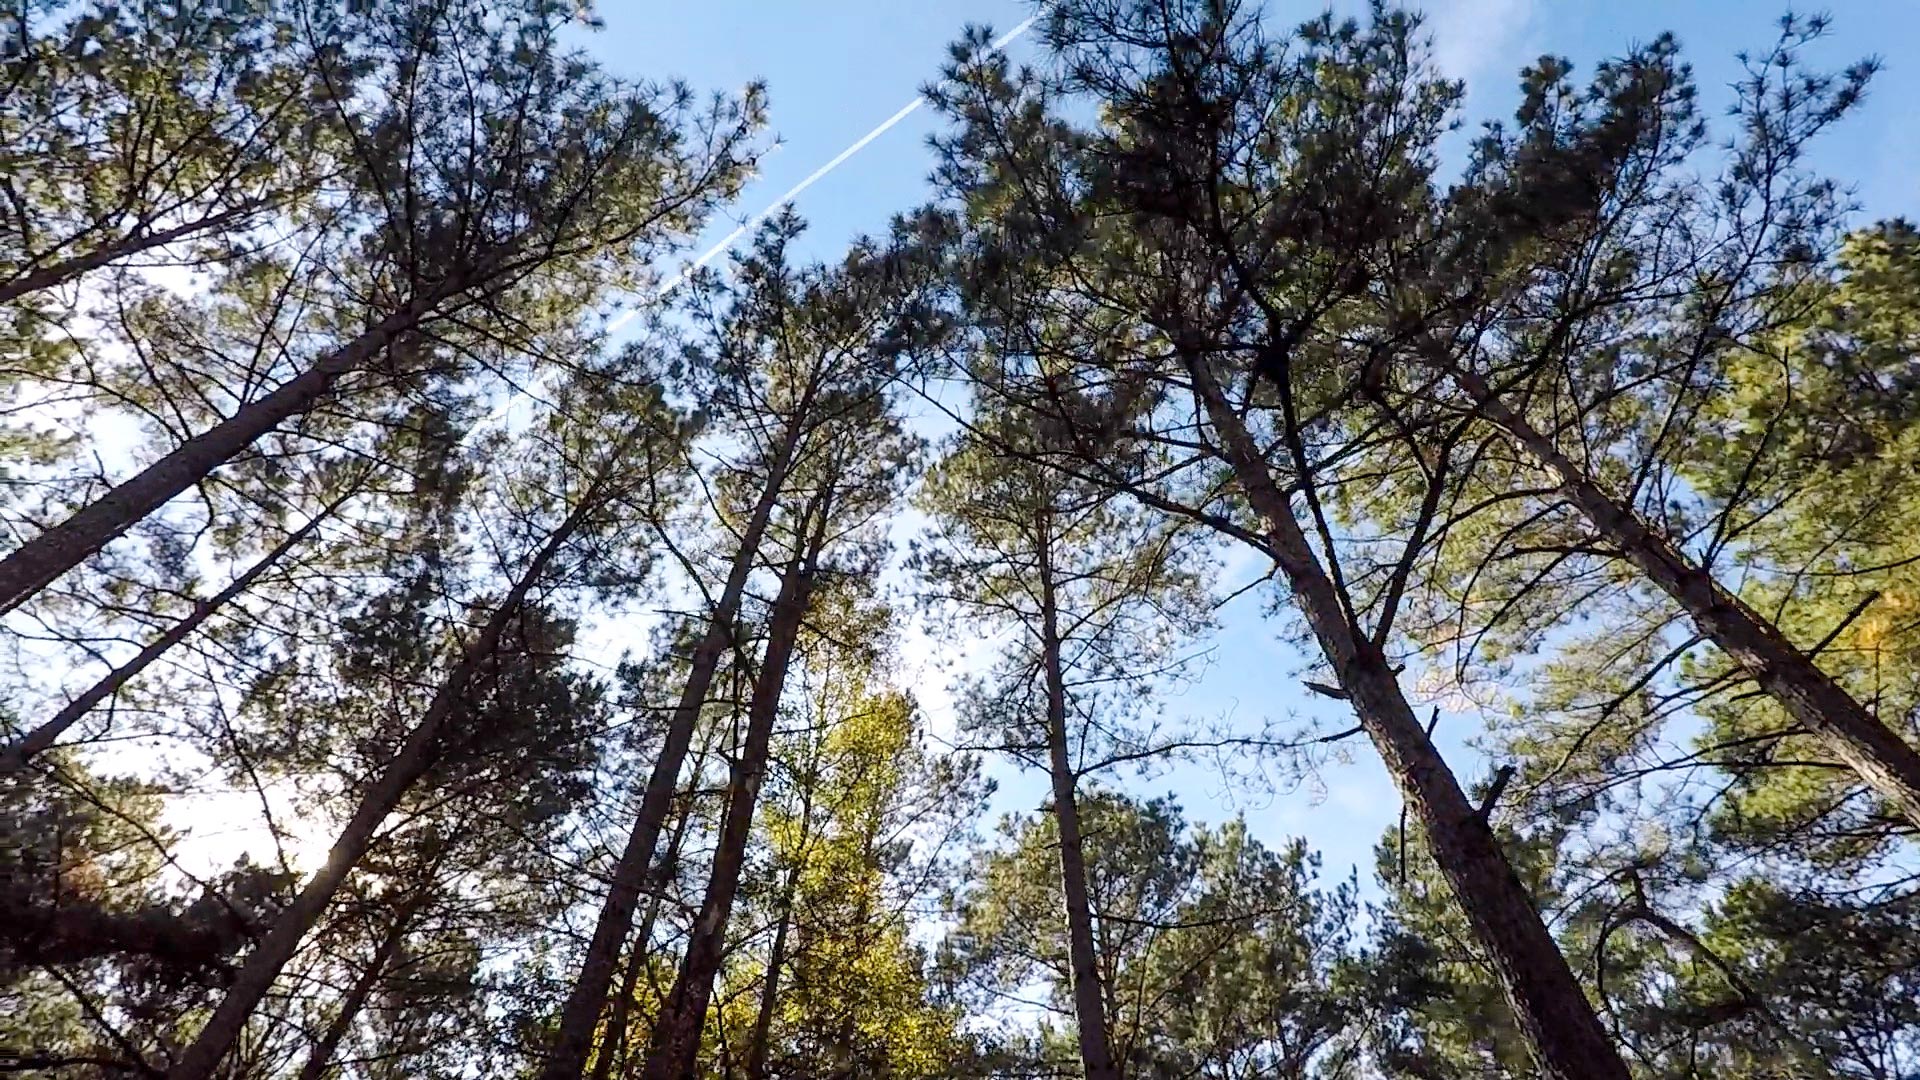
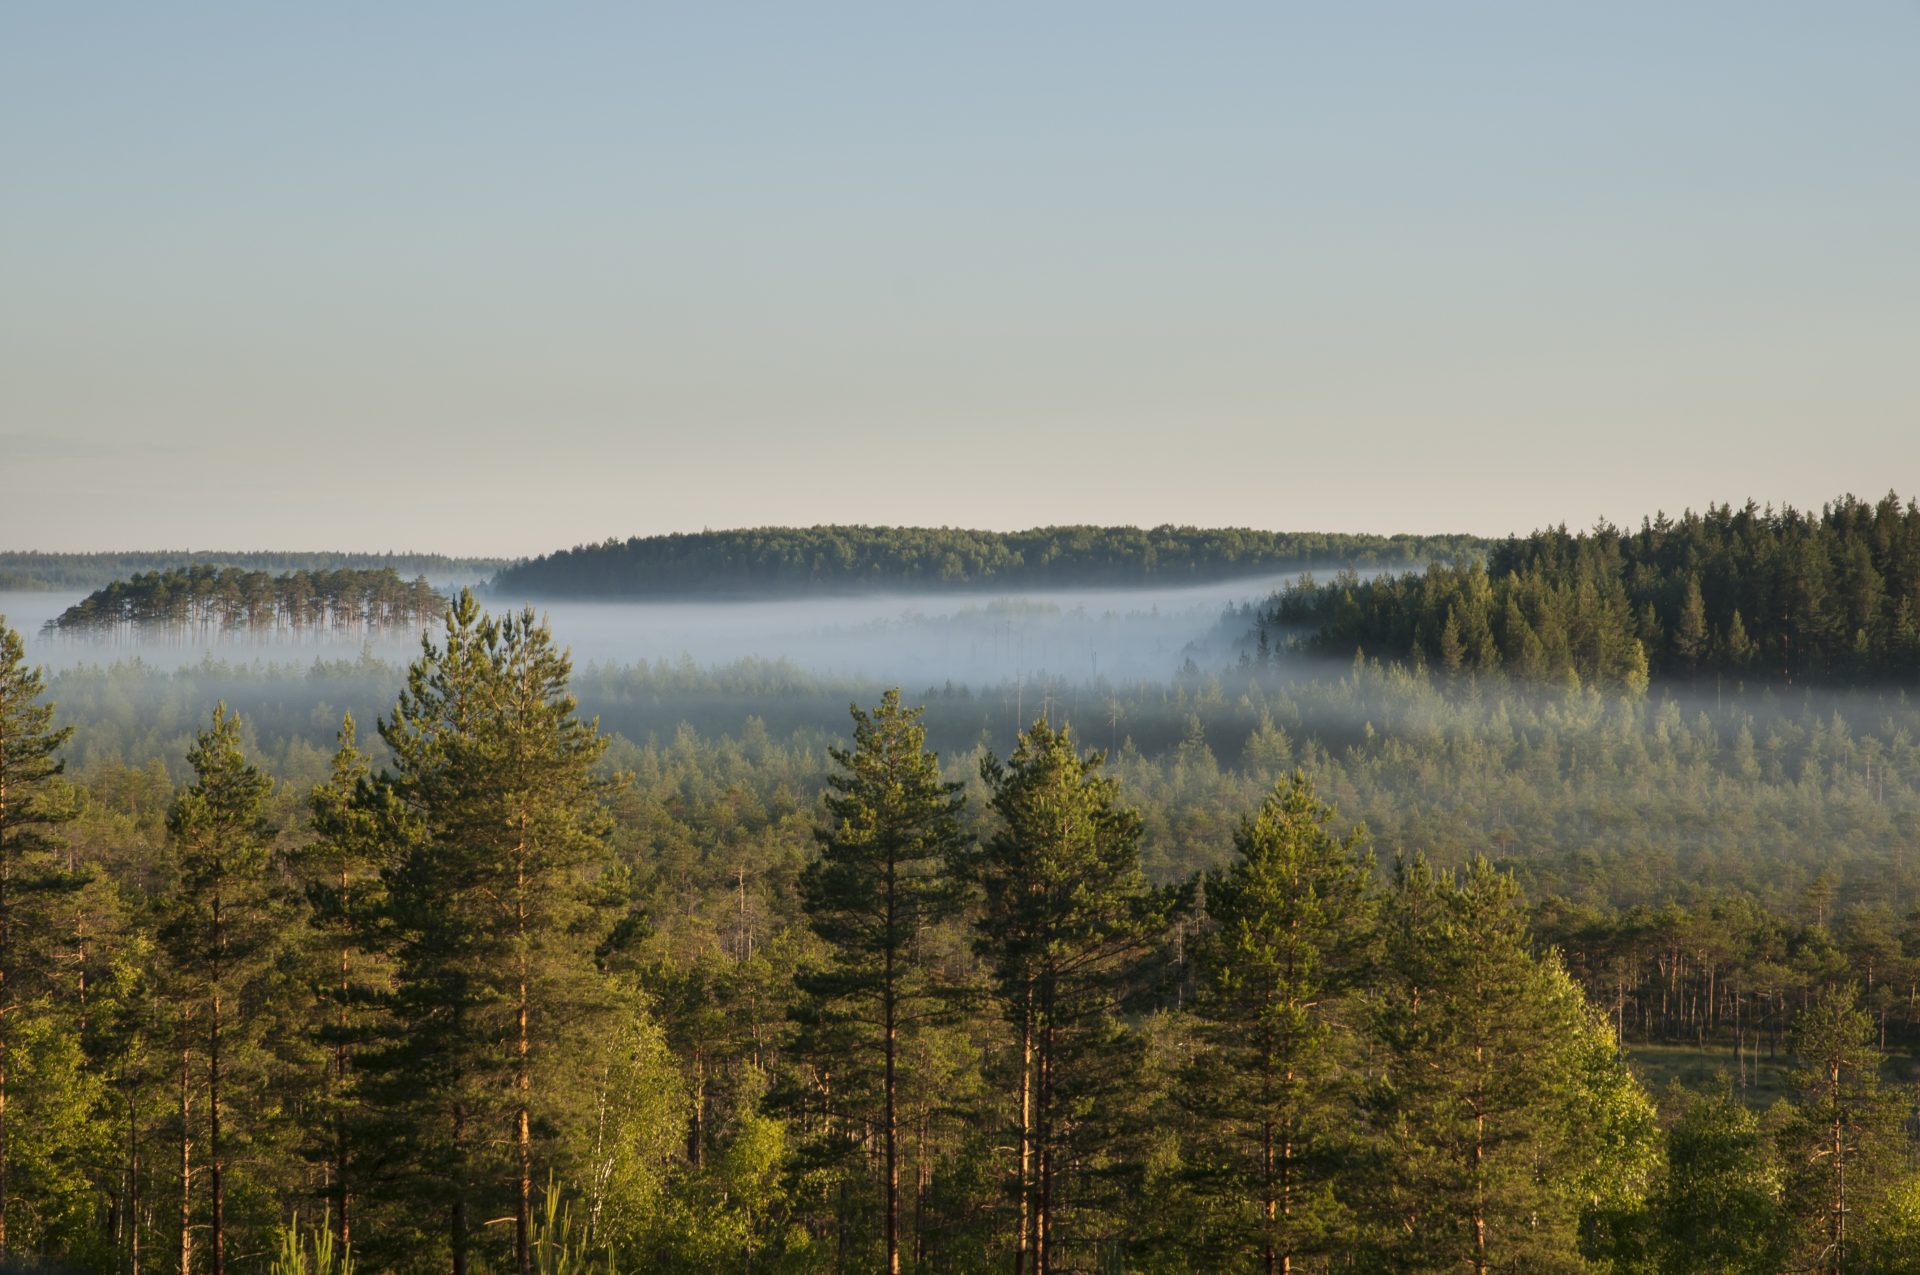
Amite BioEnergy, Mississippi (2017)
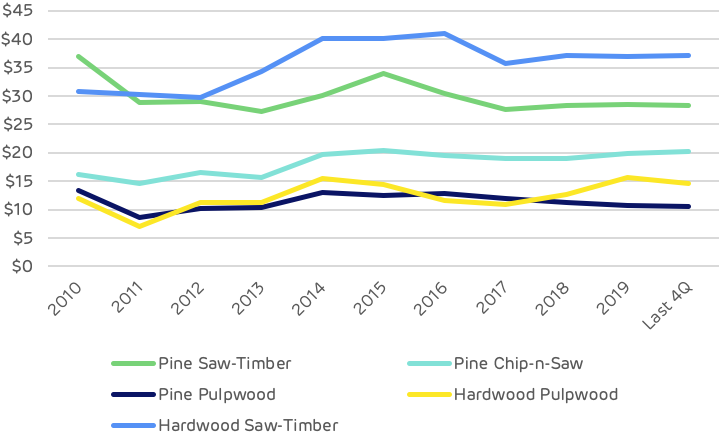
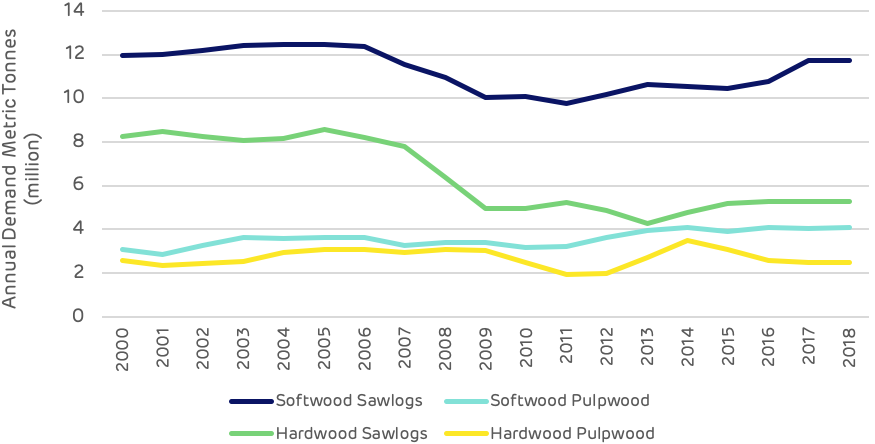
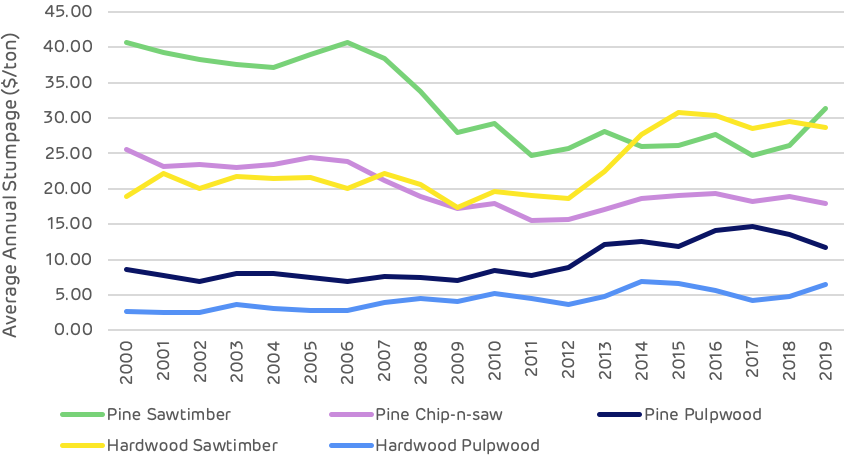
The Catchment Area Analysis also looks at stumpage prices, the revenue paid to forest owners at the time of harvesting, to see if the demand from the pellet mill is having a negative impact (increasing competition and prices for other markets).
The chart below shows that prices are now lower than when the pellet mill began operating. While this may be good for all markets in the area, it is not good for the forest owner.
When considering if trends are good or bad, we must also consider from which perspective we are making the assessment. Increasing prices can be a positive, encouraging owners to plant more trees or to invest more in the management of their forest. Providing that increasing prices do not result in a loss of production in existing markets.
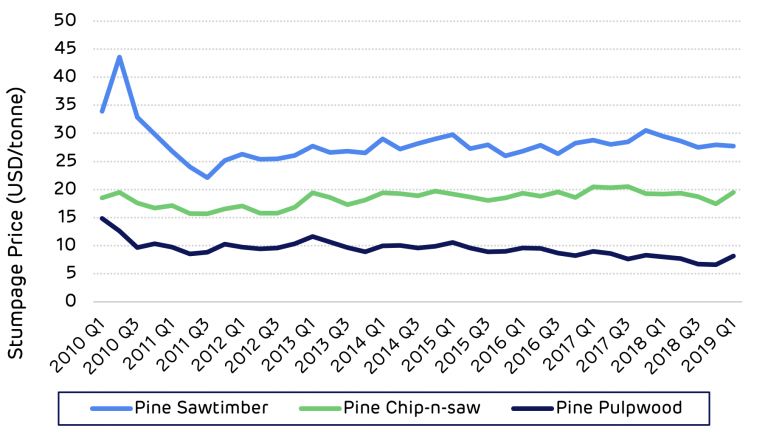
Amite Bioenergy Catchment Area – average stumpage prices ($/metric tonne). Source: Timber Mart-South
An important part of this analysis is to look for evidence to evaluate Drax’s performance against its new forest commitments, some of which relate directly to these trends and data sets.
Hood Consulting – the authors of Catchment Area Analysis of Forest Management and Market Trends: Amite BioEnergy – has looked at the impact of Amite BioEnergy on its supply basin.
The scope of the analysis had to be objective and impartial, using only credible data sources and references. However, in order to address some of the key issues and draw some conclusions, the consultants used their extensive experience and local knowledge in addition to the data trends.
A summary of their findings is detailed below.
Summary of key questions addressed in the analysis:
Is there any evidence that bioenergy demand has caused …?
Deforestation?
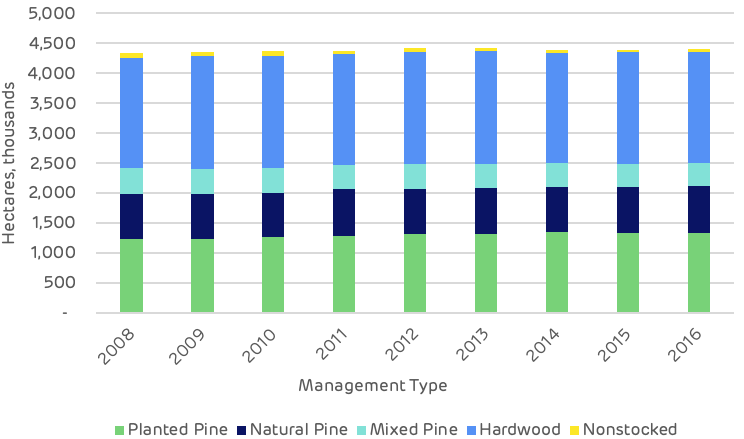
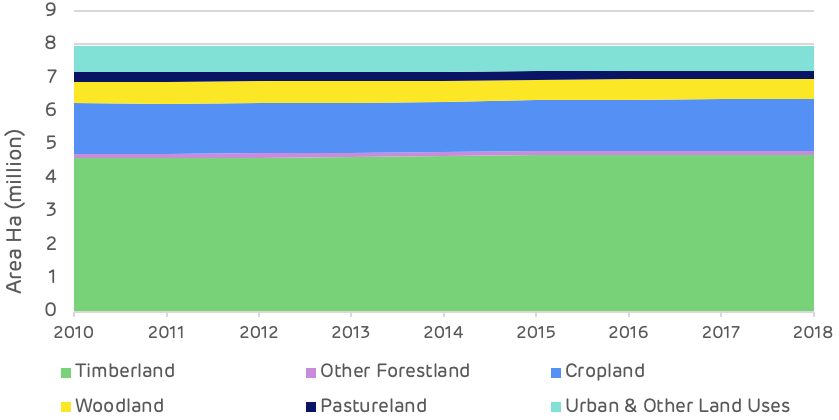
No. US Forest Service data shows that the total timberland area has increased by more than 5,200 ha.
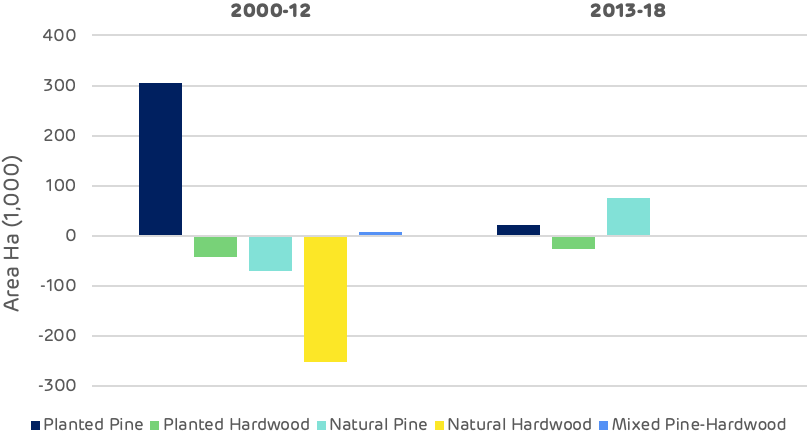
A change in management practices (rotation lengths, thinnings, conversion from hardwood to pine)?
No / inconclusive. Changes in management practices have occurred in the catchment area over the last five to 10 years, but there is little evidence to suggest bioenergy demand has caused these changes. Market research shows thinnings have declined in this catchment area since 2014 (when Amite BioEnergy commenced production). However, local loggers identify poor market conditions for the decrease in thinnings, not increased bioenergy demand.
The primary focus of timber management in this area is the production of sawtimber. Rotation lengths of managed forests have remained unchanged (between 25-35 years of age) despite increases in bioenergy demand. Increased bioenergy demand, however, has benefited landowners in this catchment area, providing additional outlets for pulpwood removed from thinnings – a management activity necessary for sawtimber production.
Diversion from other markets?
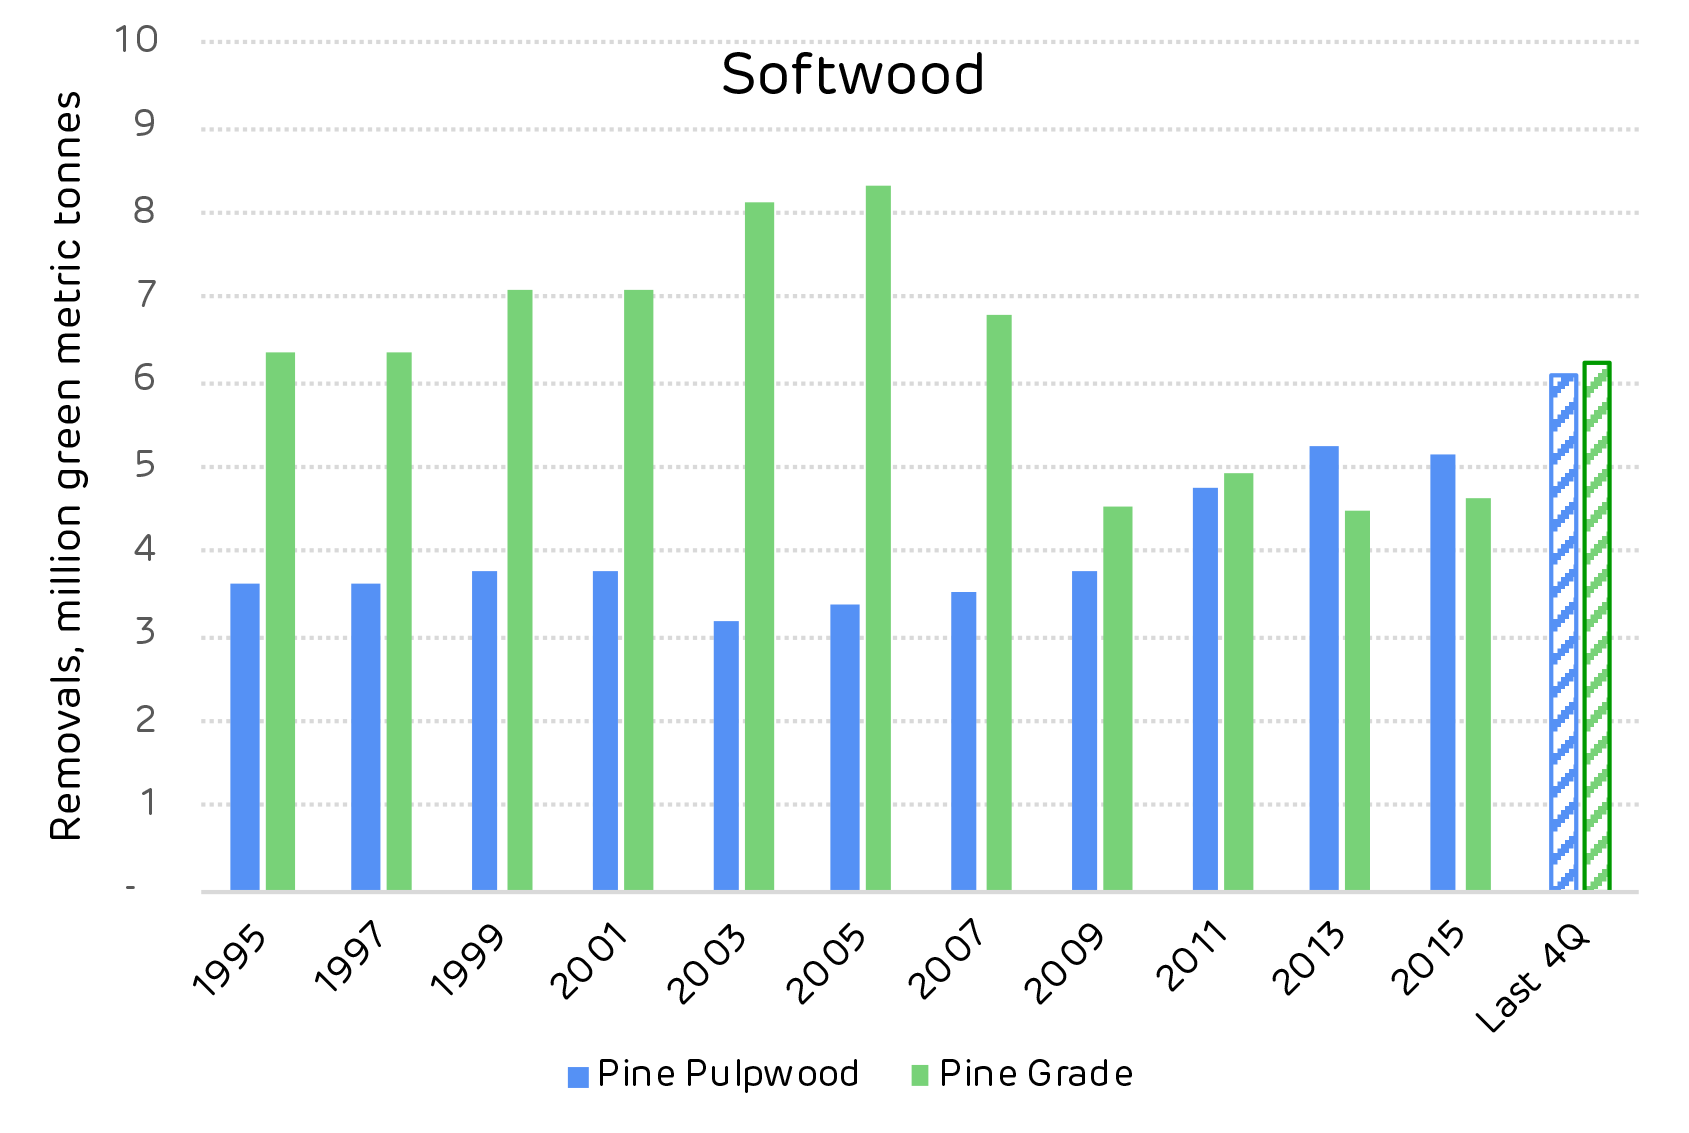
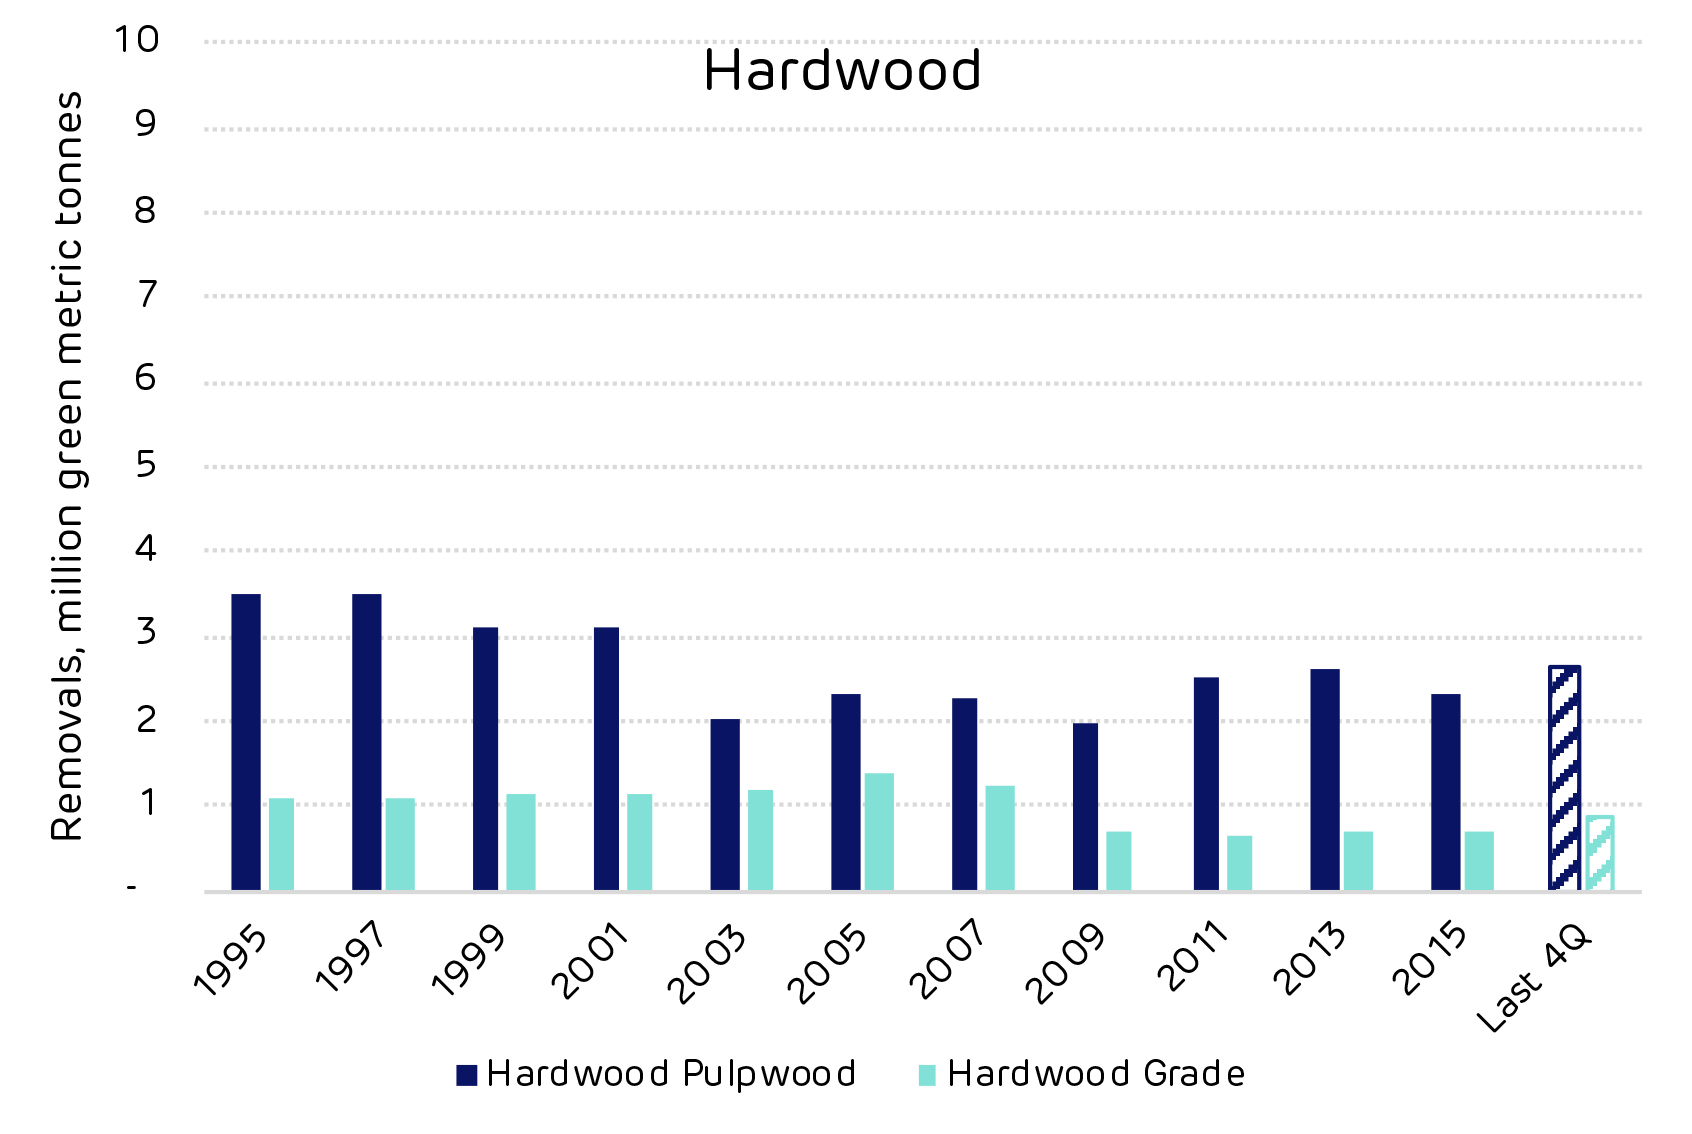
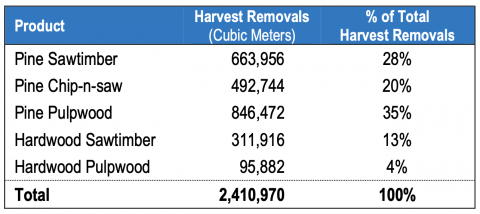
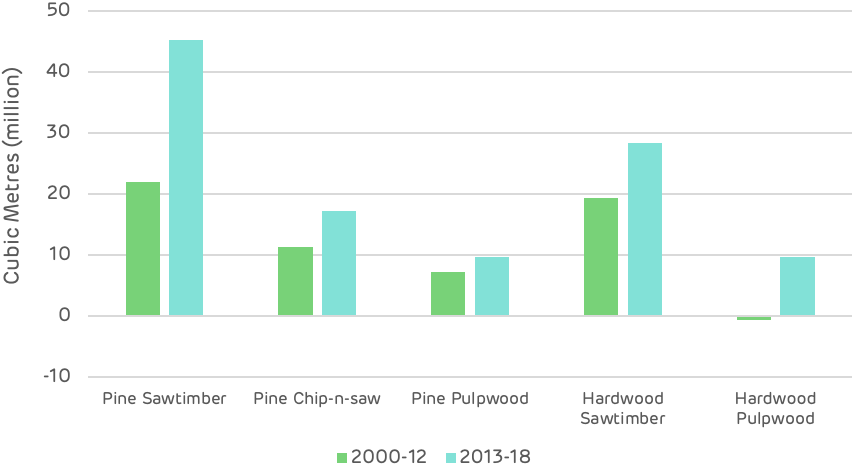
No. Since 2014, softwood pulpwood demand not attributed to bioEnergy has increased 8% while demand for softwood sawtimber and hardwood pulpwood has increased 53% and 5%, respectively.
An abnormal increase in wood prices?
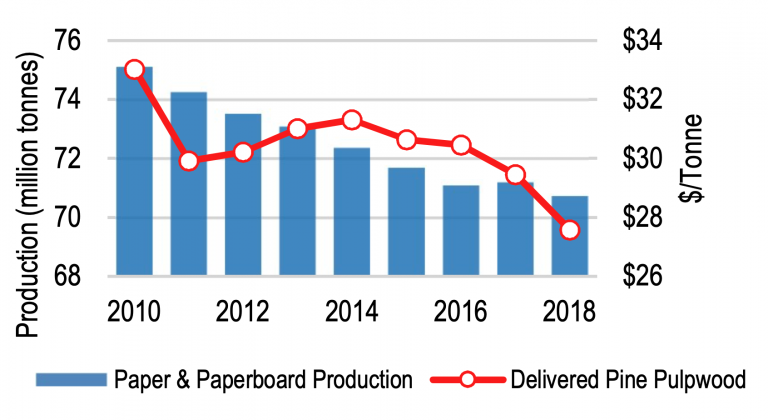
No. Prices for delivered pine pulpwood (the primary raw material consumed by Amite BioEnergy) have decreased 12% since the pellet mill commenced production in 2014.
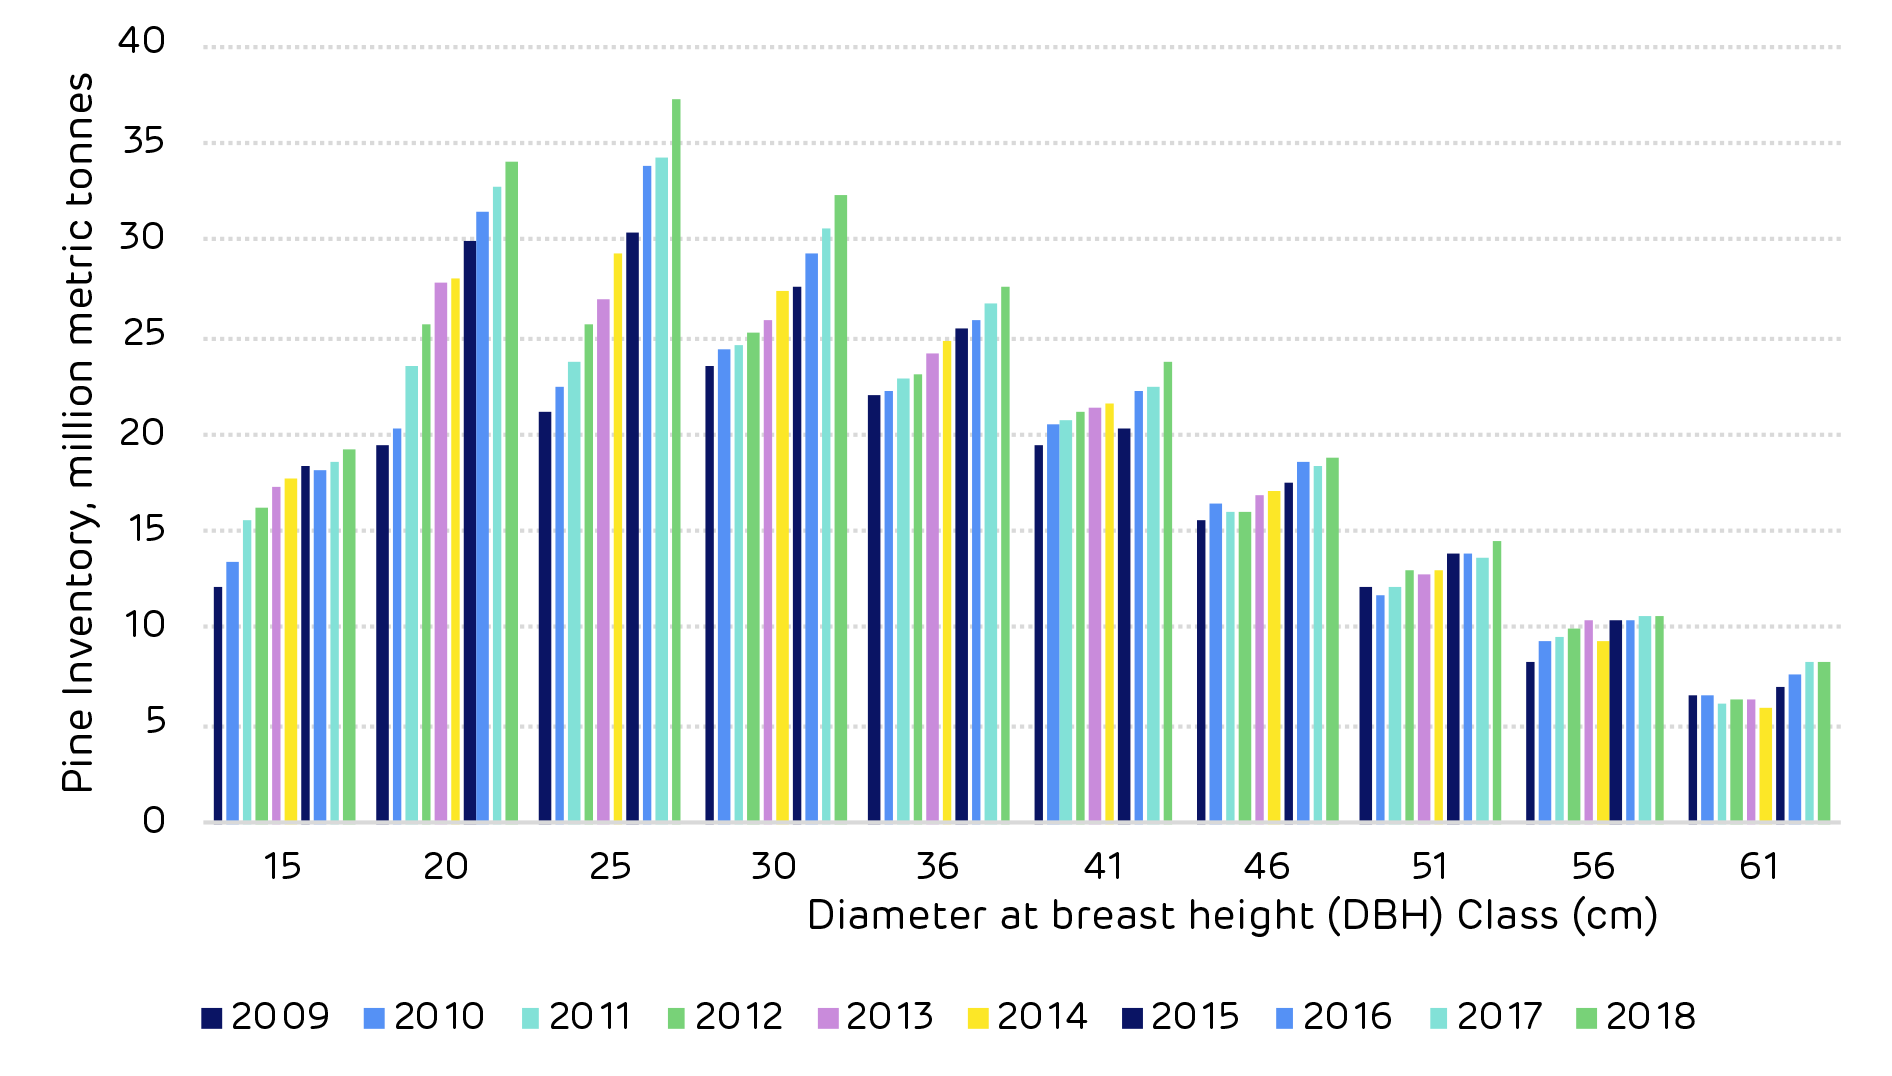
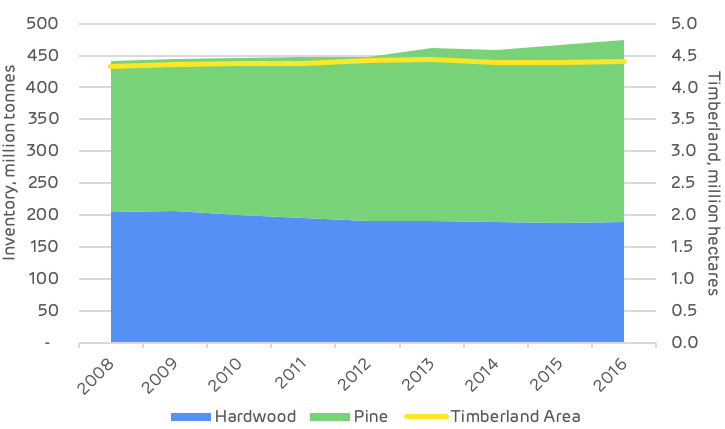
A reduction in growing stock timber?
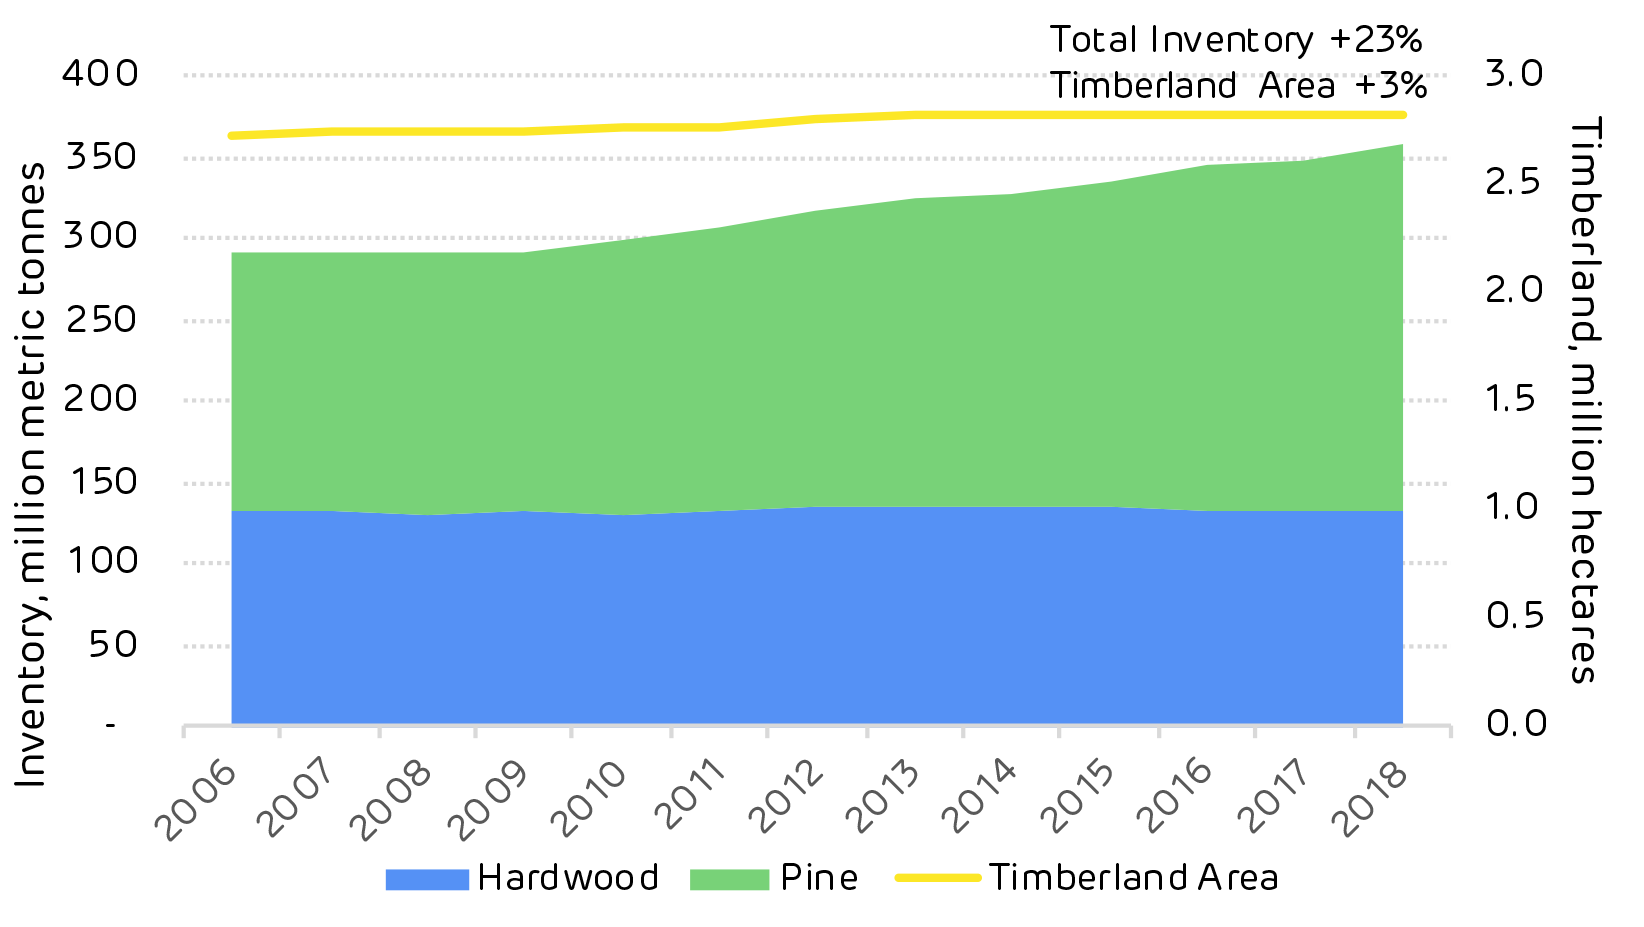
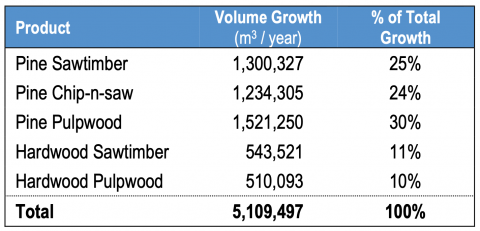
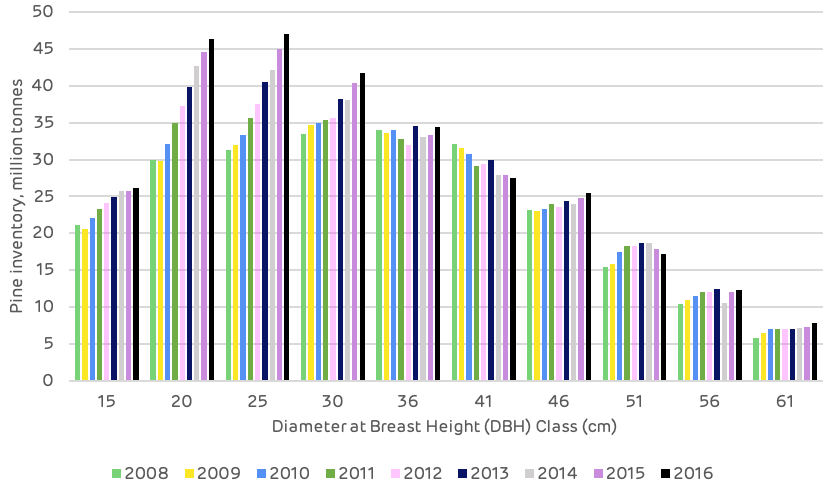
No / inconclusive. Total growing stock inventory in the catchment area increased 5% from 2014 through 2017 (the latest available data). Specifically, pine sawtimber inventory increased 13%, pine chip-n-saw inventory increased 24%, and pine pulpwood inventory decreased 12% over this period. This is indicative of an aging forest.
A reduction in the sequestration rate of carbon?
No. US Forest Service data shows the average annual growth rate of growing stock timber has decreased slightly since 2014, and a slower timber growth rate essentially represents a reduction in the sequestration rate of carbon. However, the reduced growth rate and subsequent reduction in the sequestration rate of carbon is due to the aging of the forest (changes in timber age class distribution), not to increases in bioenergy demand. As trees get older the growth rate slows down.
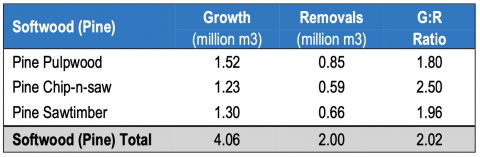
An increase in harvesting above the sustainable yield capacity of the forest area?
No. Growth-to-removals ratios, which compare annual timber growth to annual harvests, provides a measure of market demand relative to supply as well as a gauge of market sustainability. In 2017, the latest available, the growth-to-removals ratio for pine pulpwood equalled 1.80 (a value greater than 1.0 indicates sustainable harvest levels). Even with the increased harvesting required to satisfy bioenergy demand, harvest levels remain well below the sustainable yield capacity of the catchment forest area.
Evaluate the impact of bioenergy demand (positive, neutral, negative) on …
Timber growing stock inventory
Neutral. Total wood demand (from biomass and other solid wood products) is up more than 35% compared to 2014 levels. Intuitively, increased demand means more timber is harvested, which reduces total growing stock inventory. However, in this catchment area, inventories are so substantial
that increases in demand from bioenergy, as well as from other sources, have not been great enough to offset annual timber growth, and, as such, total growing stock inventory has continued to increase – an average of 2% per year since 2014 (when Amite BioEnergy commenced production).
Timber growth rates
Neutral. Timber growth rates have declined since 2014; however, evidence suggests the reduction in growth rates is more a product of an aging forest and not due to changes in bioenergy demand.
Additionally, young planted pine stands are actually growing at a faster rate than ever before – due to the continued improvement of seedling genetics. And, as timber is harvested and these stands are replanted in pine (as has historically occurred in the catchment area), over the long term, the average timber growth rate is likely to increase.
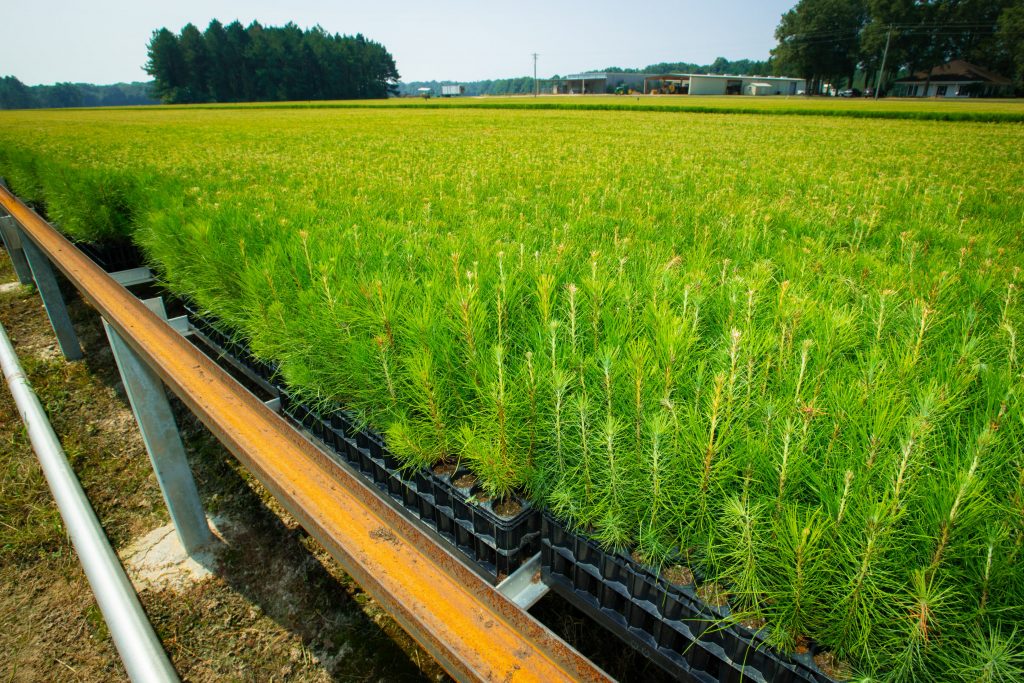
Weyerhaeuser Nursery Hazlehurst Mississippi
Forest area
Positive / neutral. Total forest (timberland) area in the catchment area increased more than 5,200 ha from 2014 through 2017, the latest available. And while our analysis of biomass demand and forest area found a moderately strong relationship between the two, findings are inconclusive as to whether the increase in timberland acreage can be attributed to increases in biomass demand.
Wood Prices
Neutral. Despite the additional wood demand placed on this market by Amite BioEnergy, since 2014, prices for delivered pine pulpwood (the primary raw material consumed by Amite BioEnergy) have decreased 12% in the catchment area. Prices for pine sawmill residuals and in-woods chips (the other two raw materials consumed by Amite BioEnergy) have also declined over the last several years – down 3% since 2016 for pine sawmill residuals and down 3% since 2015 for in-woods chips.
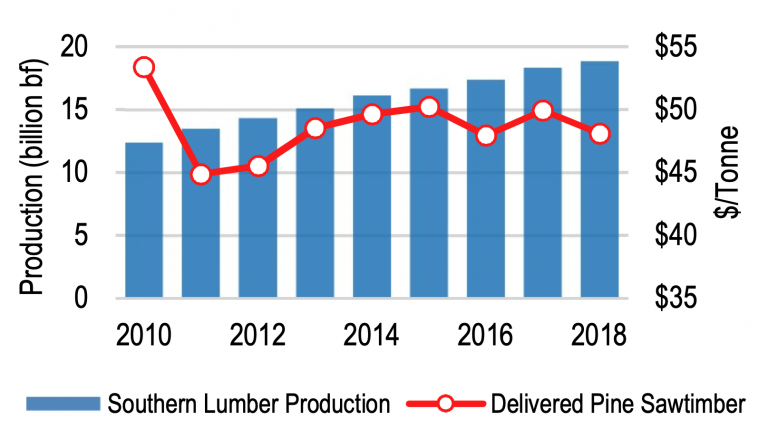
Markets for solid wood products
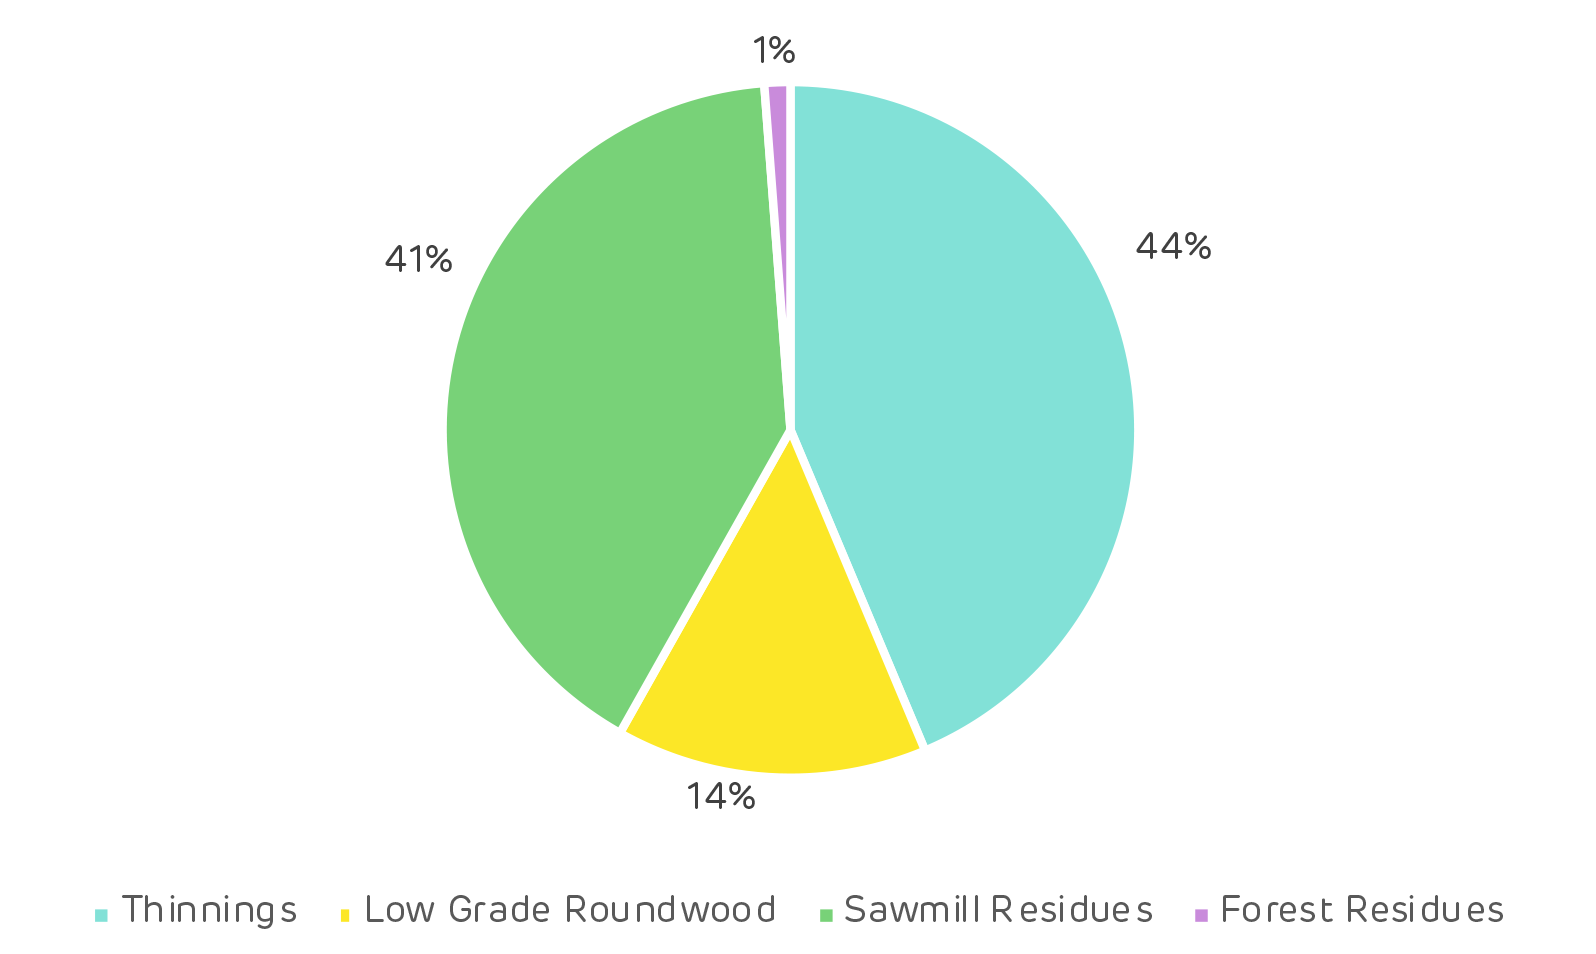
Positive / neutral. In the Amite BioEnergy catchment area, demand for softwood sawtimber to produce lumber has increased more than 50% since 2014. A biproduct of the sawmilling process is sawmill residuals – a material utilized by Amite BioEnergy to produce wood pellets. Not only has Amite BioEnergy benefited from the greater availability of this biproduct, but lumber producers have also benefited, as Amite BioEnergy has provided an additional outlet for these biproducts.
Read the full report: Catchment Area Analysis of Forest Management and Market Trends: Amite BioEnergy (UK metric version). An interview with the author, Dr Harrison Hood, Forest Economist and Principal at Hood Consulting, can be read here. Explore every delivery of wood to Amite BioEnergy using our ForestScope data transparency tool. This is part of a series of catchment area analyses around the forest biomass pellet plants supplying Drax Power Station with renewable fuel. Others in the series include: Georgia Mill, Estonia, Latvia, LaSalle Bioenergy, Morehouse Bioenergy and Chesapeake.


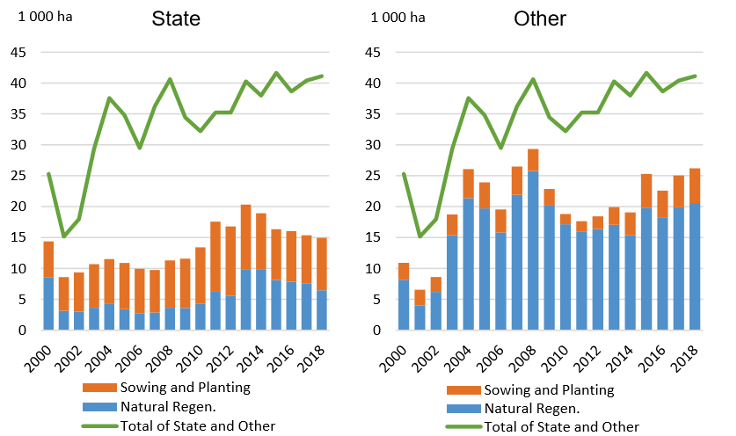
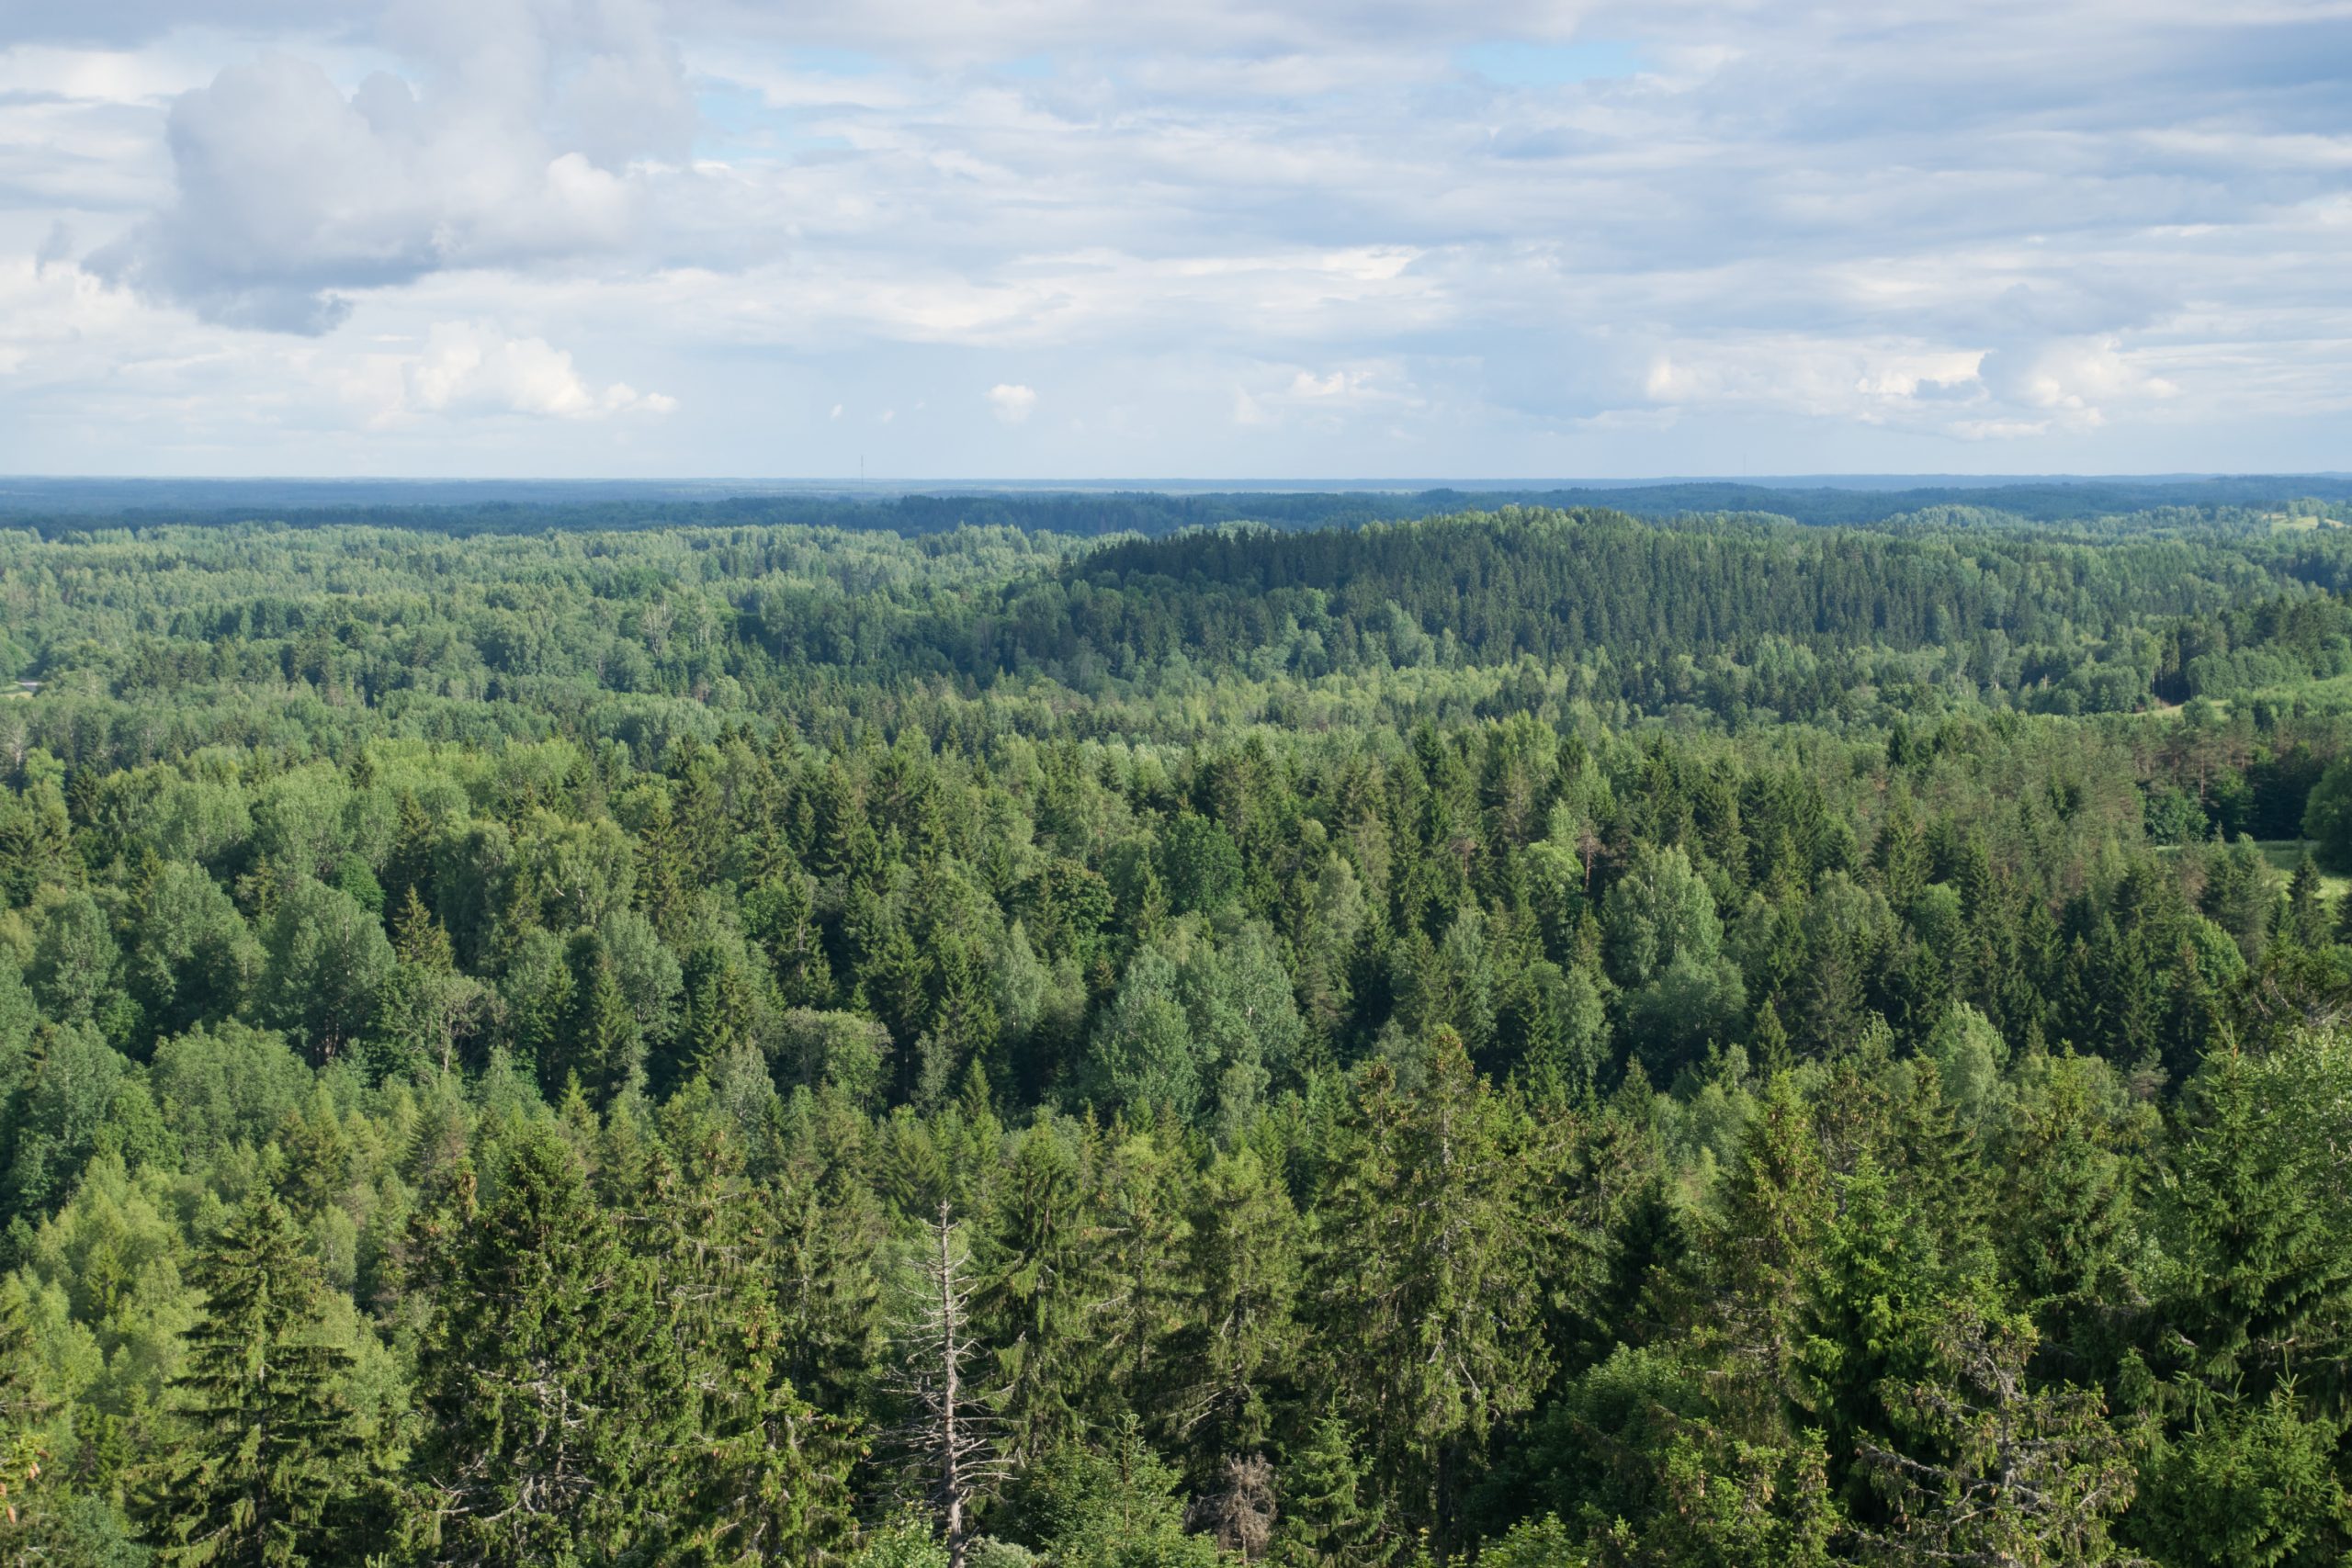
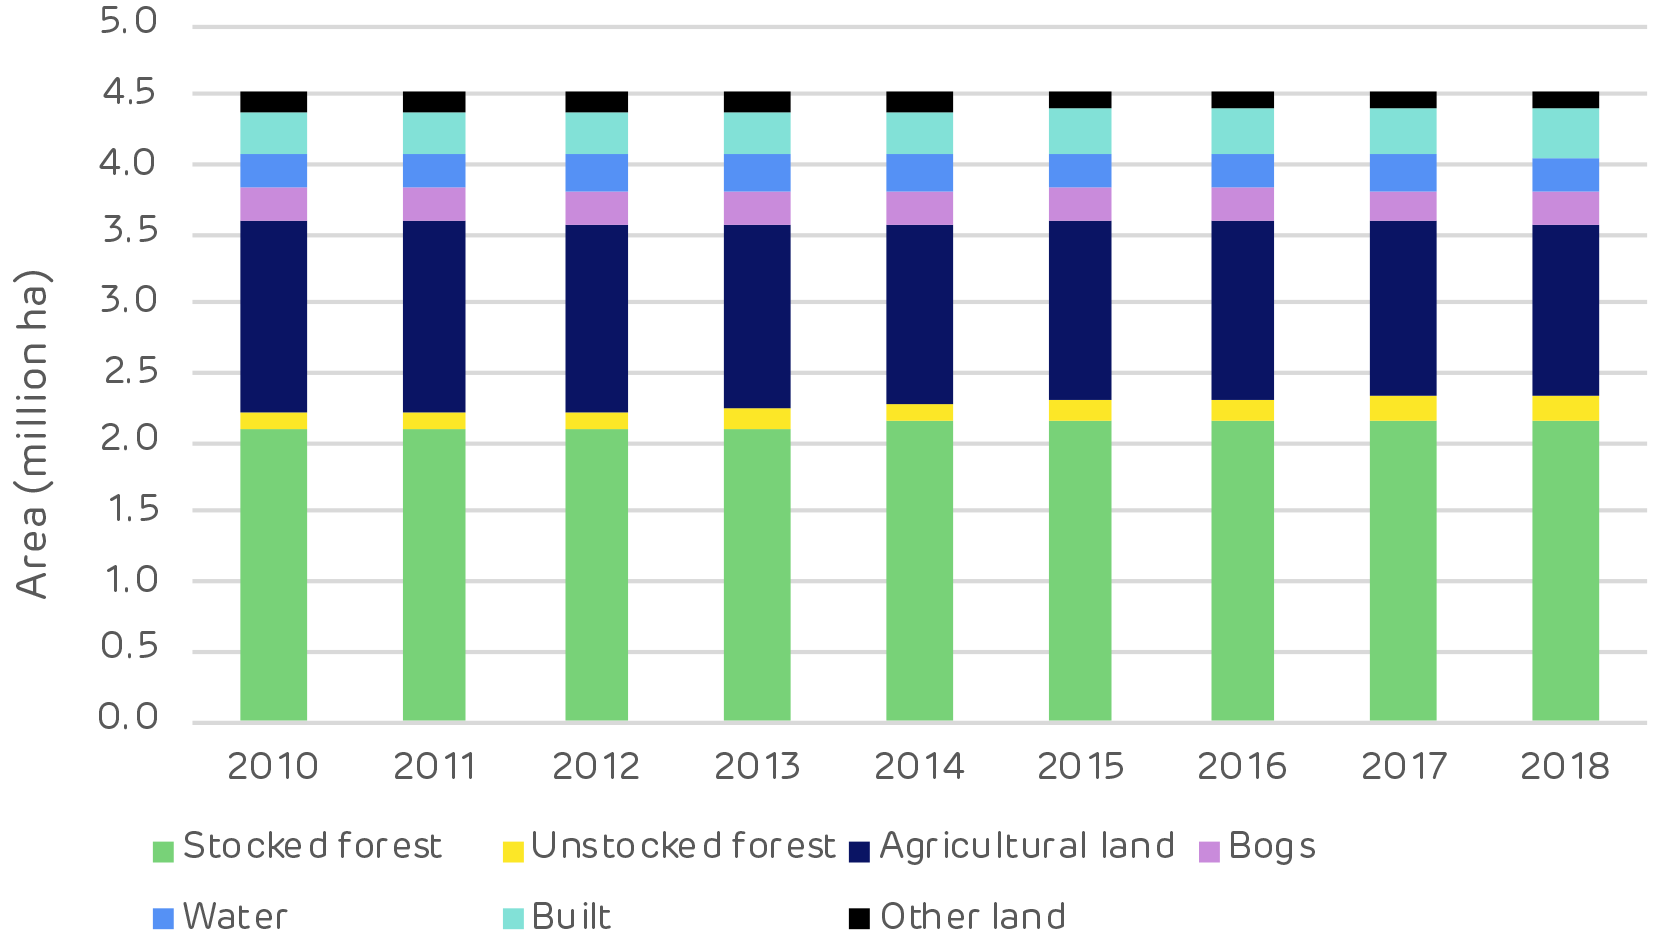
![Reforestation in Estonia. * Note: Since 2014 it has not been compulsory for private and other forest owners to submit reforestation data. [Click to view/download]](https://www.drax.com/wp-content/uploads/2020/03/figure_3.13.png)
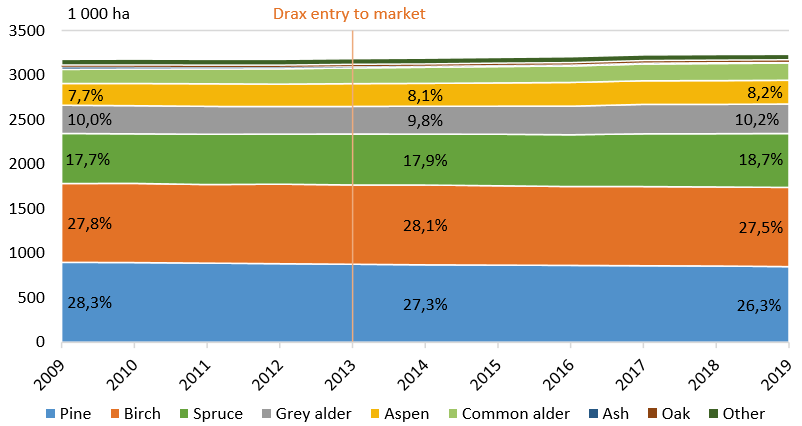
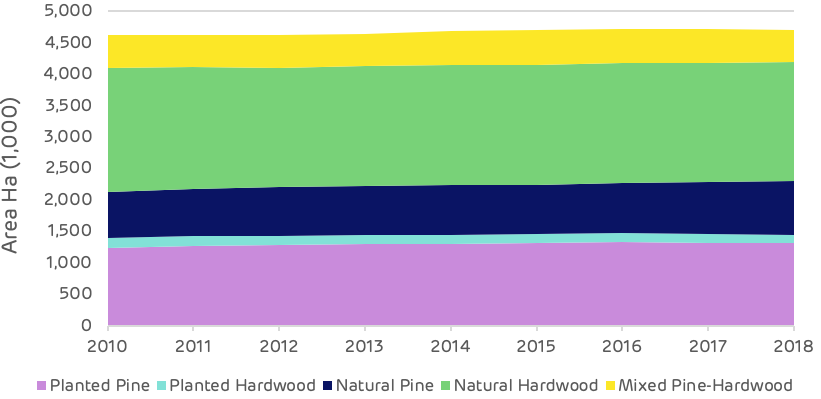
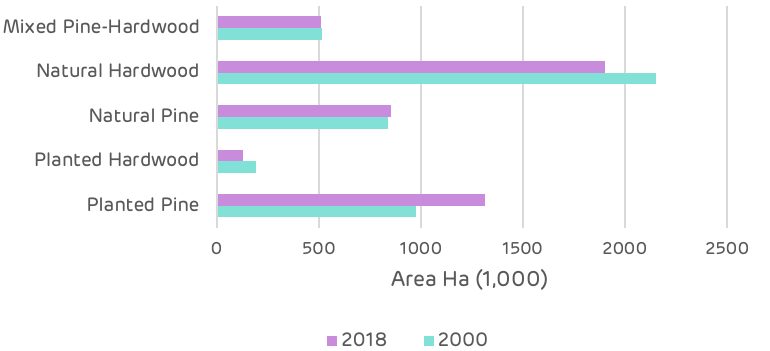
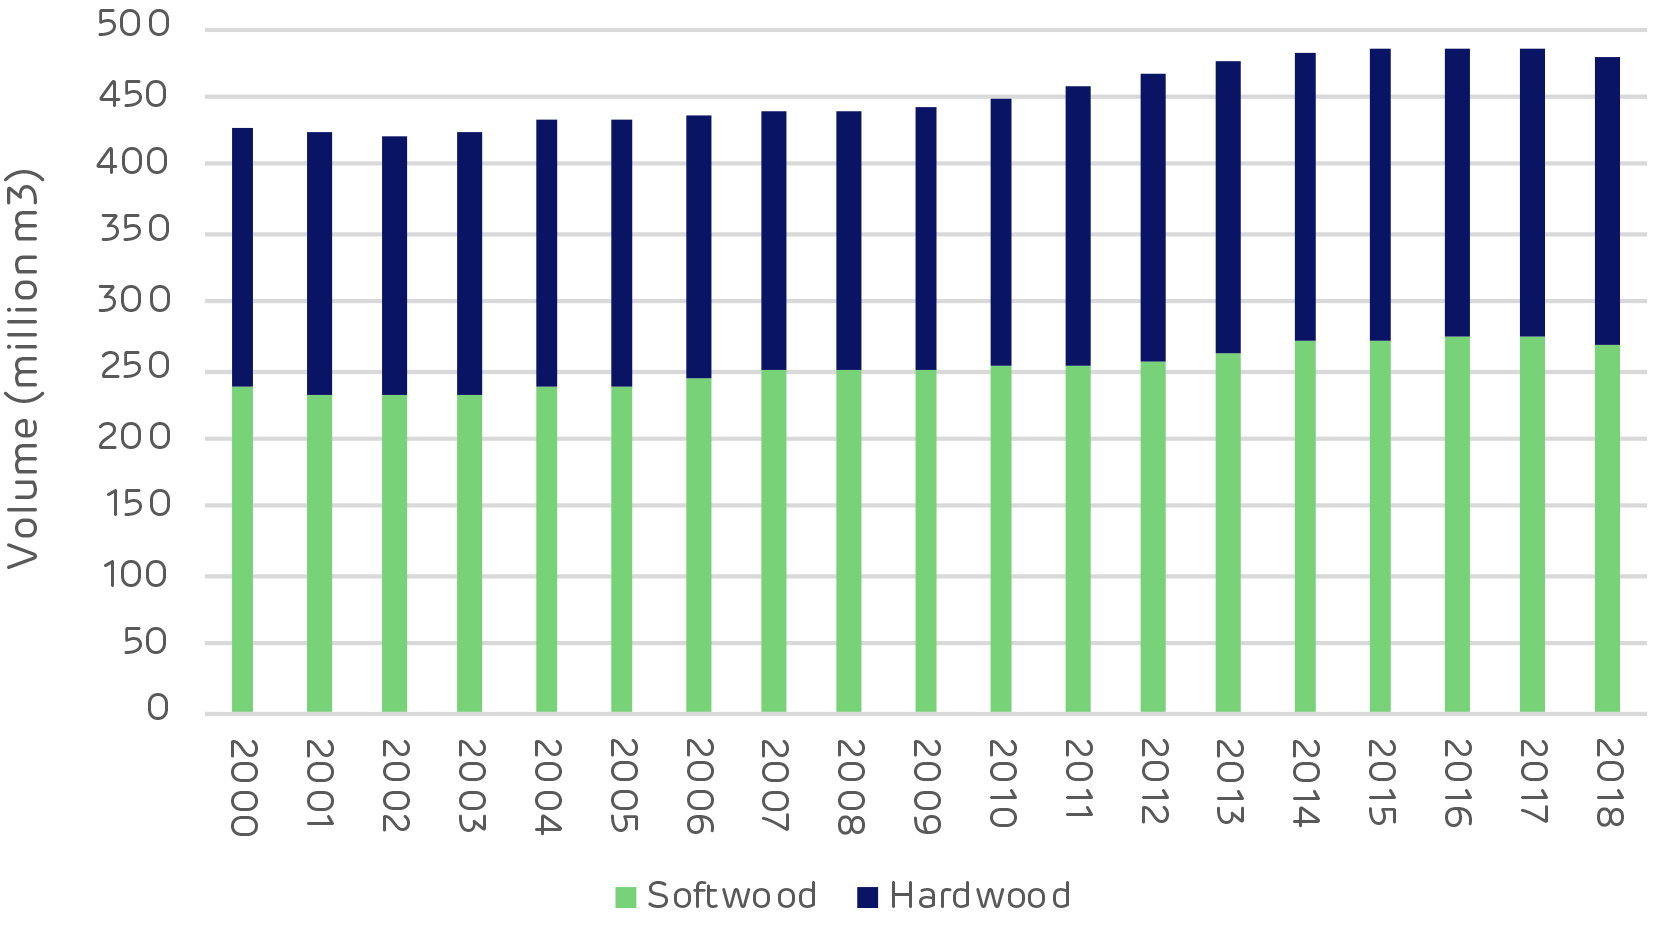
![Species mix in Estonian forests [Click to view/download]](https://www.drax.com/wp-content/uploads/2020/03/figure_3.3.png)
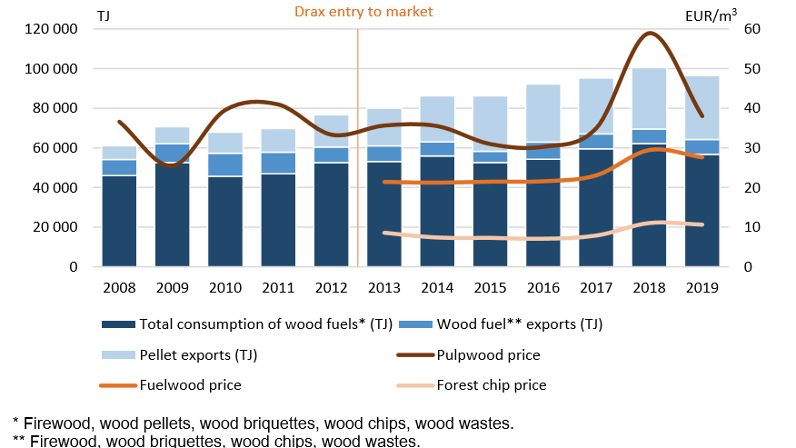
![Comparison of sawlog and pulpwood prices [click to view/download]](https://www.drax.com/wp-content/uploads/2020/03/Picture-1.pdf2_-1.png)