


The US South’s biomass sourcing areas analysed
The eigth report in a series of catchment area analyses for Drax looks at the fibre sourcing area surrounding two compressed wood pellet plants operated by Pinnacle.
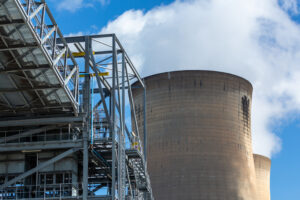
This part of interior British Columbia (BC) is unique in the Drax supply chain. Forest type, character, history, utilisation, natural challenges, logistics, forest management and planning are all very different to the other regions from which Drax sources biomass. Recently devasted by insect pest and fire damage, Arborvitae Environmental Services has produced a fascinating overview of the key issues and challenges that are being experienced in this region.
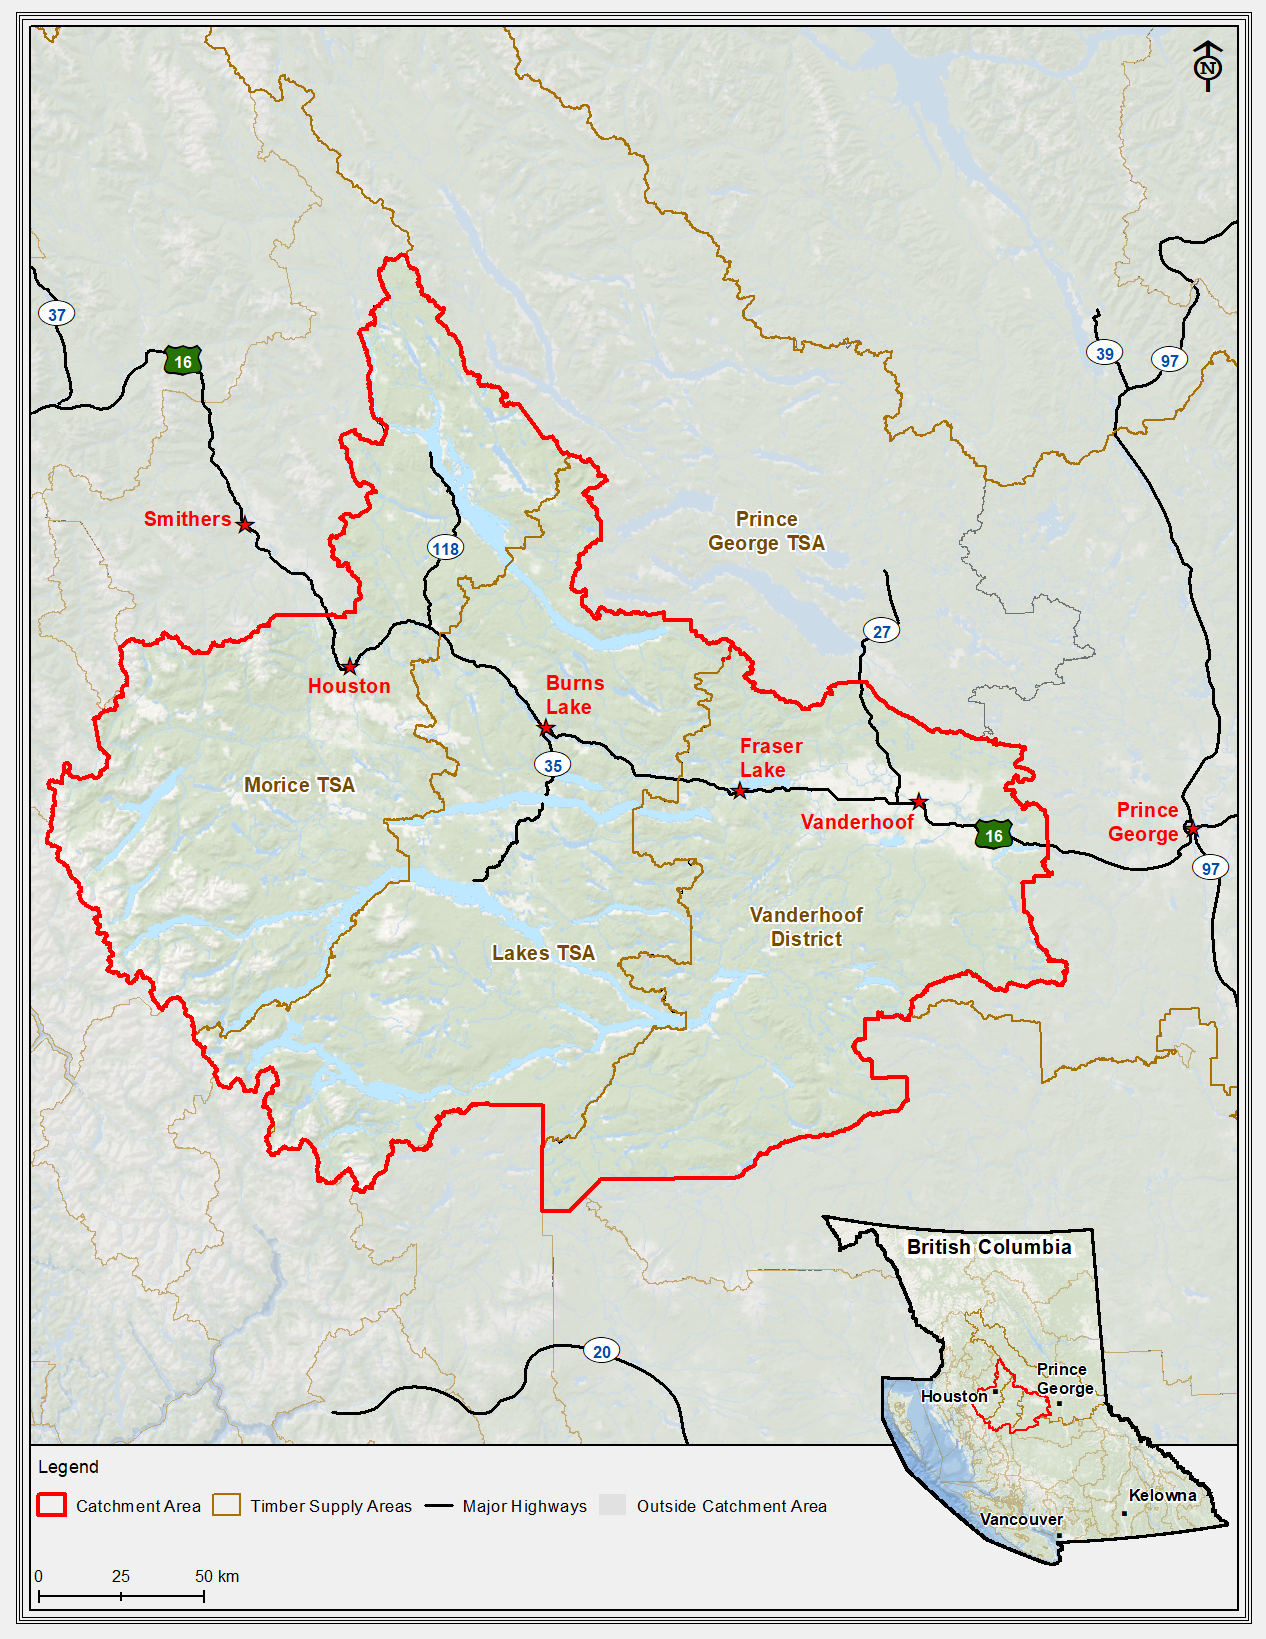
Figure 1: Catchment area map of the region [Click to view/download]
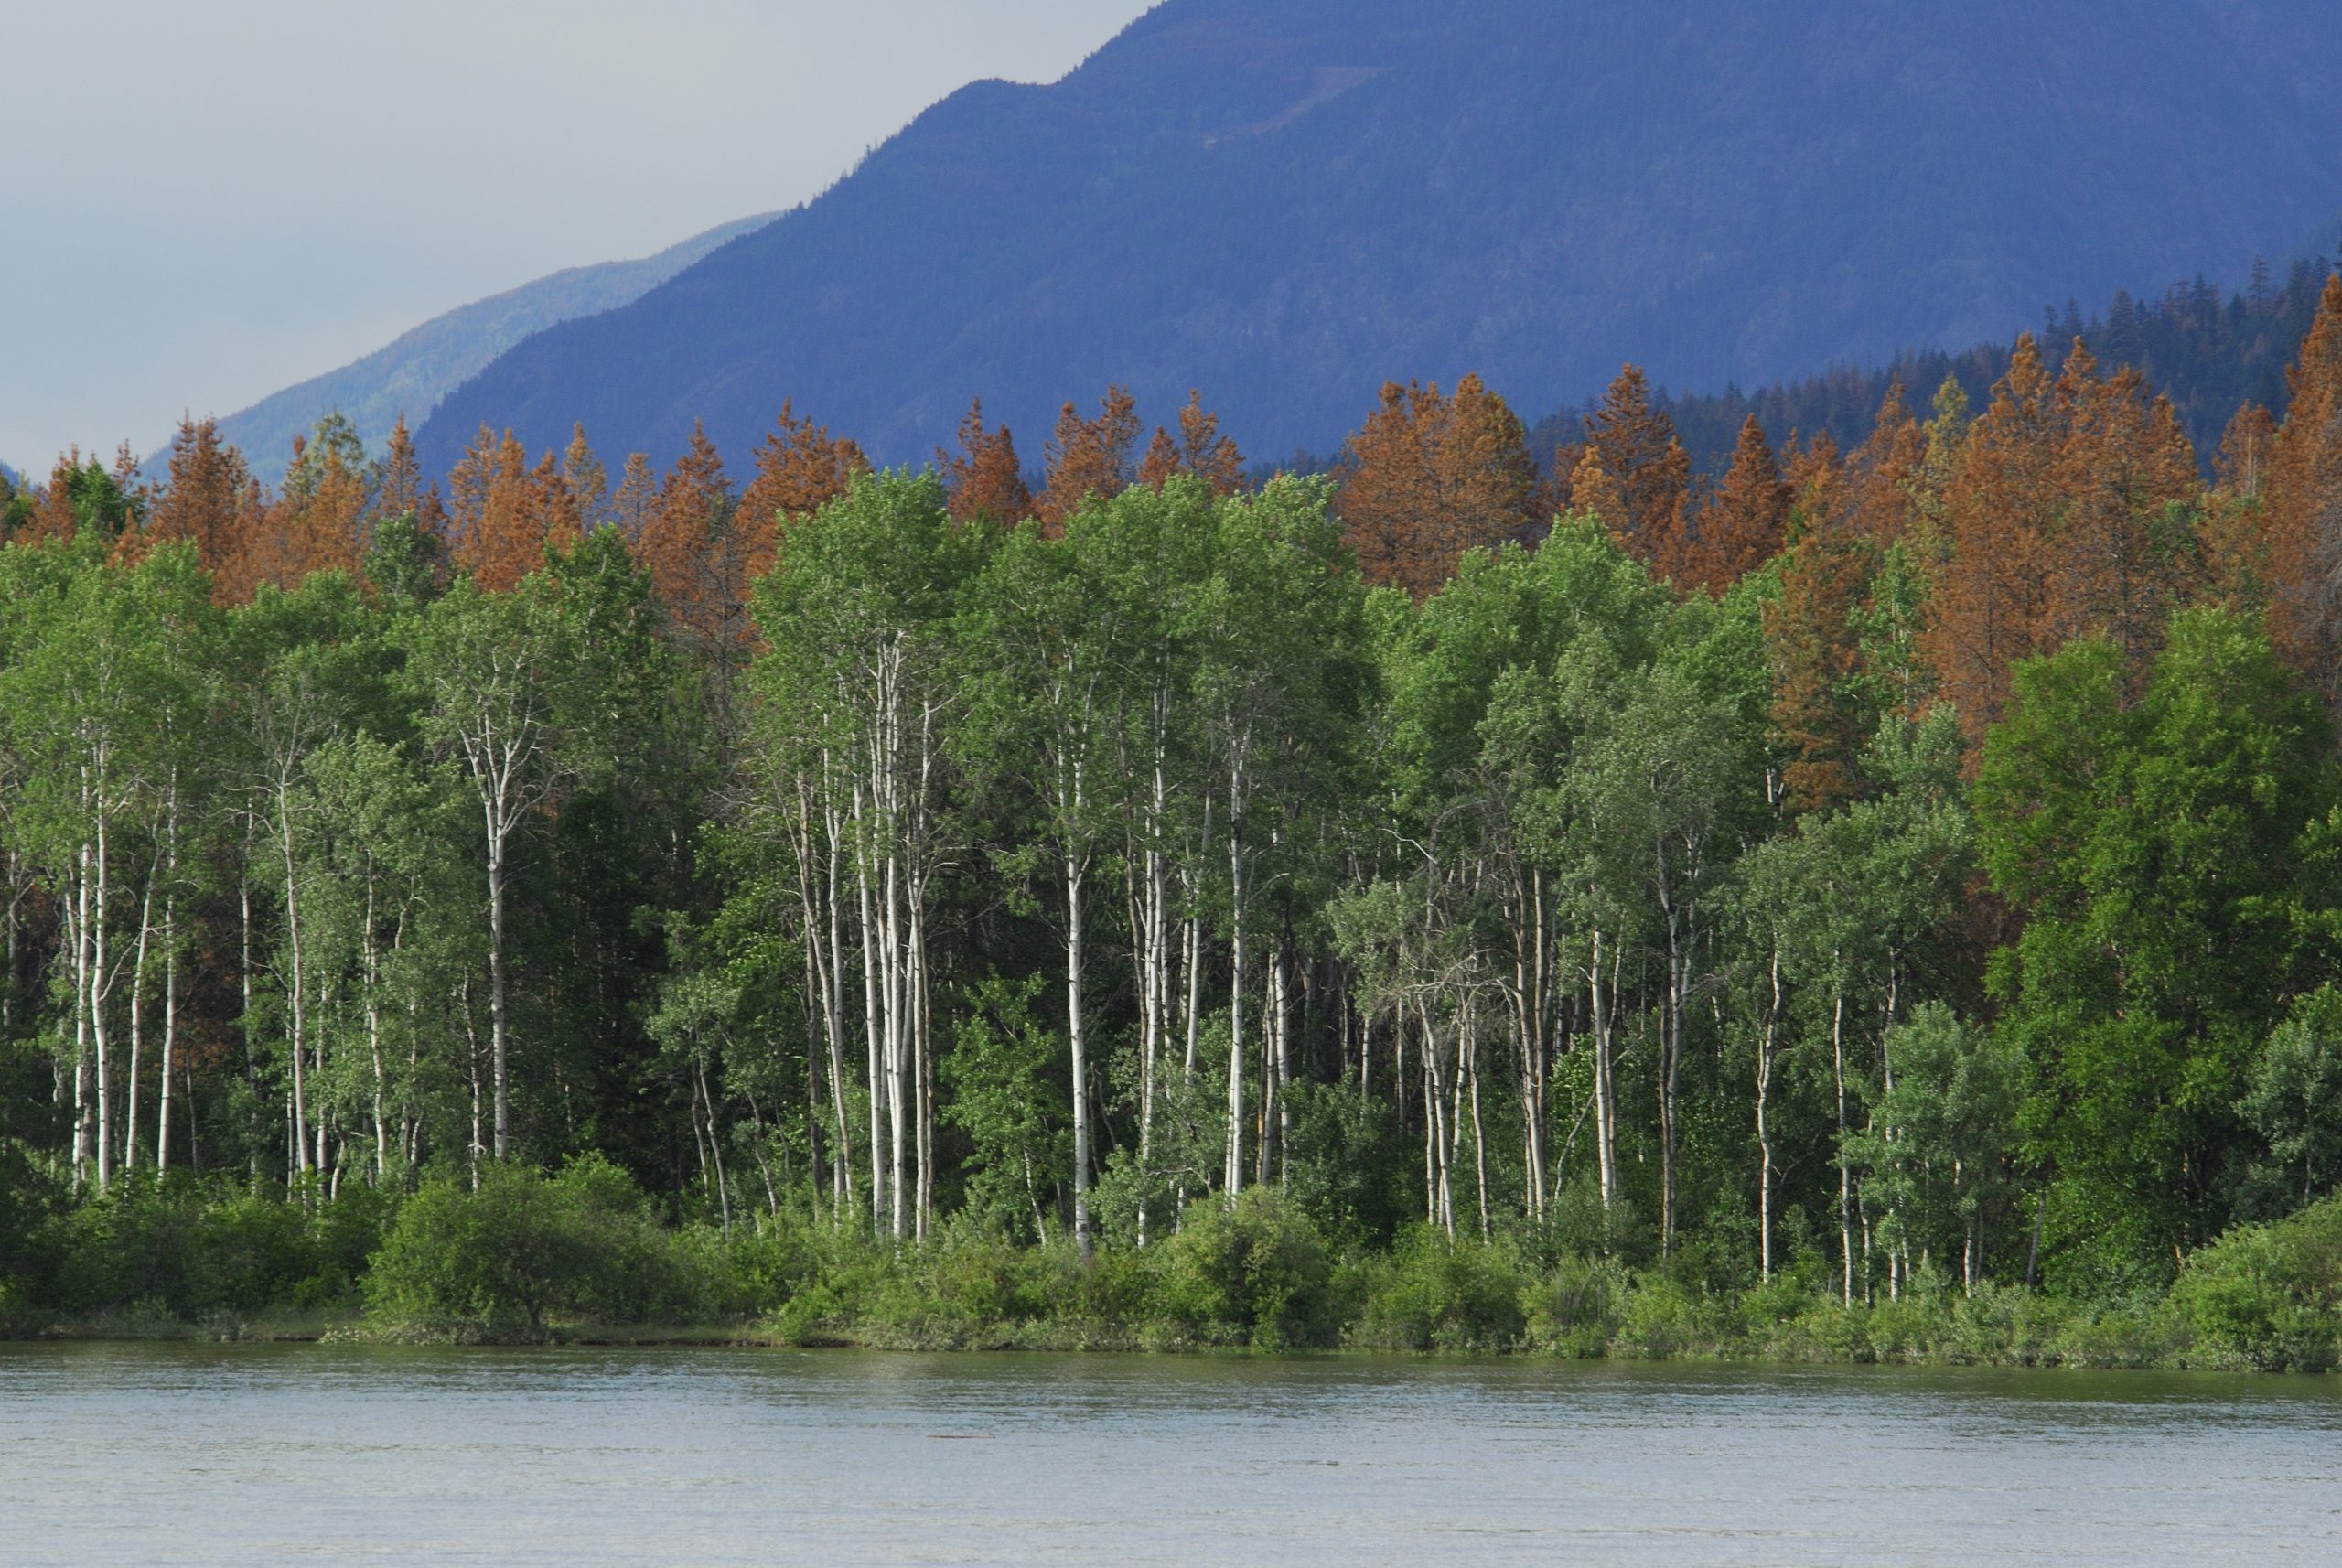
Like the entire BC Interior, the area has suffered a devastating attack of Mountain Pine Beetle (MPB) damage over the last 20 years which has completely dominated every forest management decision and action. Within the catchment area, the MPB killed an estimated 157 million cubic metres (m3) between 1999 and 2014, representing 42% of the estimated 377 million m3 of total standing timber in the catchment area in 1999. In addition, severe wildfires in 2018 burned an estimated 7.1 million m3.
These natural events have had a devastating impact on the forest resource. Harvesting increased significantly to utilise the dead and dying timber as lumber in sawmills whilst it was still viable.
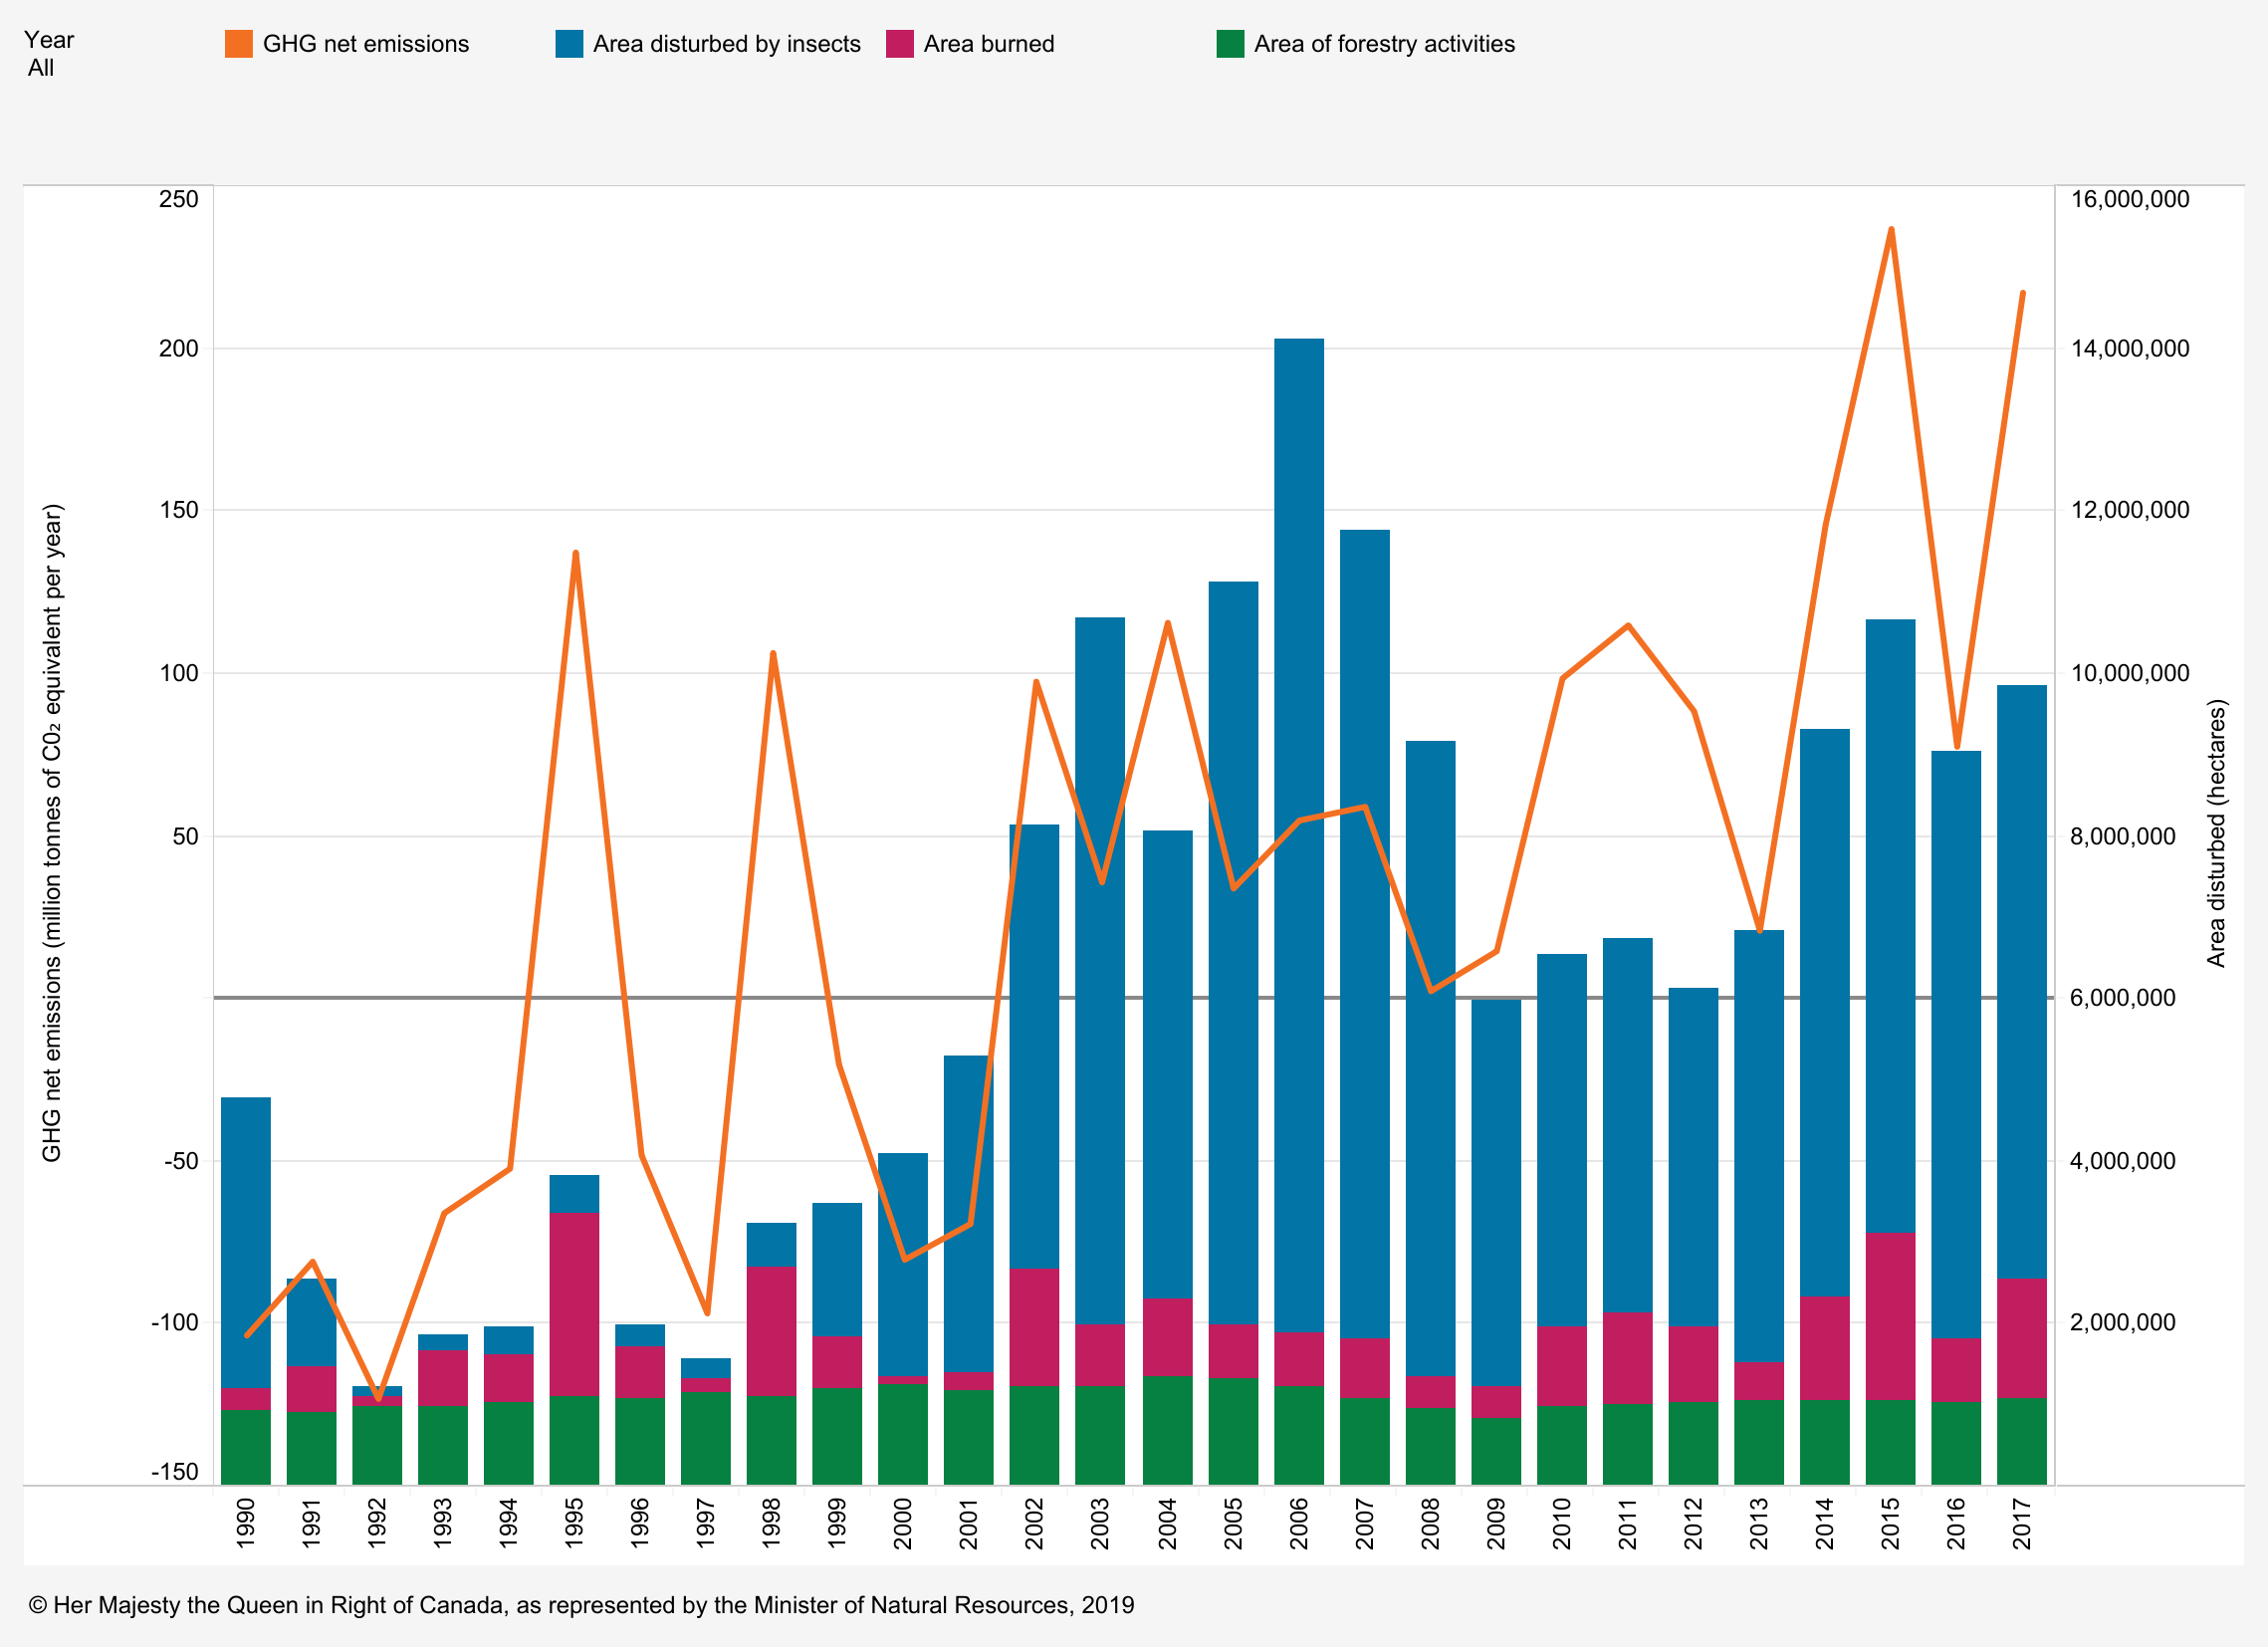
Net carbon emissions in Canada’s managed forest: All areas, 1990–2017; illustrates that the impact of fires and insect damage have been far more significant, by hectares affected, than forestry activity; Chart via Natural Government of Canada
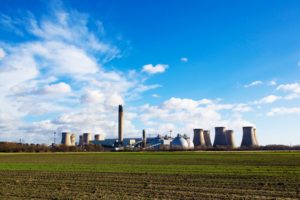
The Pinnacle pellet mills at Burns Lake and Houston were established alongside the sawmills to utilise the sawmill residues as there were no other viable markets for this material. These sawmills draw fibre from a large distance, up to 300 miles away. Therefore, the size of the catchment area in this piece of analysis is determined by the sourcing practices of the sawmills rather than the economic viability of low grade roundwood transport to the pellet mill (see Figure 1).
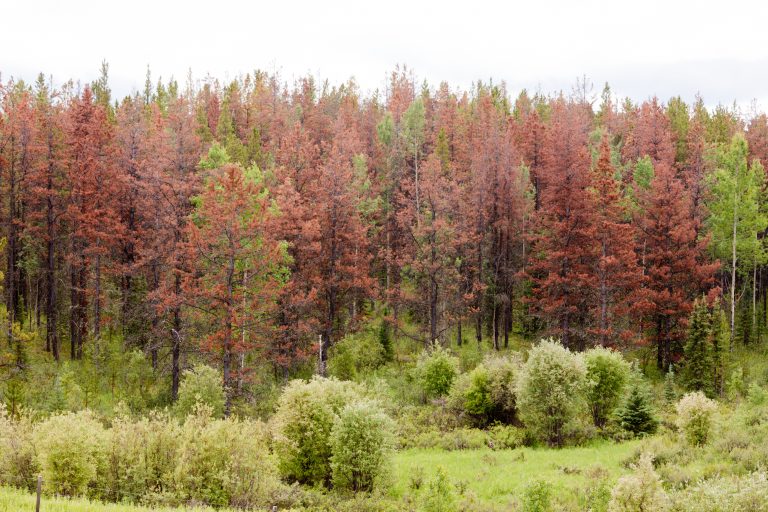
Damage to pine trees by Mountain Pine Beetle (MPB)
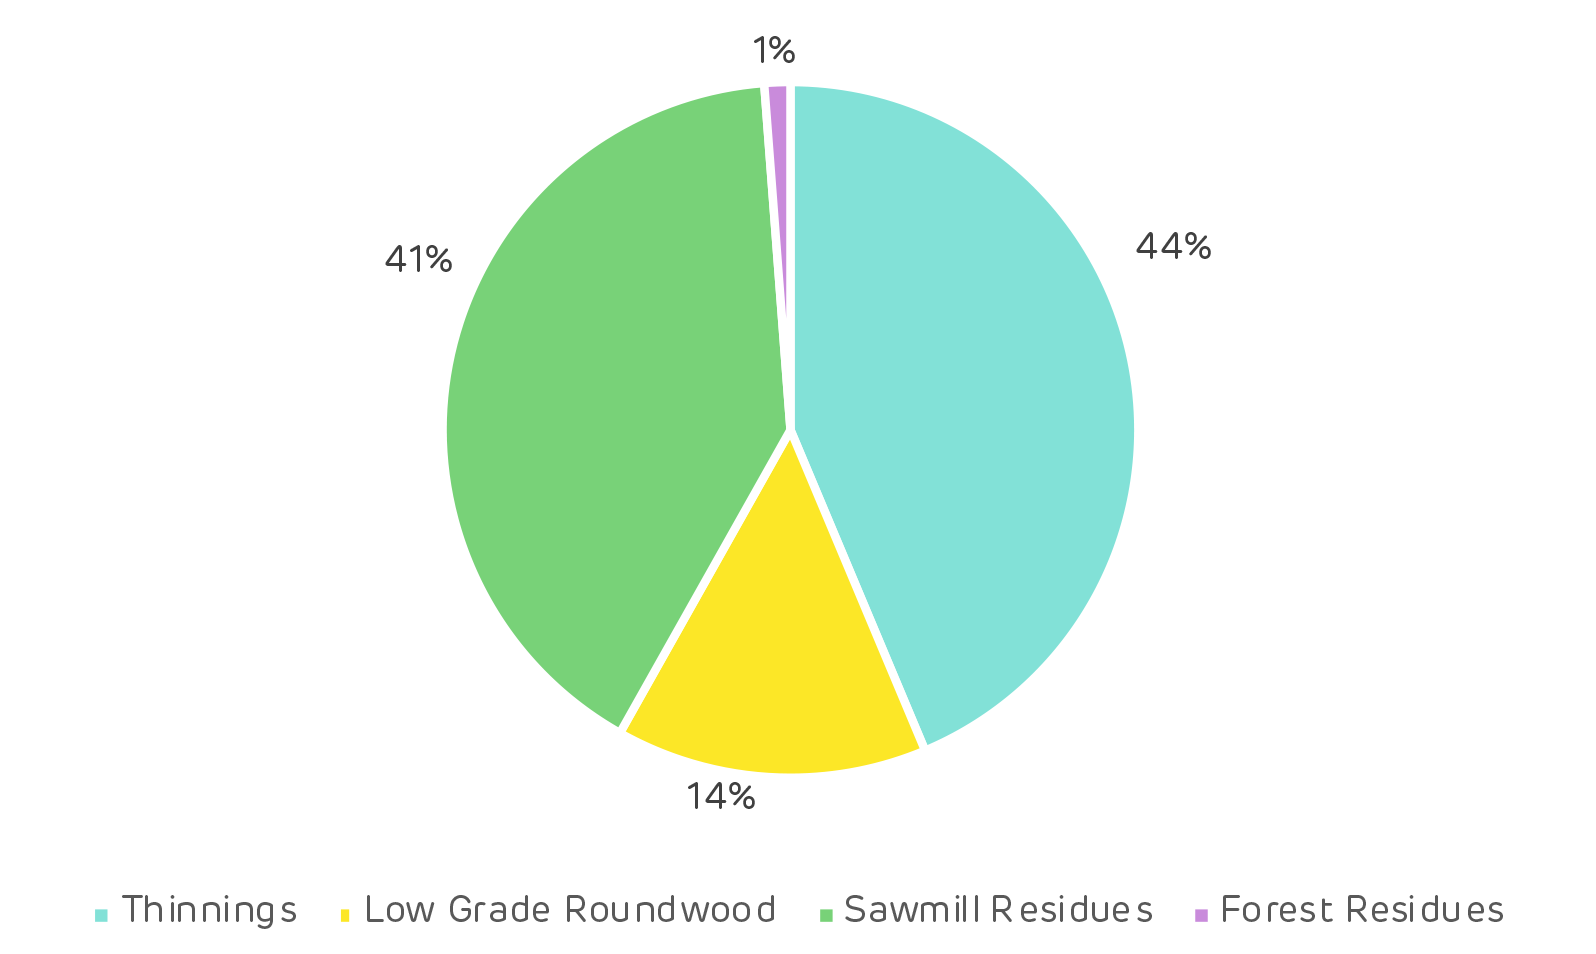
The two mills producing high-density biomass pellets have provided an essential outlet for residue material that would otherwise have no other market and until very recently were supplied almost entirely by mill residuals. As the quantity of dead and dying timber has reduced and sawmill production has declined, the pellet mills are beginning to utilise more low-grade roundwood and forest residues (that are otherwise heaped and burned at roadside following harvest) to supplement the sawmill co-products.
The total land area in the catchment for Burns Lake and Houston is 4.47 million hectares (ha) of which 3.75 million ha is classed as forest land, 94% of the catchment area is public land under provincial jurisdiction. The provincial forest service is responsible for all decisions on land use and forest management on public land, in consultation with communities and indigenous groups, determining which areas are suitable for timber production and which areas require protection. Approximately 34% of the catchment area is not available for commercial timber harvesting because it is either non-forested or it has low productivity, and other operational challenges, or it is protected for ecological and wildlife reasons.
The Chief Forester for the province sets the Annual Allowable Cut (AAC) which determines the quantity of timber that can be harvested each year. Ordinarily this will be based on the sustainable yield capacity of the working forest area, but in recent years the MPB damage has necessitated a significant increase in AAC to facilitate the salvage of areas that have been attacked and damaged (see Figure 2).
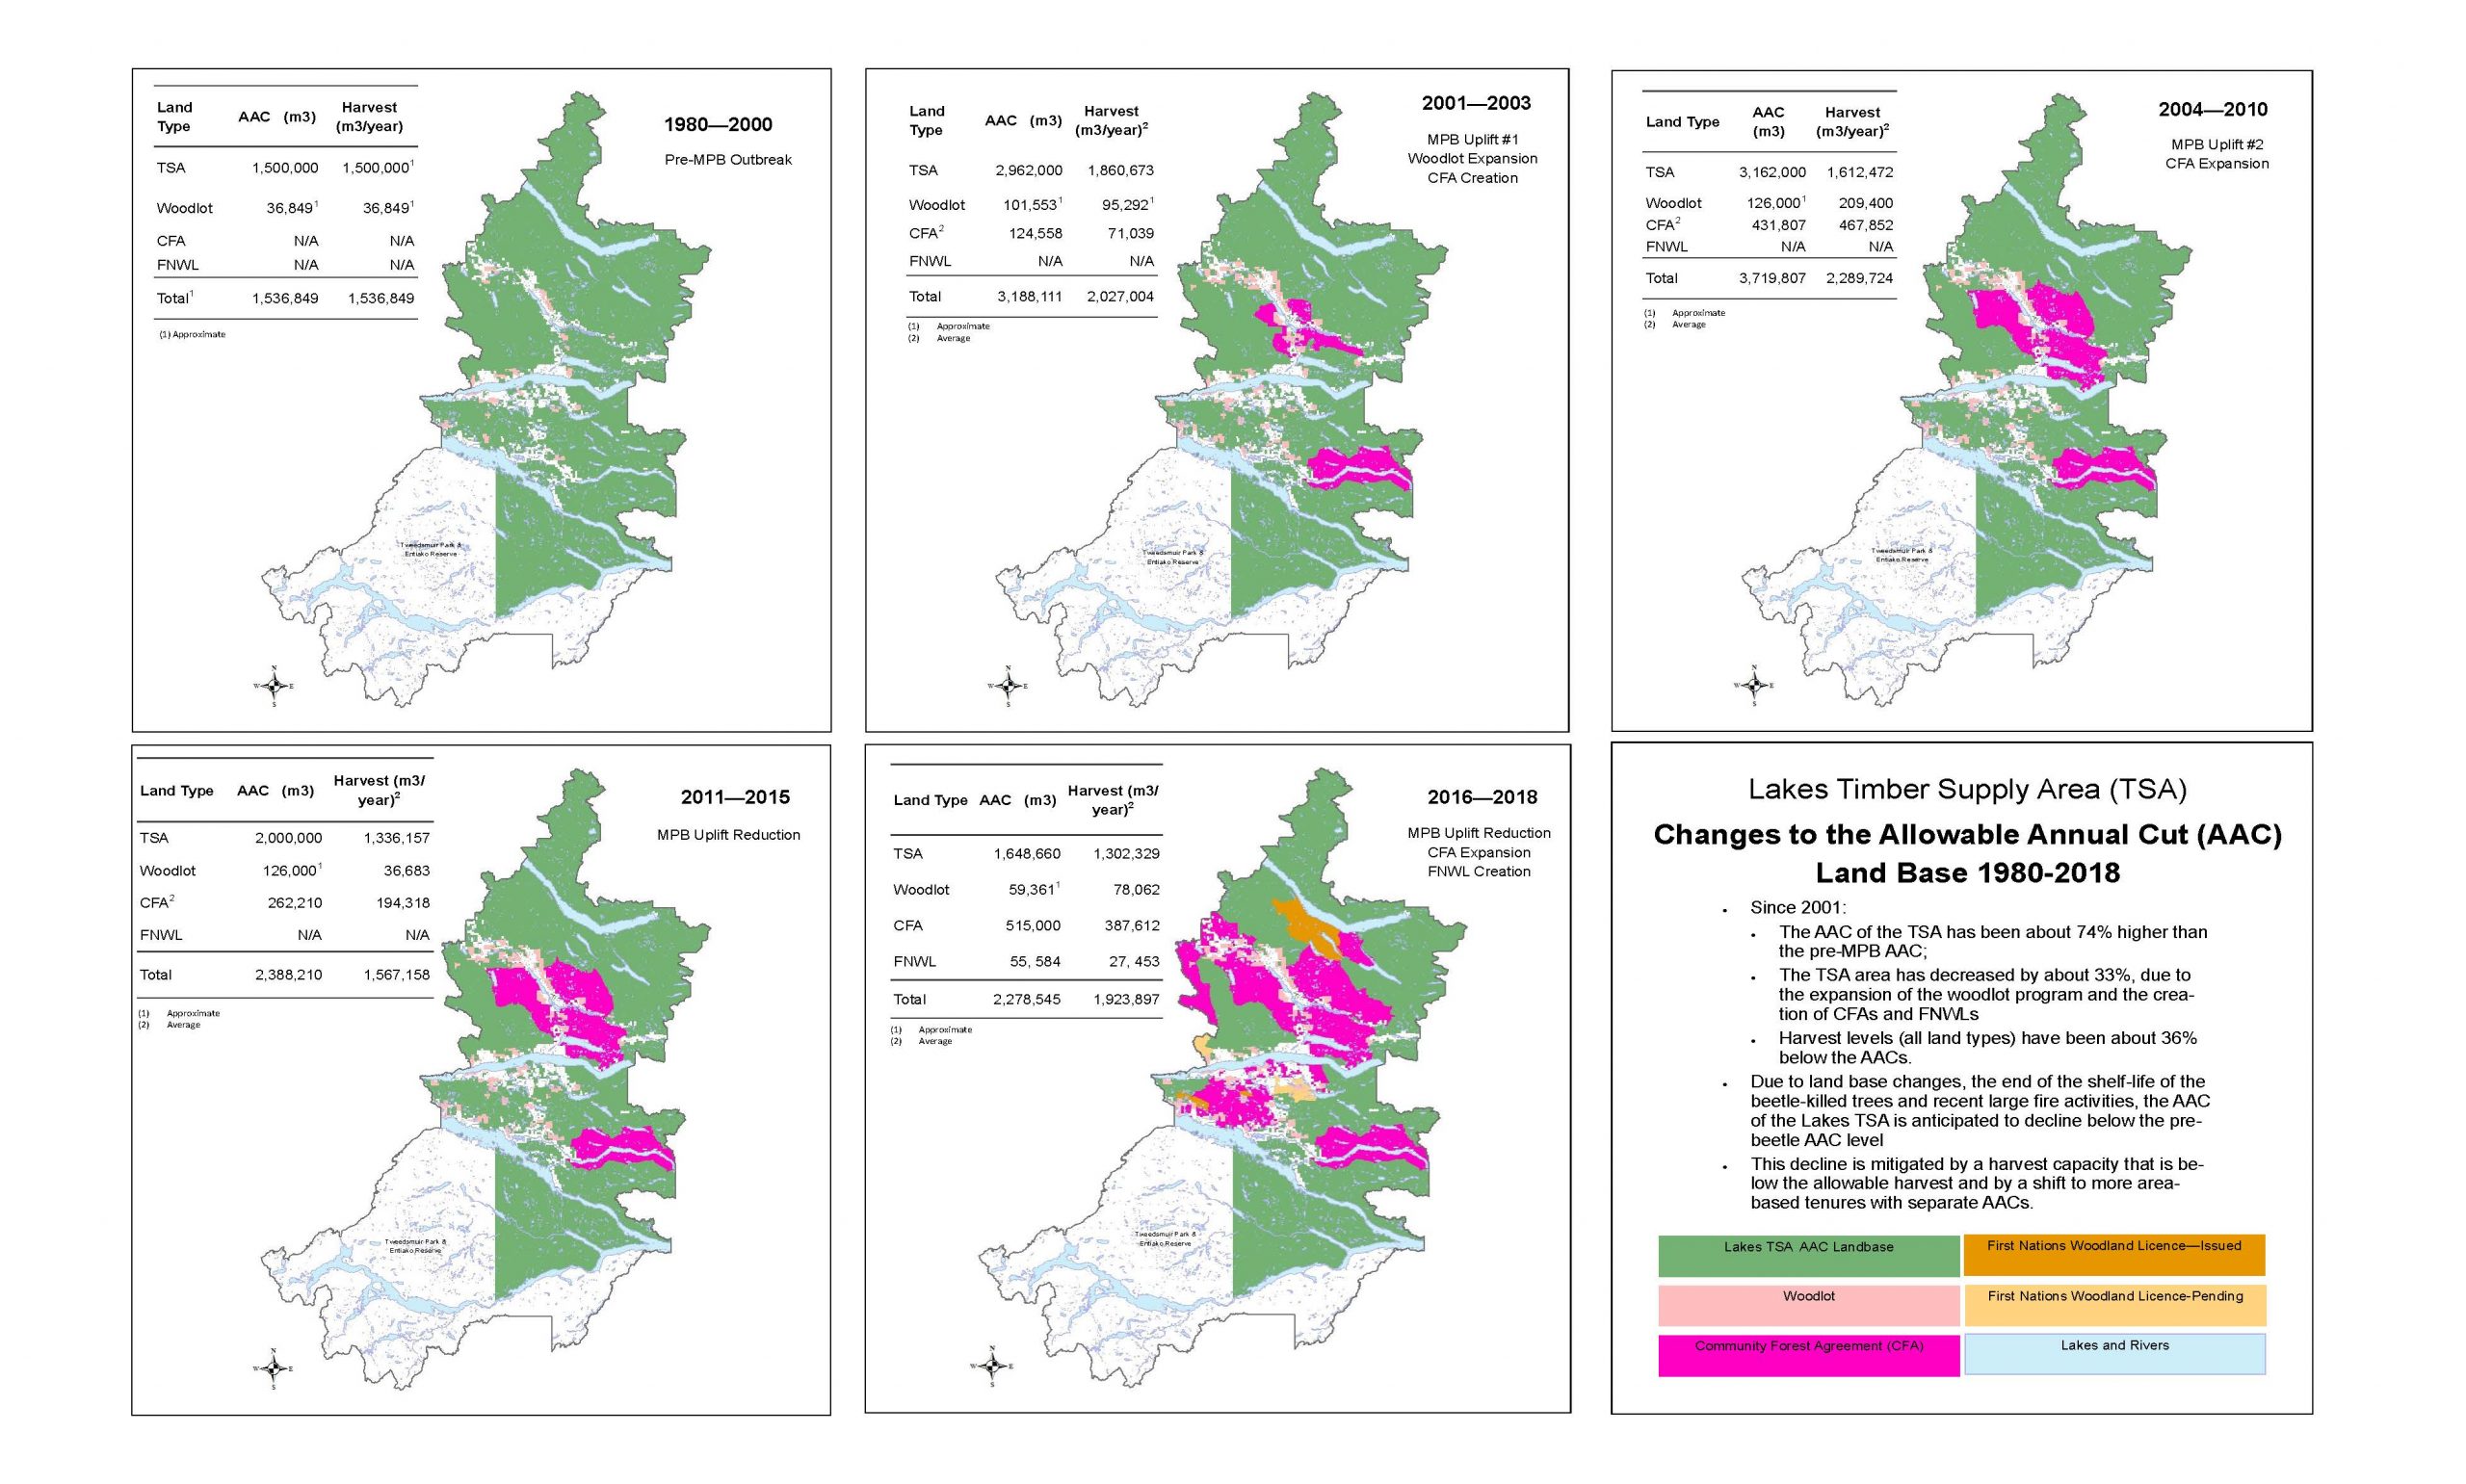
Figure 2: Changes in Annual Allowable Cut 1980 to 2018 (Source: Nadina District FLNRORD) [Click to view/download]
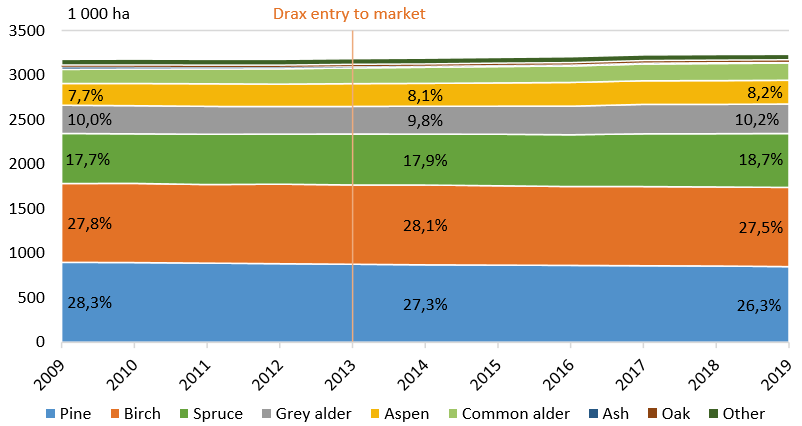
The forest area is dominated by coniferous species (see Figure 3) predominantly lodgepole pine, spruce and fir (90% of the total area), with hardwood species (primarily aspen) making up just 8% of the total area.
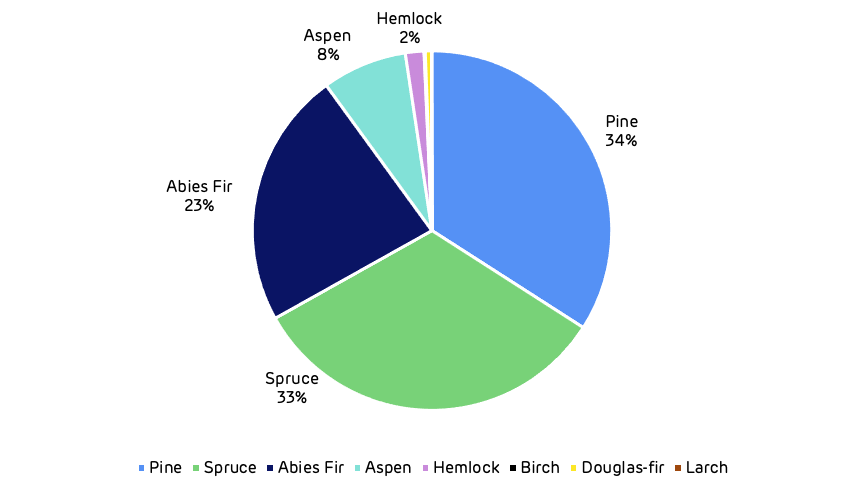
Figure 3: Species composition of forest land in the catchment area.
The annual harvest volume was at a peak in the early part of the last decade at over 12 million m3 in 2011. This has now declined by around 4.5 million m3 in 2019 (see Figure 4) as the beetle damaged areas are cleared and replanted. The AAC and harvesting levels are expected to be reduced in the future to allow the forest to regrow and recover.
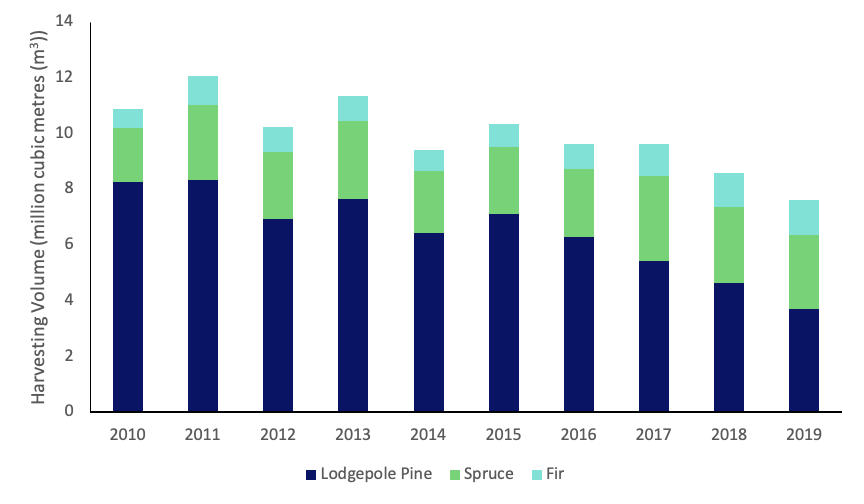
Figure 4: Annual change in harvest volume of major species
Historically, the forest area has naturally regenerated with self-seeded stands reaching a climax of mature pine, spruce, and Abies fir mixtures. As the forest matured, it would often be subject to natural fires or other disturbance which would cause the cycle to begin again. Following the increase in harvesting of beetle damaged areas, many forests are now replanted with mixtures of spruce and pine rather than naturally regenerated. This is likely to lead to an increase in forest growth rates in the future and a higher volume of timber availability once the areas reach maturity (see Figure 5).
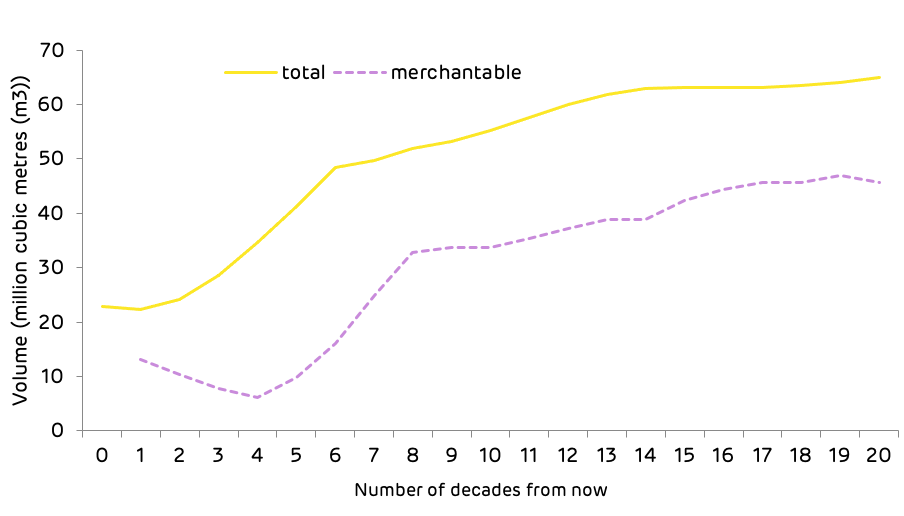
Figure 5: Forecast of future volume production
Timber markets in the catchment area are limited in comparison to other regions like the US South. The scale of the landscape and the inaccessible nature of many of the forest areas limit the viability of access to multiple markets. Sawmills produce the highest value end-product and these markets have driven the harvesting of forest tracts for many years. Concessions to harvest timber are licensed either by volume or for a specific area from the provincial forest service. This comes with a requirement to ensure that the forest regrows and is appropriately managed after harvesting.
There are no pulp mills within the catchment area and limited alternative markets for the lowest grades of roundwood or sawmill residuals other than the pellet mills; consequently, the pellet mills have a close relationship with the sawmills.
Prices for standing timber on public land are determined by the provincial government using results from public timber sales and set according to the species and quality of timber produced (from the highest-grade logs through to forest residuals). The lack of market diversity and challenging logistics mean that there is little competition for mill residuals and low-grade fibre. The price differential in end-product value between sawtimber and wood pellets ensures that fibre suitable for sawmill utilisation does not get processed by the pellet mill. A very small volume of larger dimension material can end up in a low value market when there are quality issues that limit the value for sawtimber (e.g. rotten core, structural defects) but this represents a very small proportion of the supply volume. There is no evidence that pellet mills have displaced other markets within this catchment area.

To tackle the climate crisis, global unity and collaboration are needed. This was in part the thinking behind the Paris Agreement. It set a clear, collective target negotiated at the 2015 United Nations Climate Change Conference and signed the following year: to keep the increase in global average temperatures to well below 2 degrees Celsius above pre-industrial levels.
In November 2021, COP26 will see many of the countries who first signed the Paris Agreement come together in Glasgow for the first ‘global stocktake’ of their environmental progress since its creation.

COP26 will take place at the SEC in Glasgow
Already delayed for a year as a result of the pandemic, COVID-19 and its effects on emissions is likely to be a key talking point. So too will progress towards not just the Paris Agreement goals but those of individual countries. Known as ‘National Determined Contributions’ (NDCs), these sit under the umbrella of the Paris Agreement goals and set out individual targets for individual countries.
With many countries still reeling from the effects of COVID-19, the question is: which countries are actually on track to meet them?
The NDCs of each country represent its efforts and goals to reduce national emissions and adapt to the impacts of climate change. These incorporate various targets, from decarbonisation and forestry to coastal preservation and financial aims.
While all countries need to reduce emissions to meet the Paris Agreement targets, not all have an equally sized task. The principle of differentiated responsibility acknowledges that countries have varying levels of emissions, capabilities and economic conditions.
The Universal Ecological Fund outlined the emissions breakdown of the top four emitters, showing that combined, they account for 56% of global greenhouse gas emissions. China is the largest emitter, responsible for 26.8%, followed by the US which contributes 13.1%. The European Union and its 28 member states account for nine per cent, while India is responsible for seven per cent of all emissions.
These nations have ambitious emissions goals, but are they on track to meet them?

Traffic jams in the rush hour in Shanghai Downtown, contribute to high emissions in China.
By 2030, China pledged to reach peak carbon dioxide (CO2), increase its non-fossil fuel share of energy supply to 20% and reduce the carbon intensity – the ratio between emissions of CO2 to the output of the economy – by 60% to 65% below 2005 levels.
COVID-19 has increased the uncertainty of the course of China’s emissions. Some projections show that emissions are likely to grow in the short term, before peaking and levelling out sometime between 2021 and 2025. However, according to the Climate Action Tracker it is also possible that China’s emissions have already peaked – specifically in 2019. China is expected to meet its non-fossil energy supply and carbon intensity pledges.
The forecast for the second largest emitter, the US, has also been affected by the pandemic. Economic firm Rhodium Group has predicted that the US could see its emissions drop between 20% and 27% by 2025, meeting its target of reducing emissions by 26% to 28% below 2005 levels.
However, President Trump’s rolling back of Obama-era climate policies and regulations, his support of fossil fuels and withdrawal from the Paris Agreement (effective from as early as 4 November 2020), suggest any achievement may not be long-lasting.
The United States’ Coronavirus Aid, Relief, and Economic Security Act, known as the CARES Act, does not include any direct support to clean energy development – something that could also change in 2021.
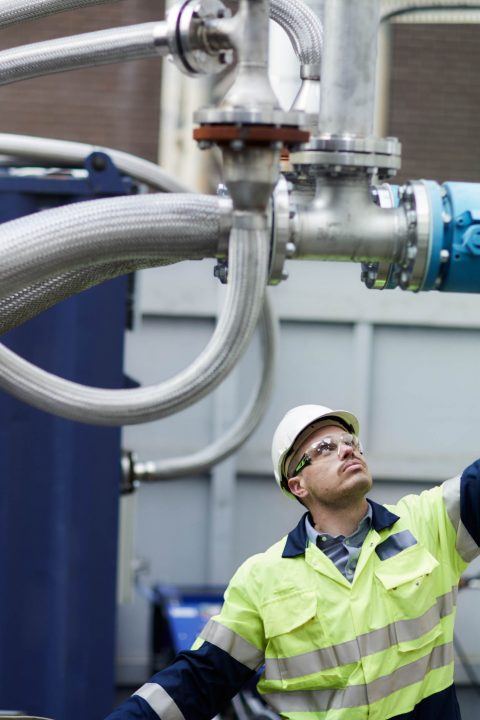
Carl Clayton, Head of BECCS at Drax, inspects pipework in the CCUS area of Drax Power Station
The European Union and its member states, then including the UK, pledged to reduce emissions by at least 40% below 1990 levels by 2030 – a target the Climate Action Tracker estimates will be achieved. In fact, the EU is on track to cut emissions by 58% by 2030.
This progress is in part a result of a large package of measures adopted in 2018. These accelerated the emissions reductions, including national coal phase-out plans, increasing renewable energy and energy efficiency. The package also introduced legally binding annual emission limits for each member state within which they can set individual targets to meet the common goal.
The UK has not yet released an updated, independent NDC. However, it has announced a £350 million package designed to cut emissions in heavy industry and drive economic recovery from COVID-19. This includes £139 million earmarked to scale up hydrogen production, as well as carbon capture and storage (CCS) technology, such as bioenergy with carbon capture (BECCS) – essential technologies in achieving net zero emissions by 2050 and protecting industrial regions.
India, the fourth largest global emitter, is set to meet its pledge to reduce its emissions intensity by 33% to 35% below 2005 levels and increase the non-fossil share of power generation to 40% by 2030. What’s more, the Central Electricity Agency has reported that 64% of India’s power could come from non-fossil fuel sources by 2030.
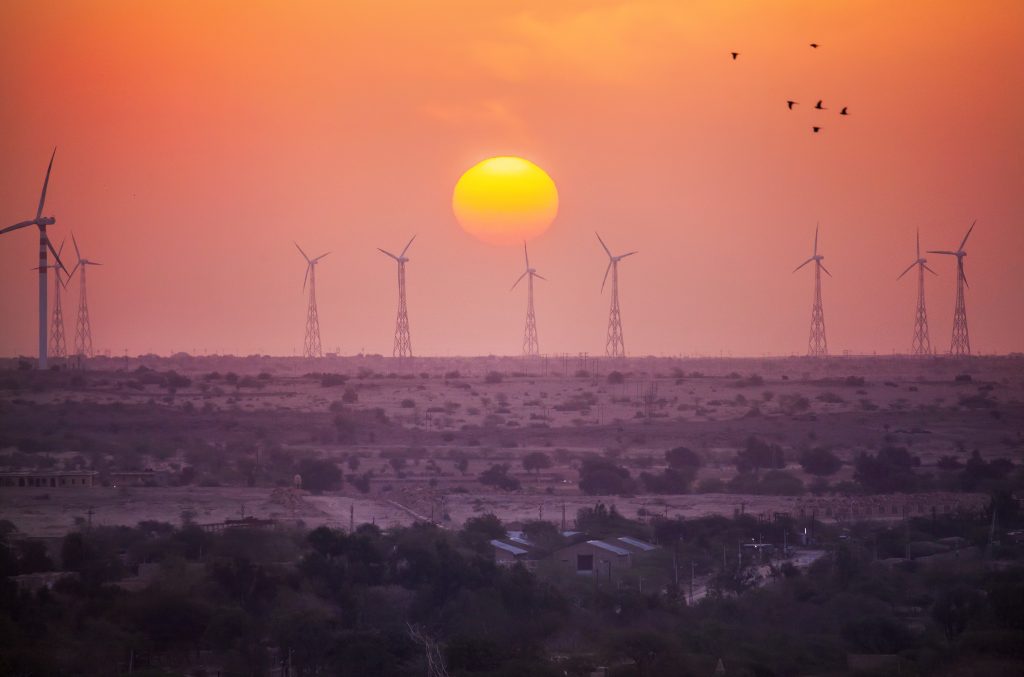
Wind turbines in Jaisalmer, Rajasthan, India
Along with increasingly renewable generation, the implementation of India’s National Smart Grid Mission aims to modernise and improve the efficiency of the country’s energy system.
It is promising that the world’s four largest emitters have plans in place and are making progress towards their decarbonisation goals. However, tackling climate change requires action from around the entire globe. In addition to NDCs, many countries have committed to, or have submitted statements of intent, to achieve net zero carbon emissions in the coming years.
| Country | Target Date | Status |
|---|---|---|
Bhutan  | Currently carbon negative (and aiming for carbon neutrality as it develops; pledged towards the Paris Agreement) | |
Suriname  | Currently carbon negative | |
Denmark  | 2050 | In law |
France  | 2050 | In law |
Germany  | 2050 | In law |
Hungary  | 2050 | In law |
New Zealand  | 2050 | In law |
Scotland  | 2045 | In law |
Sweden  | 2045 | In law |
United Kingdom  | 2050 | In law |
Bulgaria  | 2050 | Policy Position |
Canada  | 2050 | Policy Position |
Chile  | 2050 | In policy |
China  | 2060 | Statement of intent |
Costa Rica  | 2050 | Submitted to the UN |
EU  | 2050 | Submitted to the UN |
Fiji  | 2050 | Submitted to the UN |
Finland  | 2035 | Coalition agreement |
Iceland  | 2040 | Policy Position |
Ireland  | 2050 | Coalition Agreement |
Japan  | 2050 | Policy Position |
Marshall Islands  | 2050 | Pledged towards the Paris Agreement |
Netherlands  | 2050 | Policy Position |
Norway  | 2050 in law, 2030 signal of intent | |
Portugal  | 2050 | Policy Position |
Singapore  | As soon as viable in the second half of the century | Submitted to the UN |
Slovakia  | 2050 | Policy Position |
South Africa  | 2050 | Policy Position |
South Korea  | 2050 | Policy Position |
Spain  | 2050 | Draft Law |
Switzerland  | 2050 | Policy Position |
Uruguay  | 2030 | Contribution to the Paris Agreement |
While the COVID-19 pandemic has disrupted short-term plans, many see it as an opportunity to rejuvenate economies with sustainability in mind. COP26, as well as the global climate summit planned for December of this year, will likely see many countries lay out decarbonisation goals that benefit both people’s lives and the planet.
#COP26, as well as the UK/UN climate meeting planned for this December, will likely see many countries lay out decarbonisation goals that benefit both people’s lives and the planet. #COP26countdown
#COP26Ambition
— Drax (@DraxGroup) October 30, 2020
The seventh report in a series of catchment area analyses for Drax looks at the fibre sourcing area surrounding a number of compressed wood pellet plants operated by Georgia Biomass (now owned by Enviva) and Fram Renewable Fuels.
The evidence found in the report by Hood Consulting shows a substantial increase in forest inventory (stored carbon) and a relatively stable forest area. However, with continued pressure from urban development, future losses of timberland area are possible. Despite this, increasing growth rates can maintain and improve wood supply and carbon stock for the foreseeable future.
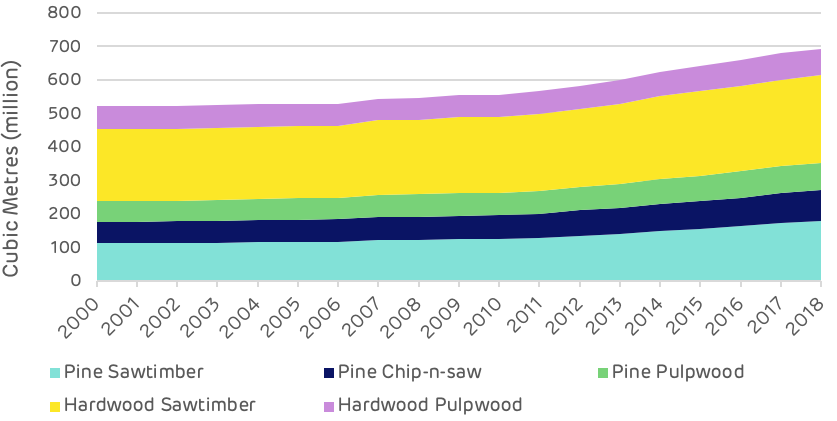
The overall inventory of growing stock in the catchment area has increased by 63 million cubic metres (m3) between 2000 and 2018, a growth of 19.3%. All of this increase has been in the pine area, which increased by nearly 68 million m3, whereas the hardwood species decreased in volume by 4.5 million m3. Overall, the inventory volume split by species in 2018 was 72% to 28% softwood to hardwood. The breakdown by product category is shown in Figure 3 below.
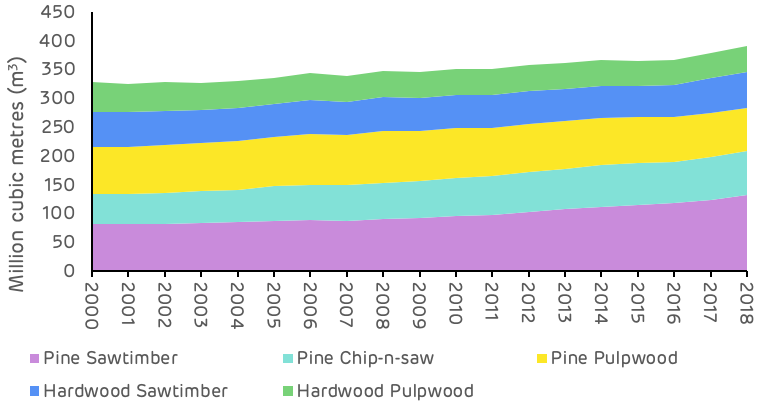
Figure 1: Change in growing stock by major product category and species (USFS)
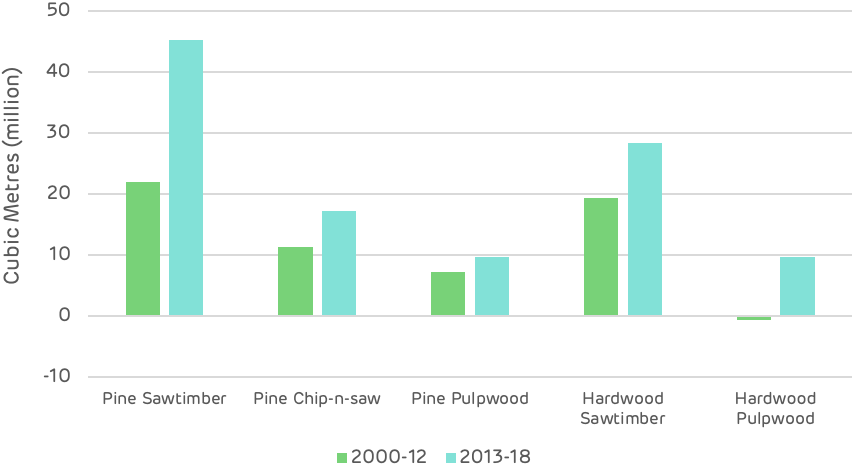
The pine saw-timber and chip-n-saw product categories, larger dimension and higher value material, showed the largest increase in inventory, whereas pine pulpwood decreased in total volume. The most substantial change occurred from 2010 to 2018, where pulpwood went from an increasing trend to a decreasing trend and saw-timber increased in volume much more rapidly – this is shown in Table 1 and Figure 2 below.
Table 1: Change in growing stock volume by major product category (USFS)These changes are likely to reflect an increasing age class in the catchment area, with younger stands of pine (previously classed as pulpwood), growing into a larger size class and being reclassified as saw-timber. This means that the volume of saw-timber availability in future will be significantly higher, but pulpwood availability will be diminished. For pellet mill markets any loss in pulpwood availability can be compensated by an increase in sawmill residue production if market demand is maintained or increased.
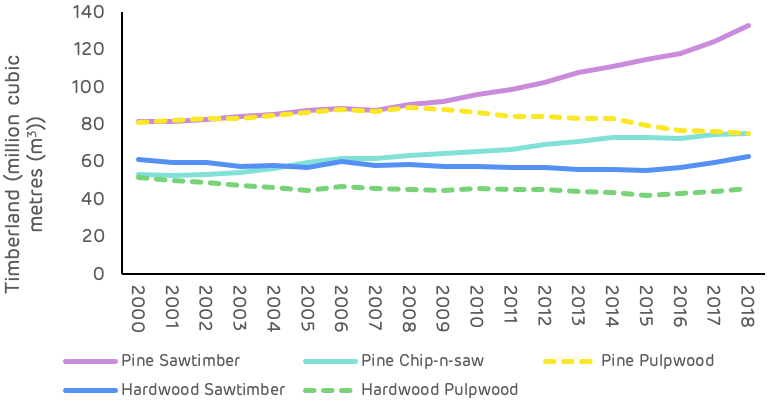
Figure 2: Change in growing stock by major product category and species (USFS)
Growth rates for both softwood and hardwood species have been increasing since 2000 as shown in Figure 3 below. Softwood growth has increased by 18.5% since 2000 and hardwood by 1.4%. The improved softwood growth rate probably resulted from increased investment in the management of pine forests, the superior quality of seedlings and better management practice (ground preparation, weed control, fertilisation etc.). This is a very positive trend for the sequestration rate of carbon and also for providing landowners with the potential to increase revenue per hectare and encourage the retention and improved management of forests, rather than converting to other land uses. The Georgia catchment area is likely split between passive owners that do not actively manage, where growth rates are slower or decline and the incentive to convert land is greater, and owners that actively manage to improve growth and quality, increasing revenue and maintaining productive forest. There is likely to be a much greater differential in growth rate between these two management approaches than reflected by the trend in Figure 3, highlighting the importance of active management for carbon abatement.
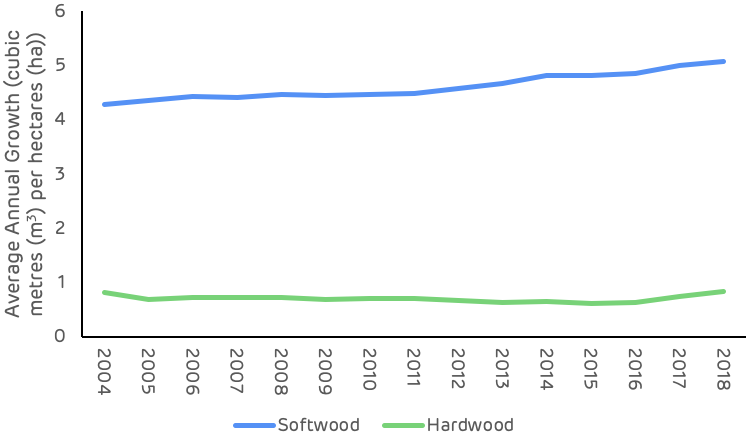
Figure 3: Average annual growth rate per hectare (USFS)
At a macro scale, the distribution of land use categories has remained relatively stable since 2000, with no apparent major shifts in land use. The timberland area around the seven mills has decreased by around 135 thousand hectares (ha) between 2000 and 2018 (2.3% of the total land area), whilst the area of arable and urban land increased by 98 thousand (1.7% of total area) and 158 thousand (2.7% of total area) ha respectively. In 2018, timberland represented 67% of total land area and all forest and woodland 80% of total area, down from 69% and 82% respectively in 2000 (Figure 1).
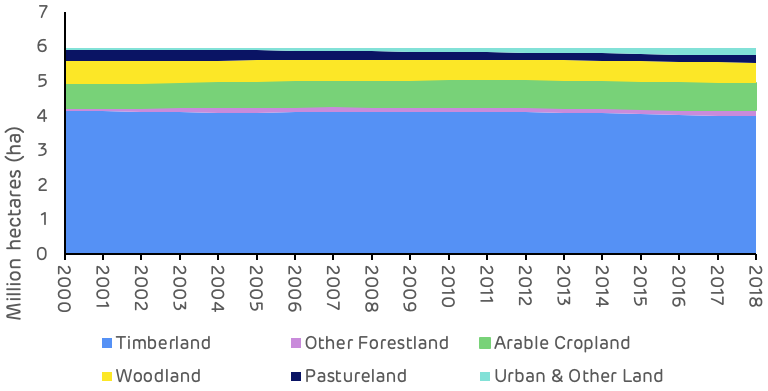
Figure 4: Change in land use category (USDA)
Looking at this change in land use more closely, the timberland area shows the most pronounced decline between 2010 and 2018, a drop of 117 thousand ha. The largest change in other land use categories over this period was an increase of 97 thousand ha in urban and other land, suggesting that a large proportion of the timberland area has been converted to urban areas.
The most significant change in agricultural land occurred prior to 2010, when the timberland area remained relatively stable, this change appears to have involved the transition of pastureland to arable crops. There may also have been some reclassification of forest and woodland types, with a decrease in the area of woodland and an increase in forestland during the period between 2000 and 2010 (Table 2).
Table 2: Timing of land use change in Georgia catchment area (USDA)These trends are also clear and apparent in Figure 3 below which shows the sharp decline in timberland area, albeit small in absolute area relative to the total catchment area size, and the steady increase in urban land. Georgia ranks 8th in the list of US States and territories by total population with 10.6 million and 17th by population density at 184 per square mile (mi2) compared to just 63 per mi2 in Mississippi where Drax’s Amite Bioenergy (ABE) pellet plant is located and 108 per mi2 in Louisiana where the Morehouse Bioenergy (MBE) and LaSalle Bioenergy (LBE) mills are located (US Census Bureau). This population pressure and increased development can lead to more forest loss and land use change.
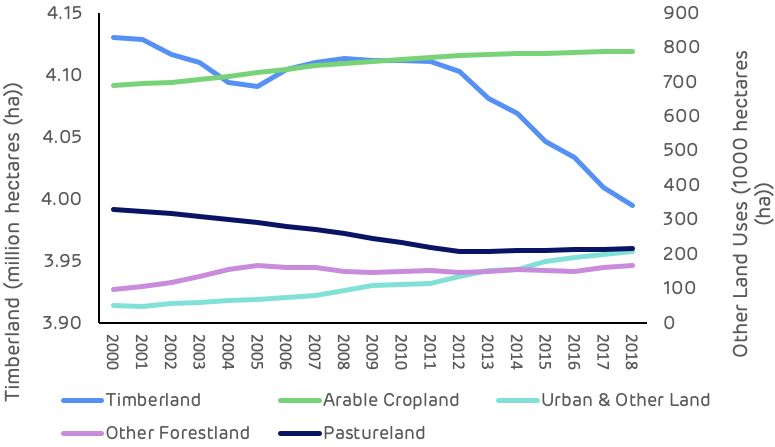
Figure 5: Trends in major land use categories (USDA)
Drax’s suppliers in the Georgia catchment area have made a commitment not to source wood from areas where land use change is taking place. This commitment is monitored and verified through the Sustainable Biomass Program (SBP) certification process that is maintained by each mill. Any land use change in the catchment area is likely to be a result of prevailing economic drivers in the region rather than due to actions being taken by the pellet producers.
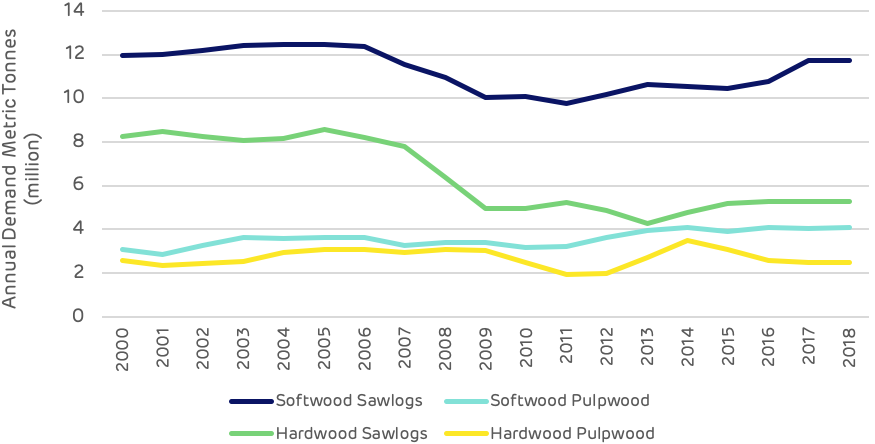
Strong markets are essential for ensuring that forests are managed and restocked to optimum benefit, sawlog markets are particularly important as this is highest revenue stream for forest owners. Figure 6 shows the trend in market demand for each major product category since 2000 and demonstrates the recent increase in softwood sawlog demand as the US economy (particularly housing starts) recovered from the global recession at the end of the last decade. Softwood pulpwood demand increased through the 2000s but has remained relatively stable since 2011, with the exception of a peak during 2018 which resulted from an increase in volume generated by salvage operations after hurricane Michael.
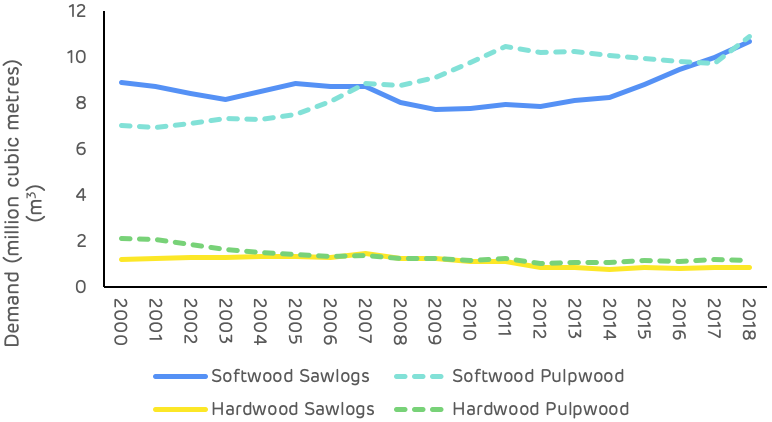
Figure 6: Demand for wood products (USFS, TMS)
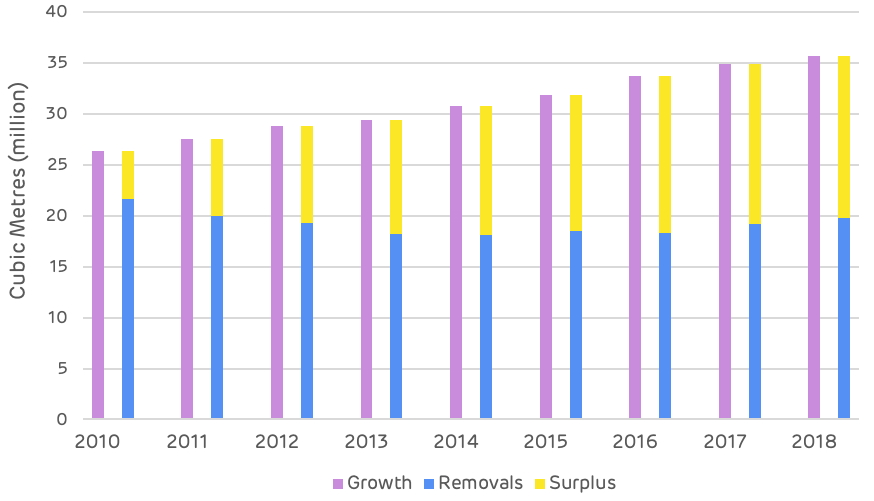
The comparison of average annual growth and removals in the Georgia catchment area is much more tightly balance than in Drax’s other supply regions, as shown in Figure 7. Since 2000 the average annual surplus of growth has been around 3.6 million m3 with both demand and growth increasing in recent years.
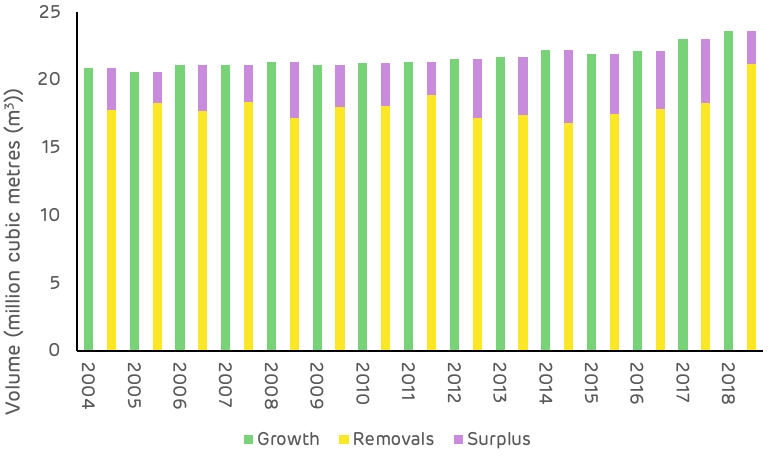
Figure 7: Average annual growth, removals and surplus (USFS)
As shown in Figures 2 & 3, growth rates are strong and inventory is increasing, this is not a problem in the Georgia area. The relatively small surplus, as compared to other catchment areas in the US South, is due to the higher concentration of wood fibre markets and the more intense forest industry activity in this region. As of July 2020, there were over 50 major wood-consuming mills operating within the Georgia catchment area and an additional 80+ mills operating within close proximity, overlapping the catchment area. Total pulpwood demand in 2019 was 12.9 million tons, of which approximately 87% was attributed to non‐bioenergy‐related sources (predominantly pulp/paper) and 13% was attributed to the bioenergy sector. Given the bio-energy sector’s low ranking position in the market (with the lowest ability to pay for fibre), combined with the relatively small scale in demand compared to the pulp and paper industry, the influence of biomass markets can be considered to be minimal in this region, particular when it comes to impacts on wood prices and forest management practice.
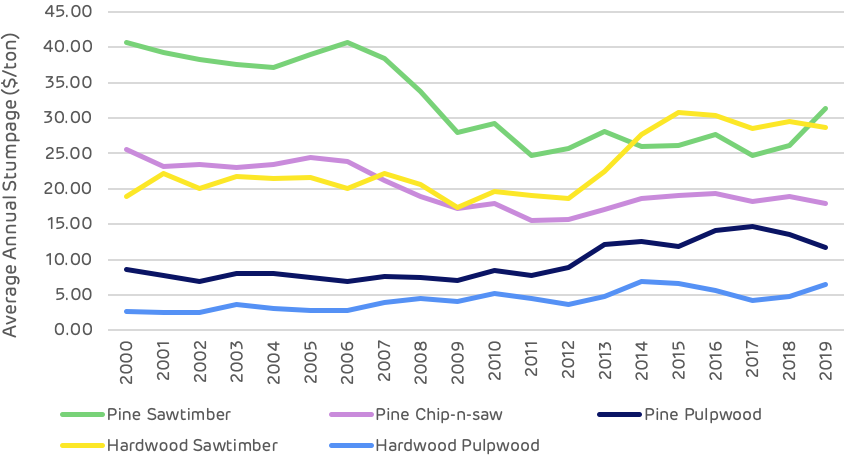
Pine sawtimber prices suffered a significant decline between 2000 and 2010, dropping almost $21 per ton as a result of the global financial crisis and the decline in demand due to the collapse in housing markets and construction (Table 3). Since 2010 pine sawtimber has remained relatively stable, with some minor fluctuations shown in Figure 8 below.
Table 3: Stumpage price trends (TMS)Pine pulpwood prices have been on a generally increasing trend since 2000, with a more significant increase since 2011. This increase does not reflect an increase in demand or total volume, which has remained relatively stable over this period, but a shifting of the geographic distribution of the market with some new mills opening and old mills closing, resulting in increased competition in some localised fibre baskets and leading to an overall increase in stumpage price.
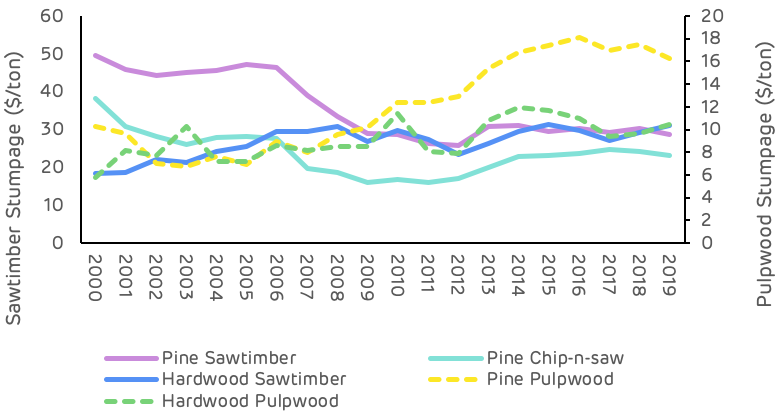
Figure 8: Stumpage price trends (TMS)
Figure 9 below shows that, with the exception of the hurricane salvage volume in 2018, pulpwood removals have declined or remained relatively stable since 2010, whereas pulpwood stumpage prices increased by 41% from 2010 to 2018.
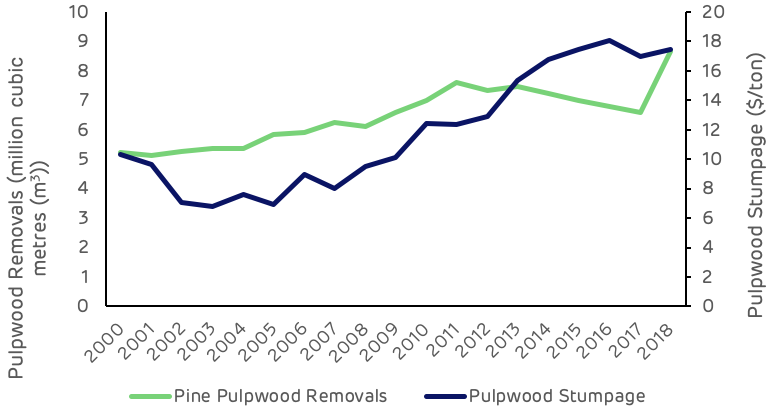
Figure 9: Pulpwood demand and stumpage price (USFS, TMS)
Comparing this stumpage price trend with other catchment areas of the US South (Figure 10), where Drax sources wood pellets, the Georgia area is on average 35% higher than the next highest area (Chesapeake) and 87% higher than the lowest cost area (Amite Bioenergy in Mississippi). This price differential is predominantly due to the scale of demand and availability of surplus low-grade fibre.
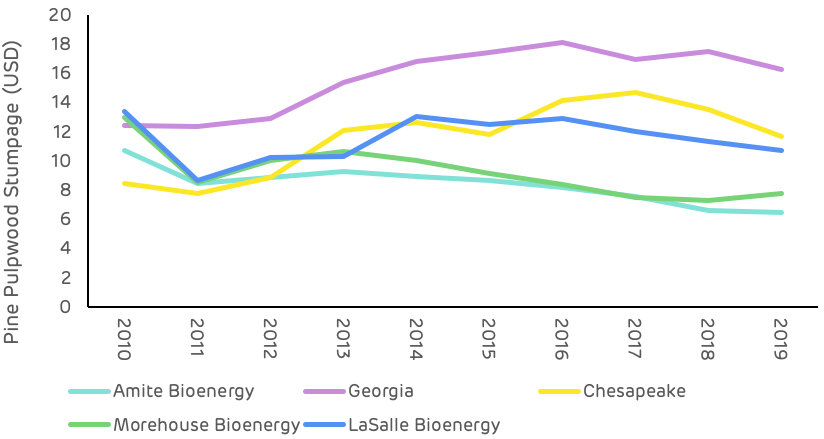
Figure 10: Comparison of pine pulpwood stumpage prices in Drax supply areas US South (TMS)
Deforestation?
No. US Forest Service (USFS) data shows a 108,130-hectare (-2.6%) decrease in total timberland in the Georgia catchment area since Georgia Biomass’ first full year of production in 2012. Specifically, this loss in total area of timberland coincided with a more than 21,000-hectare increase in cropland/pastureland and a more than 73,000-hectare increase in urban land and land classified as having other uses.
However, there is little evidence to suggest that increased wood demand from the bioenergy sector has caused this decrease in total timberland. Furthermore, pine timberland – the primary source of roundwood utilized by the bioenergy industry – has increased more than 17,000 hectares in the catchment area since 2016.
A change in management practices (rotation lengths, thinnings, conversion from hardwood to pine)?
No. Changes in management practices have occurred in the catchment area over the last two decades. However, there is little evidence to suggest that bioenergy demand, which accounts for roughly 10-14% of total pulpwood demand (and only 5-7% of total wood demand in the catchment area), has caused or is responsible for these changes.
Clearcuts and thinnings are the two major types of harvests that occur in this region, both of which are long-standing, widely used methods of harvesting timber. TimberMart-South (TMS) data shows that thinnings accounted for 67% of total reported harvest area in the southeast Georgia market from 2000-2010, but only 43% of total harvest area reported from 2012-2019. Specifically, this downward shift was initiated by the bursting of the US housing bubble in the mid-2000s and had been completed by the early 2010s. We’d like to note that this shift coincided with a nearly 50% decrease in pine sawtimber stumpage price from 2006-2012. This is important because the strength of pine sawtimber markets had been a driving force behind timber management decisions in this region in the early and mid-2000s.
Also, contributing to the decreased prevalence of thinnings was the strengthening of pine pulpwood markets in the mid-2000s, as pine pulpwood stumpage prices increased more than 40% in the Georgia catchment area from 2003-2008. So, with sawtimber markets continuing to weaken and pulpwood markets doing just the opposite, the data suggests that many landowners decided to alter their management approach (to take advantage of strong pulpwood markets) and focus on short pulpwood rotations that typically do not utilize thinnings.
Ultimately, the shift in management approach that occurred in this market can be linked to the weakening of one type of timber market and the strengthening of another. In the early and mid-2000s, timber management was focused on sawtimber production – a type of management that utilizes thinnings. However, for more than a decade now, this market has been driven to a large degree by the pulp/paper industry, with a significant portion of the timber management in this area focused on short pulpwood rotations.
Diversion from other markets?
No. Demand for softwood (pine) sawlogs increased an estimated 39% in the Georgia catchment area from 2011-2019. Also, increased bioenergy demand has caused no diversion from other pulpwood markets (i.e. pulp/paper), as pulpwood demand not attributed to bioenergy held steady and remained nearly unchanged from 2012-2017 before increasing in 2018 and 2019 due to the influx of salvage wood brought about by Hurricane Michael.
We’d like to make special note that increased demand for softwood sawlogs since 2011 has not resulted in a full pine sawtimber (PST) stumpage price recovery in this market. Reduced demand for softwood sawlogs in the late 2000s and early 2010s resulted in oversupply, and this oversupply has remained, despite increased demand the last 6-8 years. As a result, PST stumpage prices have held steady and averaged roughly $30 per ton in the catchment area since 2013 – down approximately 35% from the 2000-2006 average of more than $46 per ton, but up roughly 15% from the 2011-2012 average of approximately $26 per ton.
An unexpected or abnormal increase in wood prices?
No / Inconclusive. The delivered price of pine pulpwood (PPW) – the primary roundwood product consumed by both Georgia Biomass and Fram – increased 26% in the Georgia catchment area over the six years directly following the startup of Georgia Biomass, increasing from $29.16 per ton in 2011 to $36.63 per ton in 2017. And while this 26% increase in delivered PPW price coincided with a roughly 1.1 million metric ton increase in annual pine pulpwood demand from Georgia Biomass and Fram, total demand for pine pulpwood (from both bioenergy and other sources) actually decreased 7% over this period. Moreover, evidence suggest that this increase in PPW price is more closely linked to changes in wood supply, specifically, the 9% decrease in PPW inventory from 2011-2017.
However, there is evidence that links increased demand from the bioenergy sector to an increase in secondary residual (i.e. sawmill chips, sawdust, and shavings) prices. Specifically, the price of pine sawmill chips – a residual feedstock utilized by the bioenergy industry for wood pellet production – held steady and averaged approximately $26 per ton in the Georgia catchment area from 2008-2012. However, from 2012-2016, pine sawmill chip prices increased more than 15% (to $29.55 per ton in 2016). This increase in price coincided with annual pine residual feedstock purchases by Georgia Biomass and Fram increasing from roughly 325,000 metric tons to nearly 1.0 million metric tons over this period. However, note that pine sawmill chip prices have held steady and averaged roughly $29.50 per ton in the catchment area since 2016, despite further increases in pine secondary residual purchases by Georgia Biomass and Fram (to more than 1.2 million metric tons in 2019).
Ultimately, the data suggests that any excess supply of pine secondary residuals in the catchment area was absorbed by the bioenergy sector in the early and mid-2010s, and the additional demand/competition placed on this market led to increased residual prices. However, the plateauing of residual prices since 2015 along with the continued increase in secondary residual purchases by Georgia Biomass and Fram further suggest that an increasing percentage of secondary residual purchases by the bioenergy sector is sourced from outside the catchment area. Specifically, Fram confirmed this notion, noting that 35-40% of its secondary residual purchases come from outside the Georgia catchment area (from six different states in the US South).
A reduction in growing stock timber?
No. Total growing stock inventory in the catchment area increased 11% from 2011 through 2018, the latest available. Specifically, over this period, inventories of pine sawtimber and chip-n-saw increased 35% and 13%, respectively. However, pine pulpwood inventory decreased 11% from 2011-2018.
Note that the decrease in pine pulpwood inventory was not due to increased demand from bioenergy (or other sources) or increased harvesting above the sustainable yield capacity of the forest area – as annual growth of pine pulpwood has exceeded annual removals every year since 2011. Rather, this decrease can be linked to the 24% decline in pine sawtimber removals that occurred from 2005-2014 (due to the bursting of the US housing bubble and Great Recession that followed). In this region, timber is typically harvested via clearcut once it reaches maturity (i.e. sawtimber grade), after which the stand is reestablished, and the cycle repeated. However, with the reduced harvest levels during this period also came a reduction in newly reestablished timber stands – the source of pine pulpwood. So, with less replantings occurring during this period, inventories of pine pulpwood were not replenished to the same degree they had been previously, and therefore this catchment area saw a reduction in pine pulpwood inventory levels.
However, according to the US Forest Service, annual removals of pine sawtimber have increased 50% in the Georgia catchment area since 2014, which would suggest higher clearcut levels and increased stand reestablishment. TimberMart-South data also supports this assertion, as clearcut harvests have constituted approximately 60% of the total harvest area reported to TimberMart-South in this region since 2014, compared to 40% from 2005-2014. Ultimately, these increases in clearcut (and stand reestablishment) levels may not be reflected in increased pine pulpwood inventory levels in the short term – as it can take more than 10 years for a pine seedling to become merchantable and reach the minimum diameter requirements to be classified as pulpwood. However, adequate supply levels are expected to remain in the meantime. Furthermore, pine pulpwood inventory levels are expected to increase in the mid-to-long terms as a result of the increased harvest levels and stand reestablishment levels that have occurred in the catchment area since 2014.
A reduction in the sequestration rate of carbon?
No / Inconclusive. US Forest Service data shows the average annual growth rate of total growing stock timber has remained nearly unchanged (holding between 6.0% and 6.1%) in the catchment area since 2011, which would suggest that the sequestration rate of carbon has also changed very little in the catchment area the last 8-10 years. However, the 11% increase in total growing stock inventory since 2011 does indicate that total carbon storage levels have increased in the Georgia catchment area since Georgia Biomass commenced operations in this market.
An increase in harvesting above the sustainable yield capacity of the forest area?
No. Growth-to-removals (G:R) ratios, which compare annual timber growth to annual harvests, provides a measure of market demand relative to supply as well as a gauge of market sustainability. In 2018, the latest available, the G:R ratio for pine pulpwood, the predominant timber product utilized by the bioenergy sector, equaled 1.06 (a value greater than 1.0 indicates sustainable harvest levels). Note, however, that the pine pulpwood G:R ratio averaged 1.44 from 2012-2017. The significant drop in 2018 was due to a 31% increase in removals (due to Hurricane Michael) and is not reflective of the new norm. Specifically, pine pulpwood removals are projected to be more in line with pre-2018 levels in 2019 and 2020, and so too is the pine pulpwood G:R ratio.
Timber growing stock inventory
Neutral. According to USFS data, inventories of pine pulpwood decreased 11% in the catchment area from 2011-2018. However, that decrease was not due to increased demand from bioenergy. Typically, a reduction in inventory is linked to harvest levels above the sustainable yield capacity of the forest area, but in this case, annual growth of pine pulpwood exceeded annual removals every year during this period.
Ultimately, the decrease in pine pulpwood inventory from 2011-2018 can be linked to decreased pine sawtimber production beginning in the mid-2000s. Specifically, annual removals of pine sawtimber decreased 24% from 2005-2014, and the reduction in harvest levels during this period meant fewer new pine stands were reestablished, and that has led to the current reduction in pine pulpwood inventory. (Note that the decrease in pine sawtimber removals from 2005-2014 was mirrored by a 27% increase in pine sawtimber inventory over this same period). However, USFS data shows that annual removals of pine sawtimber have increased 50% in the Georgia catchment area since 2014, which suggests that pine pulpwood inventory levels will start to increase in the catchment area due to increased harvest levels and the subsequent increase in stand reestablishment levels.
Timber growth rates
Neutral. Timber growth rates have increased for both pine sawtimber and pine chip-n-saw but decreased slightly for pine pulpwood in the catchment area since 2011. Evidence suggests that this decrease in pine pulpwood growth rate is not due to increases in bioenergy demand, but rather linked to changes in diameter class distribution and indicative of a forest in a state of transition, where timber is moving up in product class (i.e. pine pulpwood is moving up in classification to pine chip-n-saw).
Forest area
Neutral. In the Georgia catchment area, total forest area (timberland) decreased more than 115,000 hectares (-2.8%) from 2011 through 2018. Note that this decrease coincided with a roughly 19,000-hectare increase in cropland and 93,000-hectare increase in urban land and land classified as having other uses.
Specifically, pine timberland, the primary source of roundwood utilized by the bioenergy industry, decreased over 34,000 hectares from 2011-2016. However, from 2016-2018, pine timberland stabilized and rather increased more than 17,000 hectares in the catchment area (or a net decrease of roughly 17,000 hectares from 2011-2018). Ultimately, there is little evidence that the decrease in pine timberland from 2011-2016 or increase since 2016 is linked to increased bioenergy demand. Rather, the overall decrease in pine timberland since 2011 appears to be more closely linked to the relative weakness of pine sawtimber markets in the Georgia catchment area and the lack of return from sawtimber.
Wood prices
Positive / Negative. Intuitively, an increase in demand should result in an increase in price, and this is what the data shows in the Georgia catchment area as it relates to increased biomass demand from Georgia Biomass and Fram and the prices of the various raw materials consumed by these mills. Specifically, the 1.4-million metric ton increase in softwood pulpwood demand attributed to Georgia Biomass and Fram coincided with a 20% increase in delivered pine pulpwood price and a 10-15% increase in pine chip prices from 2011-2015. Since 2015, biomass demand has held relatively steady, and, overall, so too have delivered pine pulpwood and pine chip prices. The apparent link between increased bioenergy demand and increased pine raw material prices is supported further by statistical analysis, as strong positive correlations were found between softwood biomass demand and both delivered pine pulpwood and pine chip prices. However, note that biomass demand alone is not responsible for these changes in prices, as softwood biomass demand accounts for only 10-15% of total softwood pulpwood demand in the catchment area. Rather, the prices of these raw materials are impacted to a larger degree by demand from other sources (i.e. pulp/paper), which accounts for 85-90% of total softwood pulpwood demand in the Georgia catchment area.
On the other hand, it’s also important to note that the increase in bioenergy-related wood demand has been a positive for forest landowners in the Georgia catchment area. Not only has bioenergy provided an additional outlet for pulpwood in this market, but the increase in pulpwood prices as a result of increased pulpwood demand has transferred through to landowners (improved compensation). Specifically, since 2015, pine pulpwood (PPW) stumpage price – the price paid to landowners – has averaged more than $17 per ton in the Georgia catchment area. This represents a 70% increase over the approximately $10 per ton averaged by PPW stumpage in the catchment area over the last five years prior to Georgia Biomass’ startup in 2Q 2011.
(Note: Pine pulpwood stumpage prices are notably higher in the Georgia catchment area due to a much tighter balance in supply and demand (in comparison to most other markets across the US South). For instance, in all other areas across the US South2, PPW stumpage prices have averaged less than $9 per ton since 2015, or roughly half that of prices in the Georgia catchment area).
Markets for solid wood products
Positive. In the Georgia catchment area, demand for softwood sawlogs used to produce lumber and other solid wood products increased an estimated 39% from 2011-2019, and by-products of the sawmilling process are sawmill residuals – materials utilized by Georgia Biomass and the Fram mills to produce wood pellets. With the increased production of softwood lumber, so too has come an increase in sawmill residuals, some of which have been purchased/consumed by Georgia Biomass and Fram. Not only have these pellet producers benefited from the greater availability of this by-product, but lumber producers have also benefited, as the Georgia Biomass and Fram mills have provided an additional outlet for these producers and their by-products.
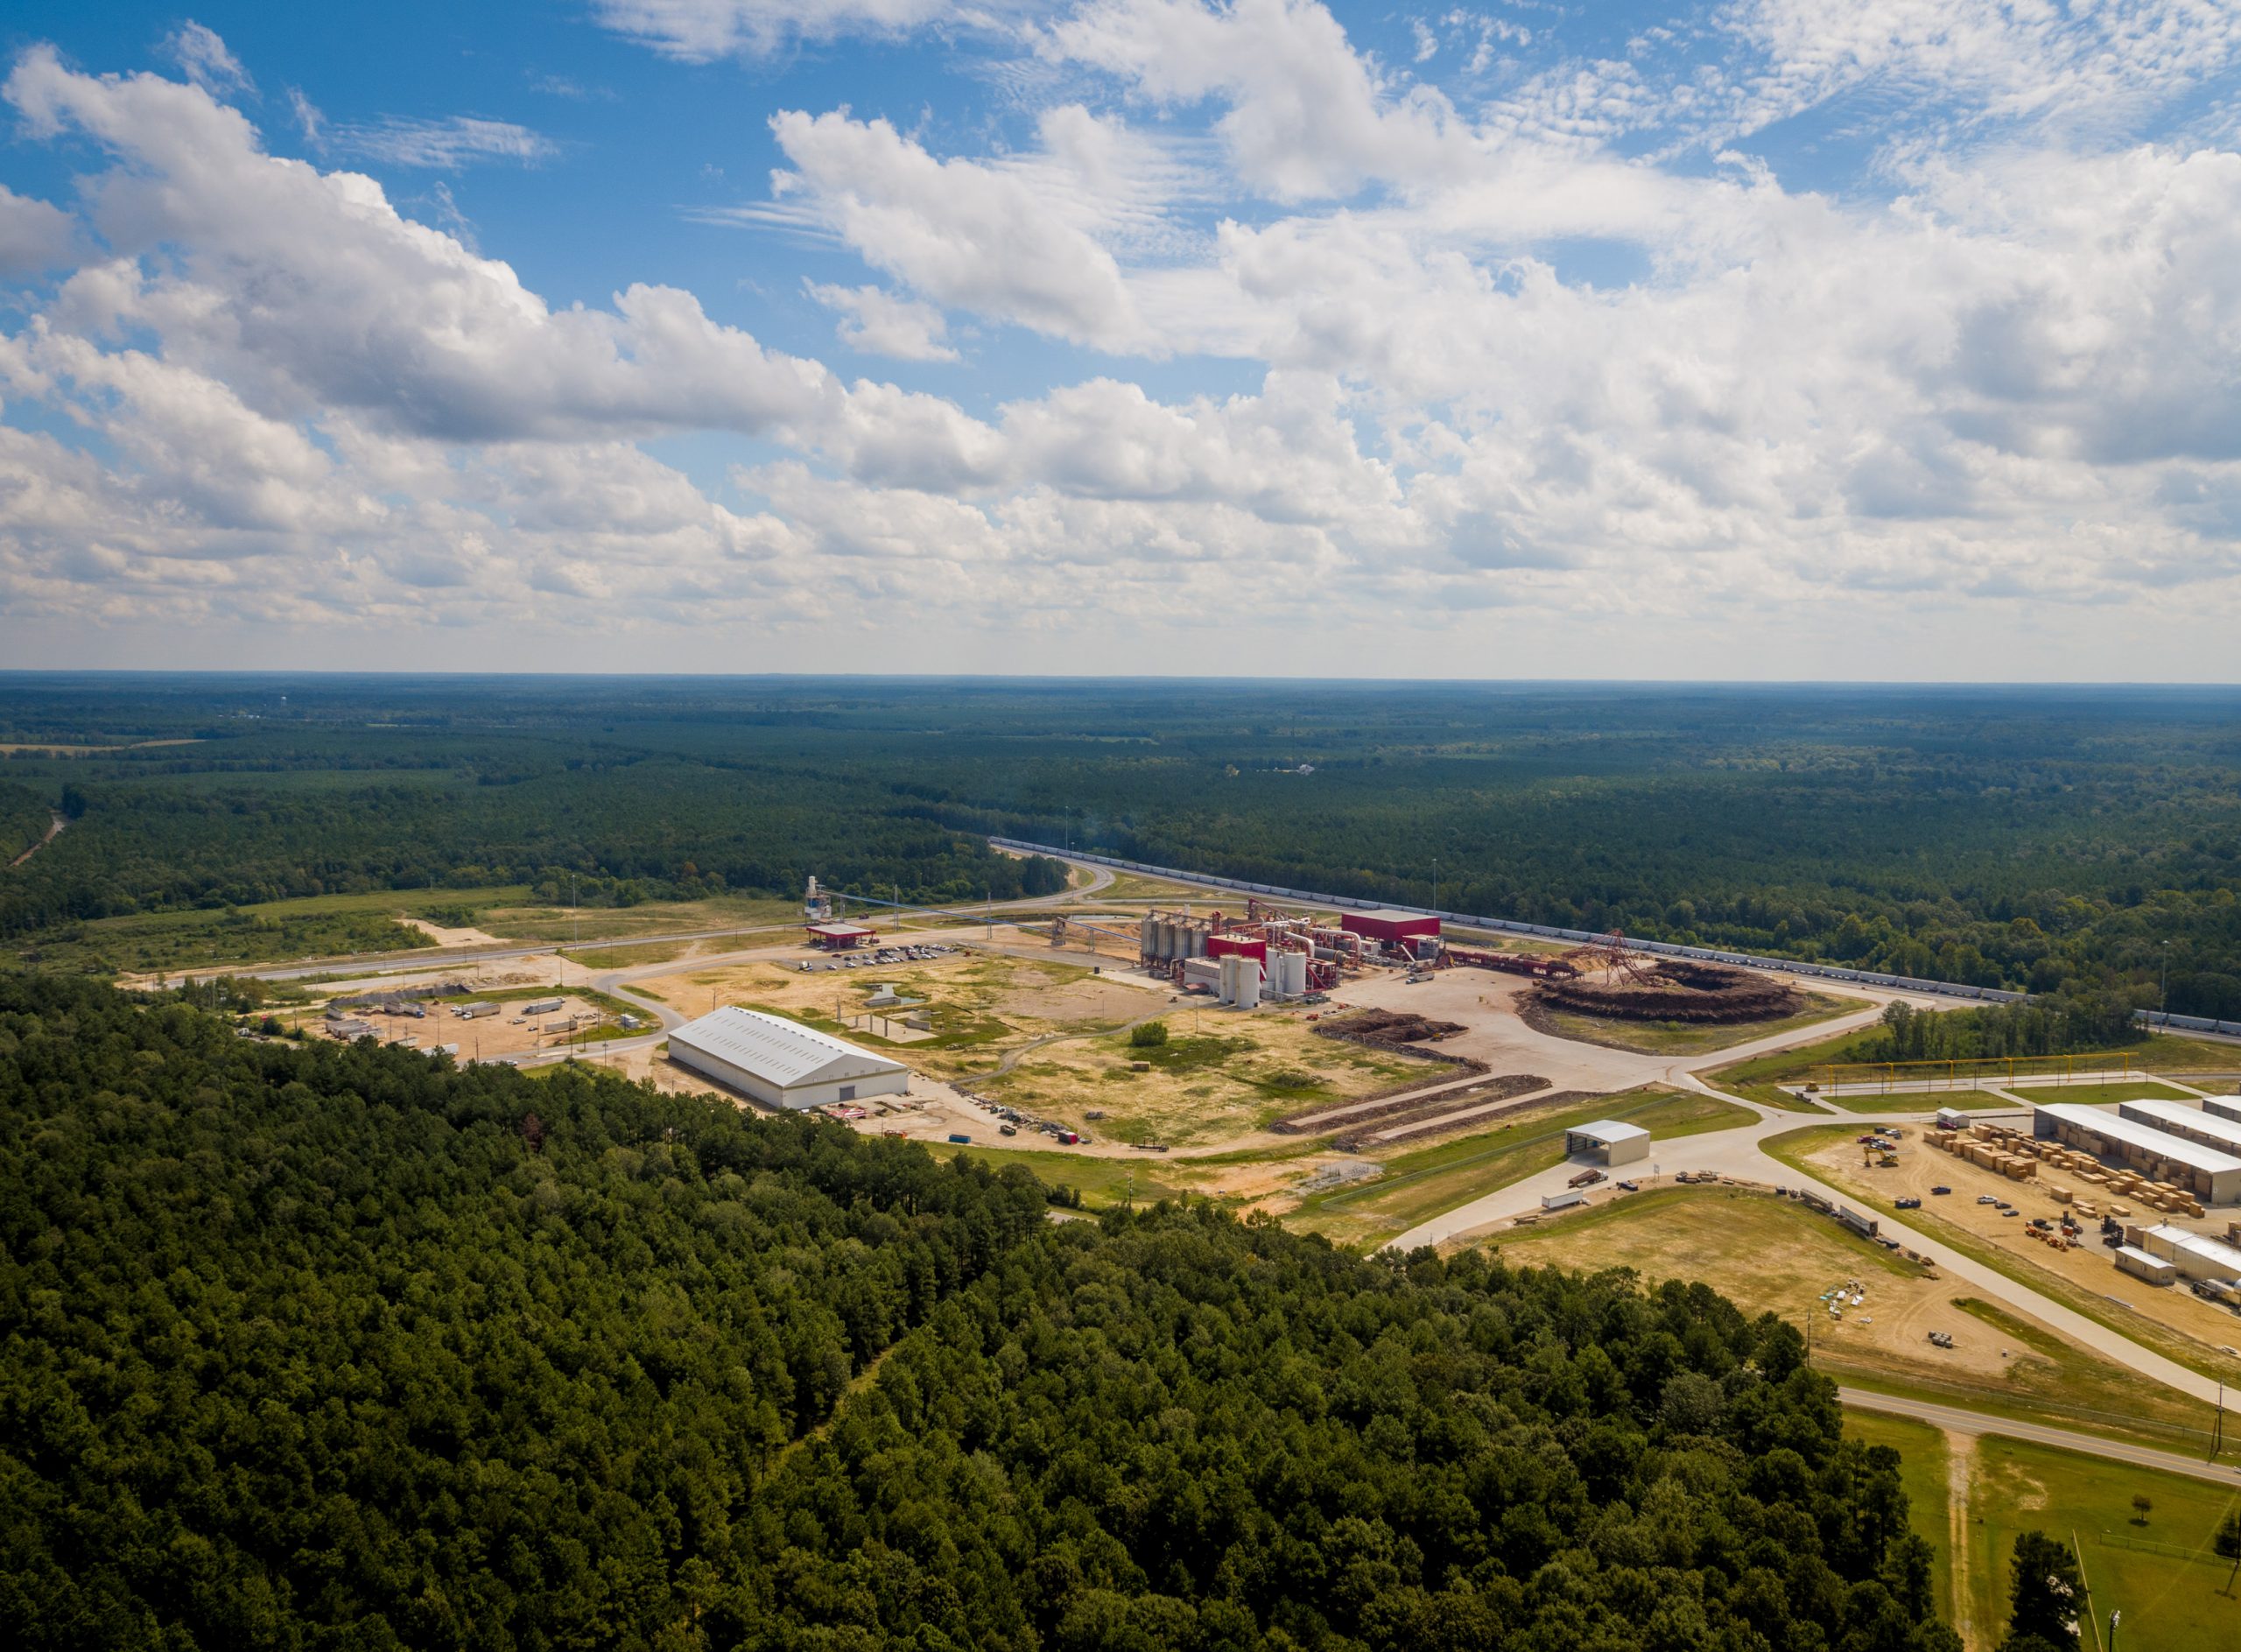
The wood supply catchment area for Drax’s LaSalle BioEnergy biomass pellet plant in mid-Louisiana is dominated by larger scale private forest owners that actively manage and invest in their forest for saw-timber production. Eighty-three per cent (83%) of the forest is in private ownership and 60% of this area is in corporate ownership.
The Drax Biomass pellet mill uses just 3.2% of the roundwood in the market and therefore has limited impact or influence on the overall trends. By contrast, the pulp and paper industry consumes 74% of the total pulpwood demand as the most dominant market for low grade fibre.
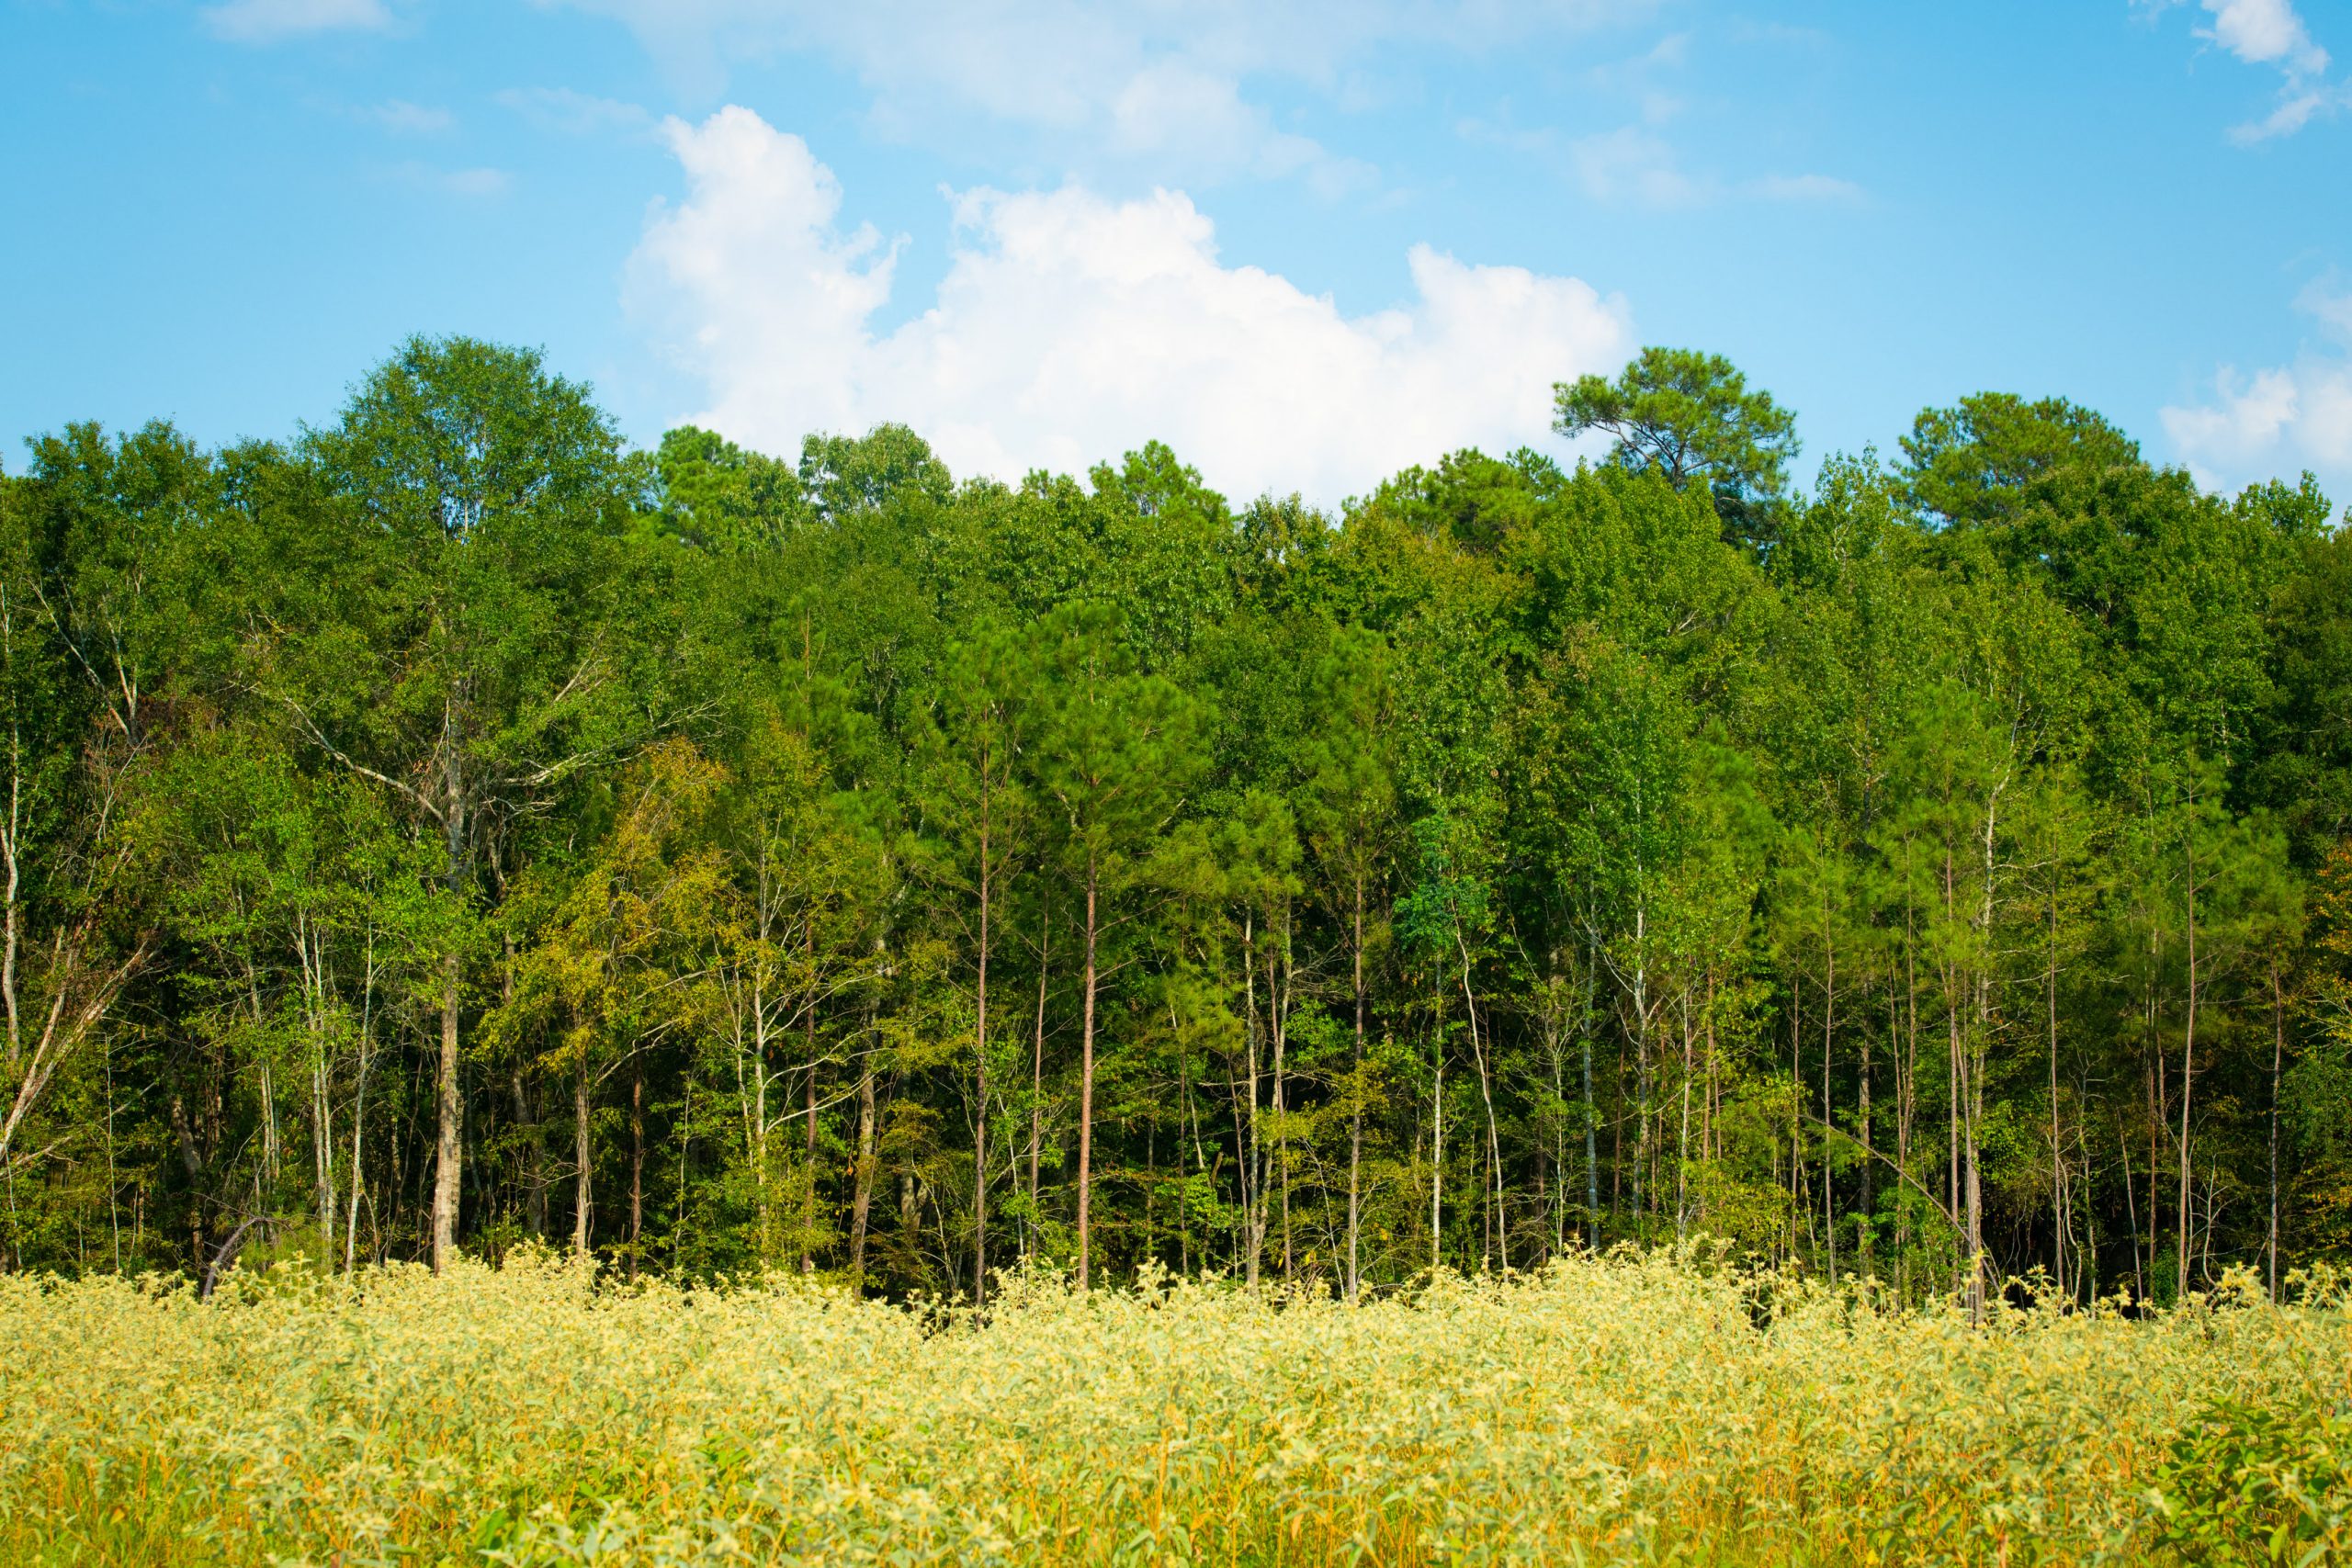
Forest in LaSalle catchment area
The catchment area has seen an increase in total timberland area of 71 thousand hectares (ha) since 2008, this is primarily due to planting of previously non-stocked land. Hardwood areas have remained stable but planted pine has increased, replacing some of the naturally regenerated mixed species areas. The data below shows that deforestation or conversion from pure hardwood to pine is not occurring.
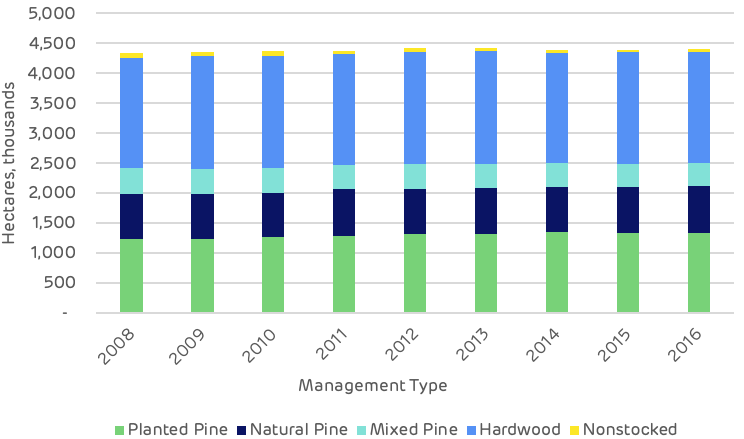
Timberland area by management type
The overall quantity of stored carbon, or the inventory of the standing wood in the forest, has increased by 7% or 32.6 million metric tonnes since 2008. This total is made up of a 49 million tonne increase in the quantity of pine and a 16 million tonne decline in the quantity of hardwood. Since the area of pure hardwood forest has remained stable, this decline is likely to be due to the conversion of mixed stands to pure pine in order to increase saw-timber production and to provide a better return on investment for corporate owners.
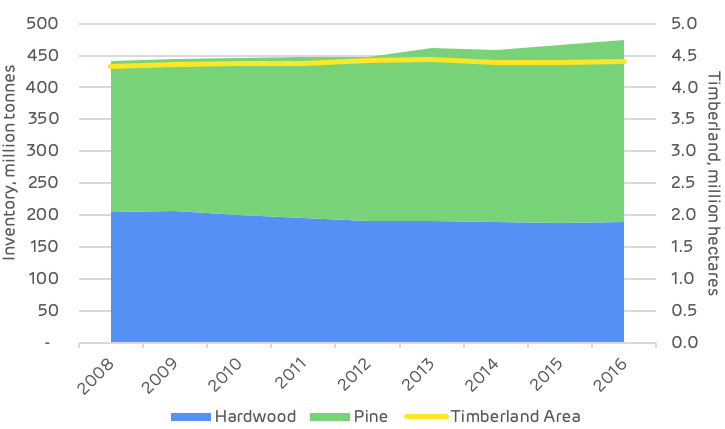
Historic area and timberland inventory
Forest in LaSalle catchment area
The growth-to-drain ratio and the surplus of unharvested pine growth has been increasing year-on-year from two million tonnes in 2008 to over five million tonnes in 2016.
This suggests that the LaSalle BioEnergy plant (which almost exclusively utilises pine feedstocks) has not had a negative impact on the growth-to-drain ratio and the surplus of available biomass.
The latest data (2016) indicates that the ratio for pine pulpwood is 1.54 and for pine saw-timber 1.24 and that this has been increasing each year for both categories.
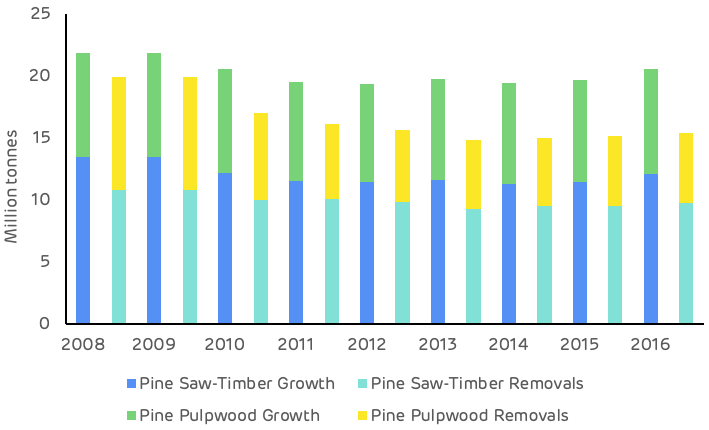
Historic growth and removals by species
Stumpage prices for all product categories declined between 2010 and 2011. This was followed by a peak around 2015-16 with the recovery in demand post-recession and prices then stabilised from 2016 to 2019. The data indicates that there has been no adverse impact to pine pulpwood prices as a result of biomass demand. In fact, pine pulpwood prices are now nearly 20% lower than in 2014 as shown on the chart below.
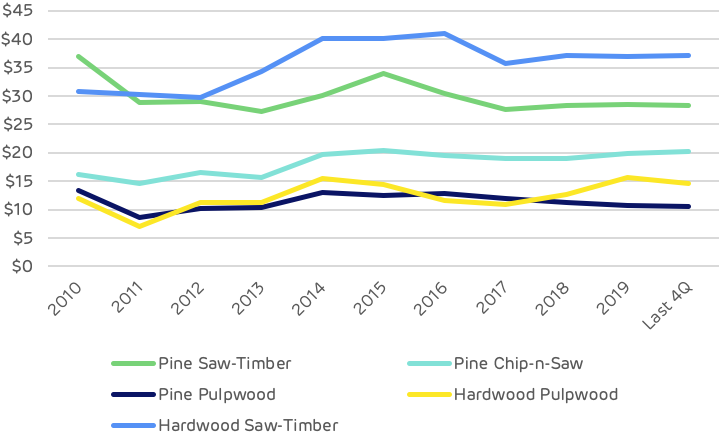
LaSalle BioEnergy market historic stumpage prices, USD$:tonne
The character of the pine timberland is one of a maturing resource, increasing in the average size of each tree. The chart below chart shows a significant increase in the quantity of timber in the mid-range size classes, indicating a build-up of future resources for harvesting for both thinning and final felling for sawtimber production.
With balanced market demand, the supply of fibre in this catchment area should remain plentiful and sustainable in the medium term.
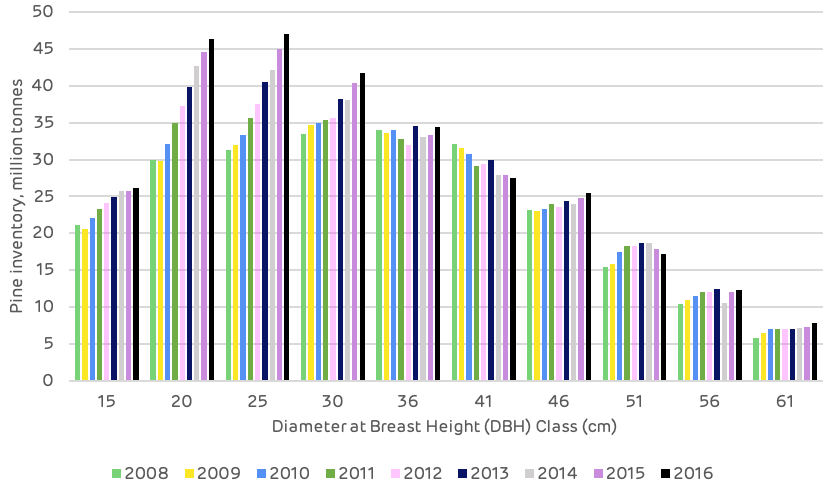
Historic pine inventory by DBH (diameter at breast height) class
Deforestation
No
Change in forest management practices
No
Diversion from other markets
Possibly. Bioenergy plants compete with pulp/paper and oriented strand board (OSB) mills for pulpwood and residual feedstocks. There is no evidence that these facilities reduced production as a result of bioenergy markets, however.
Increase in wood prices
No. There is no evidence that bioenergy demand increased stumpage prices in the market.
Reduction in growing stock of timber
No
Reduction in sequestration of carbon / growth rate
No
Increase in harvesting above the sustainable yield
No
Growing stock
Neutral
Growth rates
Neutral
Forest area
Neutral
Wood prices
Neutral
Markets for solid wood
Neutral to Positive. Access to viable residual markets benefits users of solid wood (i.e. lumber producers).
Forest in LaSalle catchment area
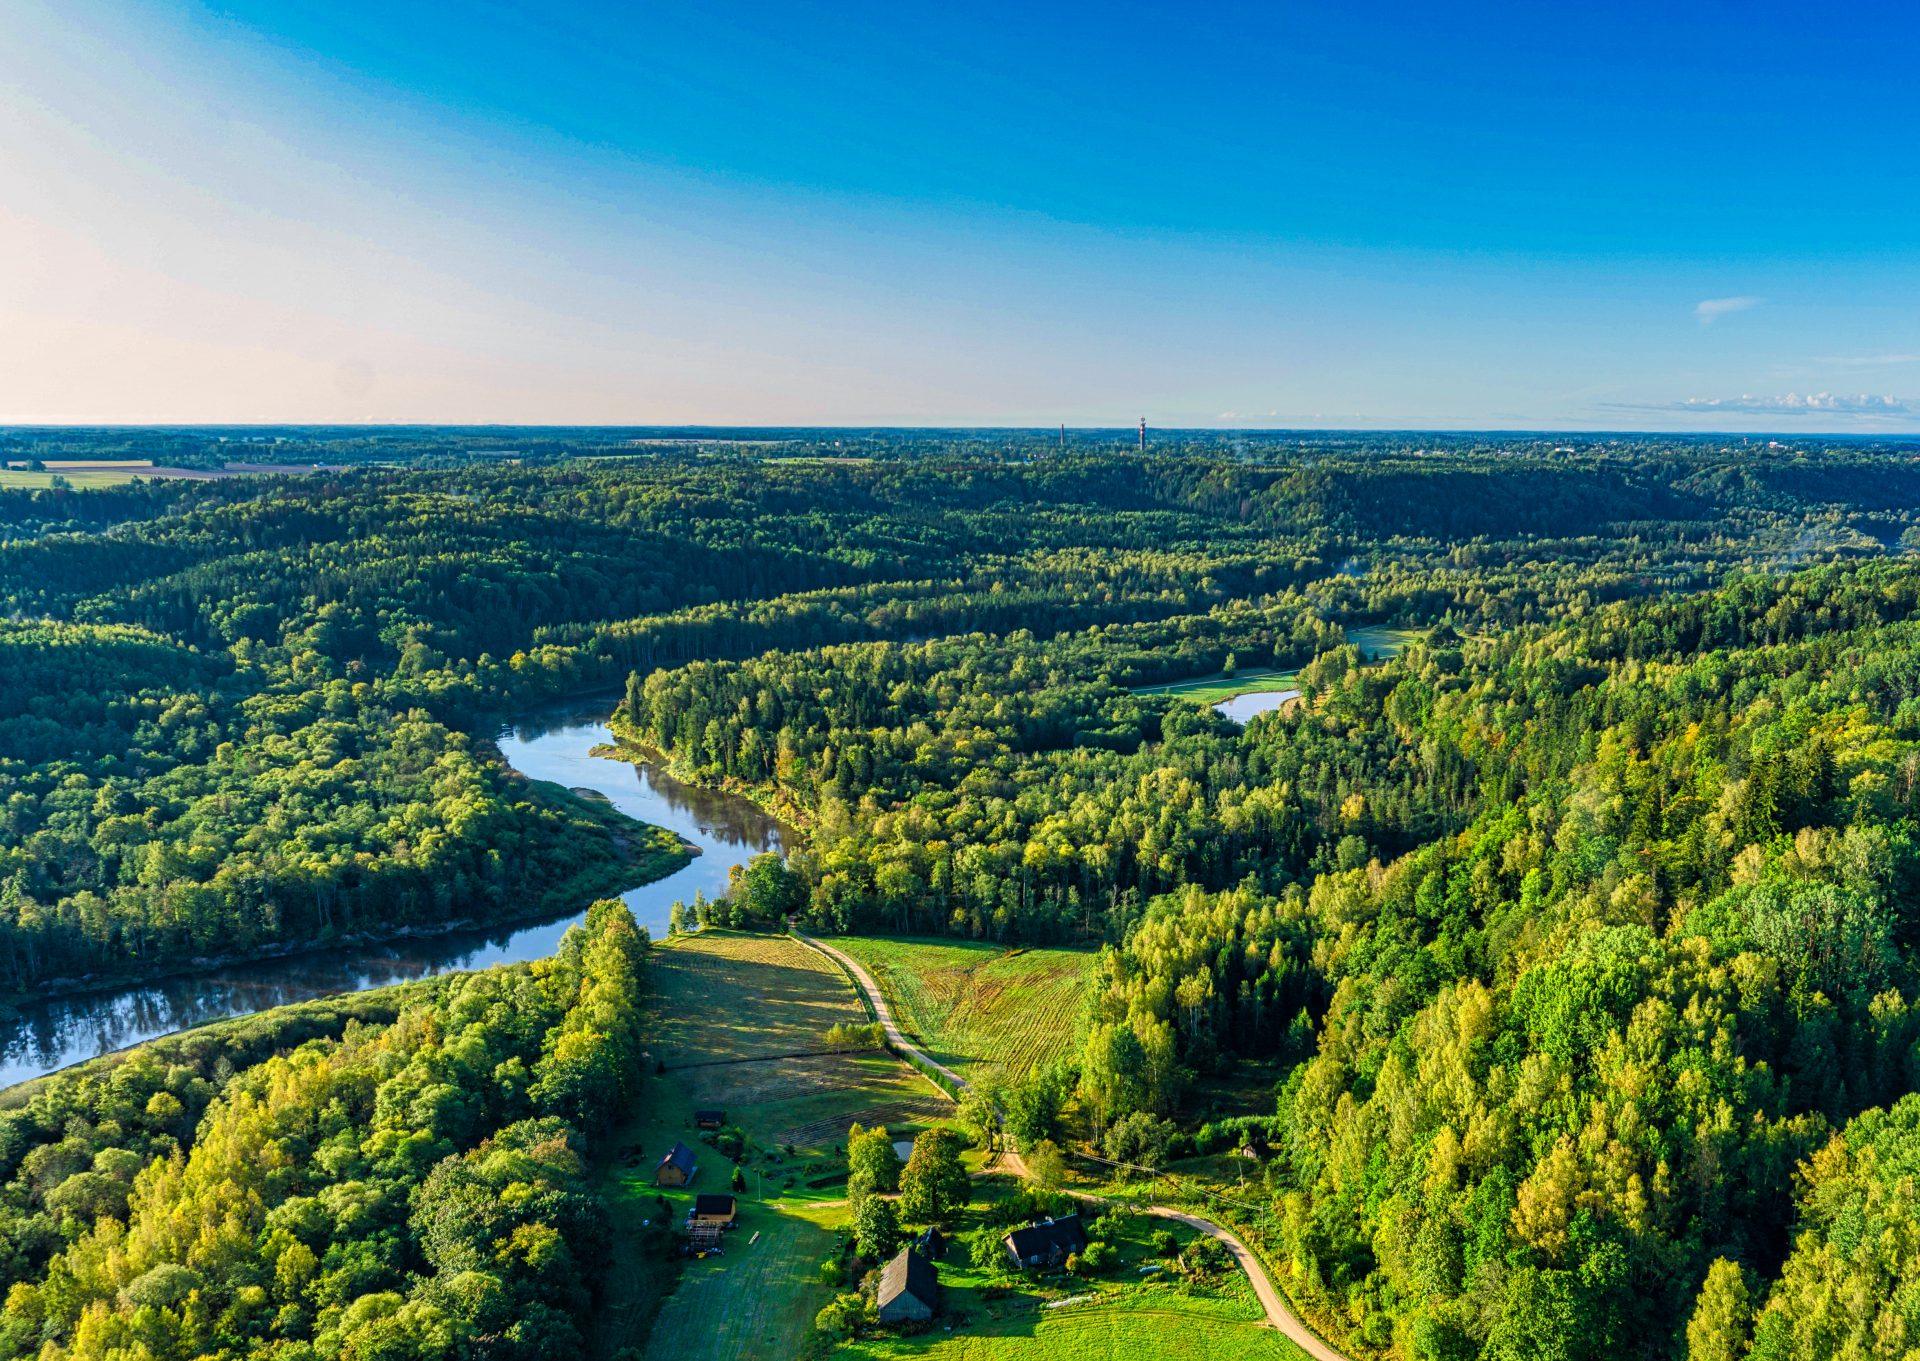
Latvia is a heavily forested small country (about half the size of England), with 52% forest cover totalling 3.54 million ha (2.7 times bigger than the forest area in England and 11% bigger than the entire UK).
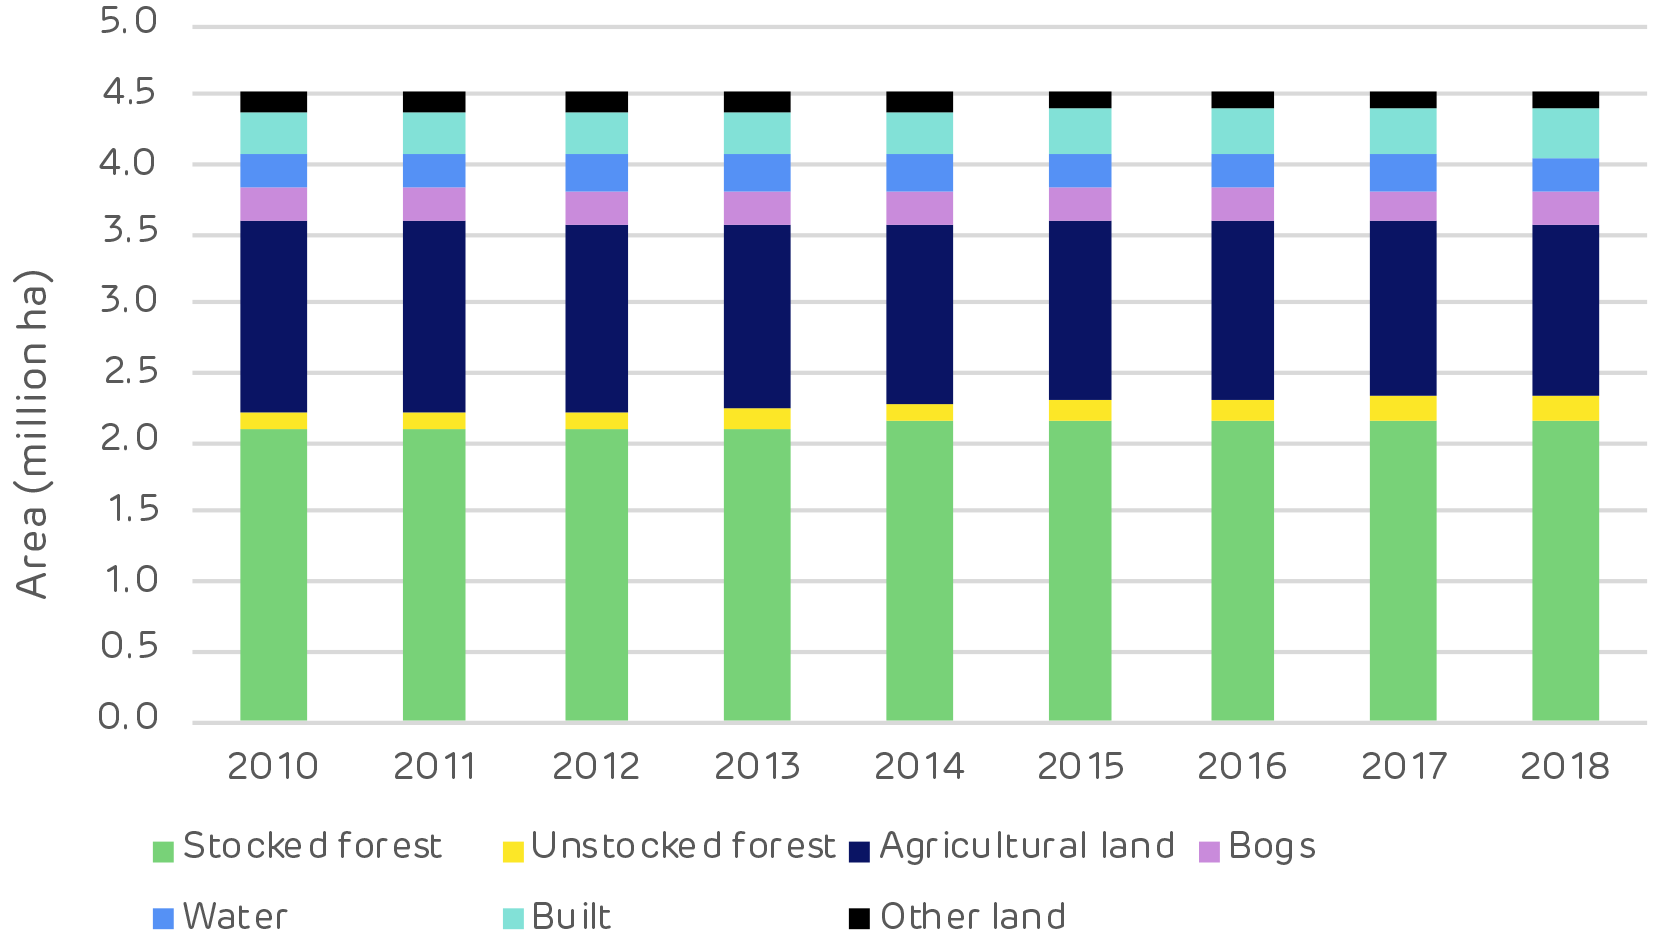
There has been an increase of around 400,000 hectares (ha) of forest in Latvia since 2000. This is due to natural afforestation of abandoned agricultural lands and also to an improvement in forest inventory analysis in 2009 which provided a more accurate assessment of land use and forestry data. Since 2010, the forest area has increased by 55,000 ha. There is no evidence of deforestation.
Primary land use Latvia
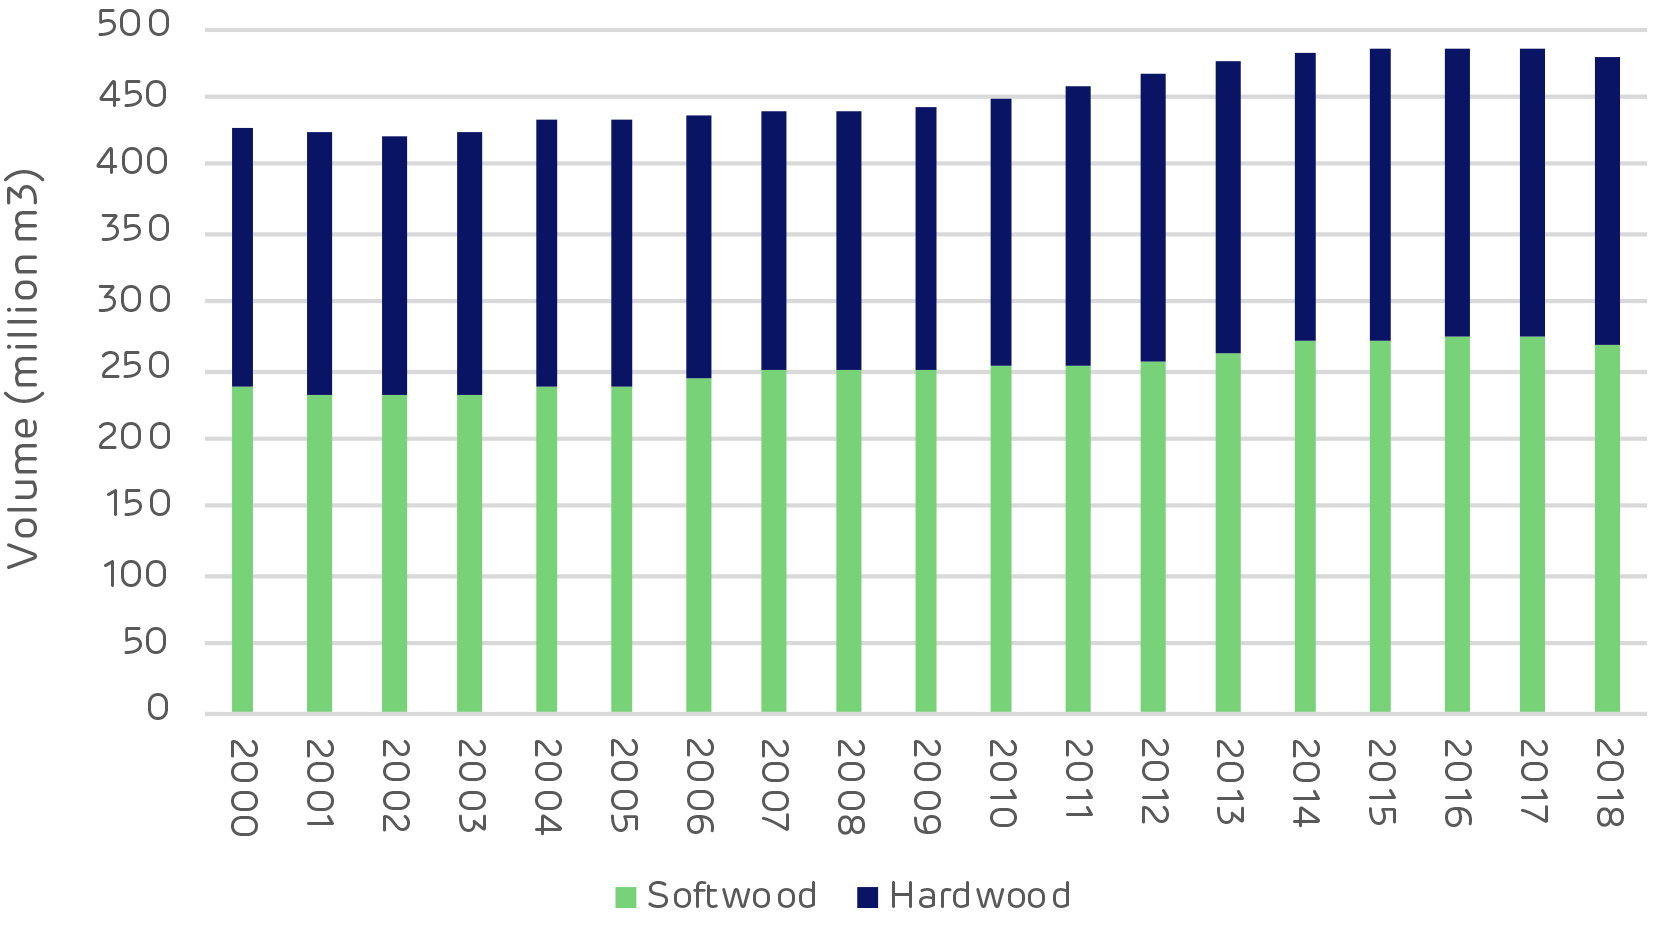
There has also been a substantial increase in forest carbon or growing stock. This increased by 106 million cubic metres (m3) since 2000 (75% hardwood) and by 33 million m3 since 2010 (57% hardwood).
Increase in forest carbon
A proportion of the increase in hardwood volume in 2009 was due to the improvement of forest inventory calculations but also due to increased natural regeneration on unutilised land. The hardwood forest in Latvia and the Baltic region is quite different to that of the US South. In the Baltics there is prolific hardwood regeneration (birch, alder and aspen) which grows quite rapidly.
There are limited markets for structural timber, therefore hardwoods produce a lot of low-grade wood fibre. There are no domestic pulp markets in Latvia and only limited markets for panel board. Therefore, much of the low-grade wood fibre can only be used for firewood and biomass. The chart below shows a minor change in species composition from planted pine to naturally regenerated spruce and aspen – the most prolific regenerators in this region.
Varied species mix
State owned forests have a higher proportion of planted forest areas compared to the private sector where natural regeneration is preferred due to lower costs. Planting allows the owner to control the species mix, quality and growth. Whereas regeneration can be more of a lottery for both quality and species mix. As more corporate owners emerge, planting with improved stock may increase.
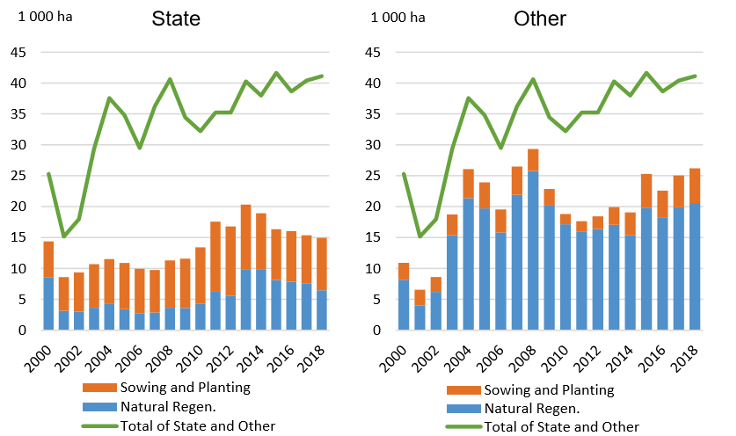
Restocking practice by ownership category
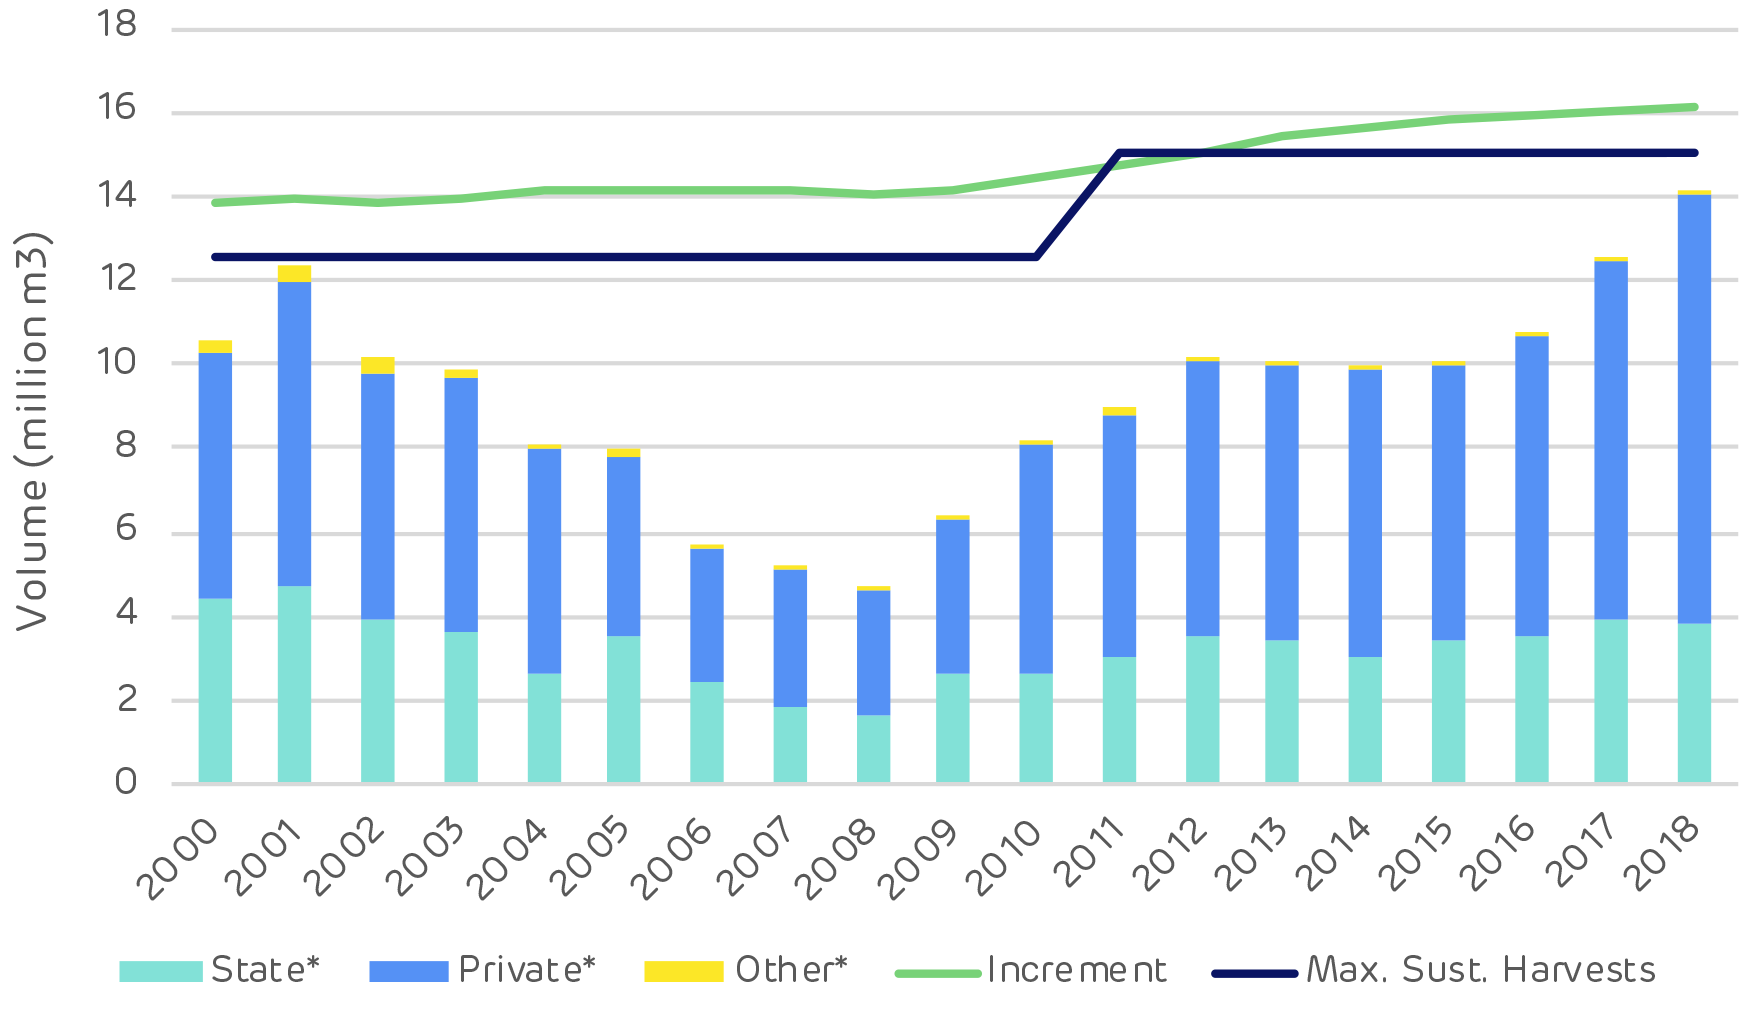
Harvesting levels have been consistently below net annual increment since 2000. There have been some fluctuations in the annual allowable cut in State forests, particularly following the global financial crisis in 2008.
Harvesting in the private sector declined due to falling prices and sawnwood production dropped by 42% in 2009 compared to 2006. During that period, State-owned forest increased harvesting in order to support the industry in the absence of strong markets and private sector supply.
Post-recession, the harvesting balance returned and demand for wood products increased. The current surplus of growth compared to removals is around 5.5 million m3 p.a. or a growth drain ratio of 1.6.
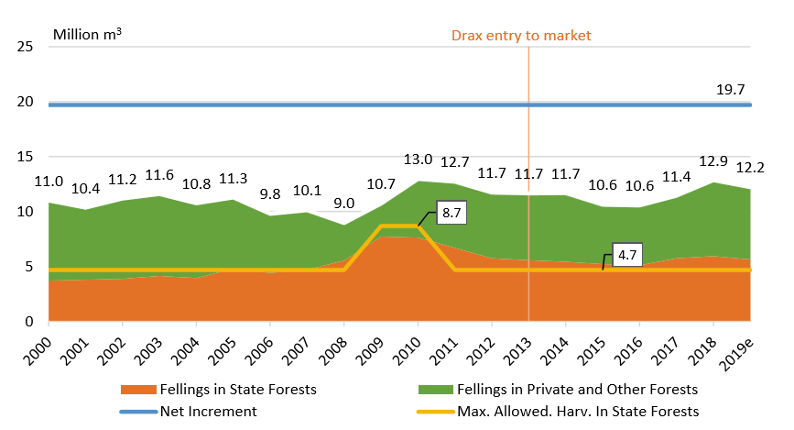
Surplus of growth compared to removals
Increasing wood pellet exports have had limited impact on wood prices. The feedstock for this market (fuelwood & forest chip) has limited competition and therefore remains fairly stable.
Pulpwood markets are driven by export demand to Scandinavia and can be volatile as this market fluctuates. 2018 saw a substantial spike in pulpwood prices due to increased export demand as a response to a global increase in pulp and paper prices boosting Scandinavian production. This had a minor knock on effect on the domestic fuelwood markets.
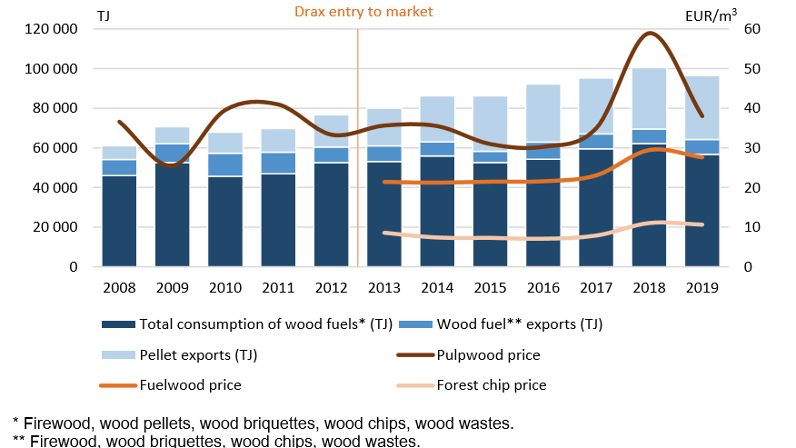
Variation of low-grade wood prices with changing demand
An important part of this analysis is to look for evidence to evaluate Drax’s performance against its new forest commitments, some of which relate directly to these trends and data sets.

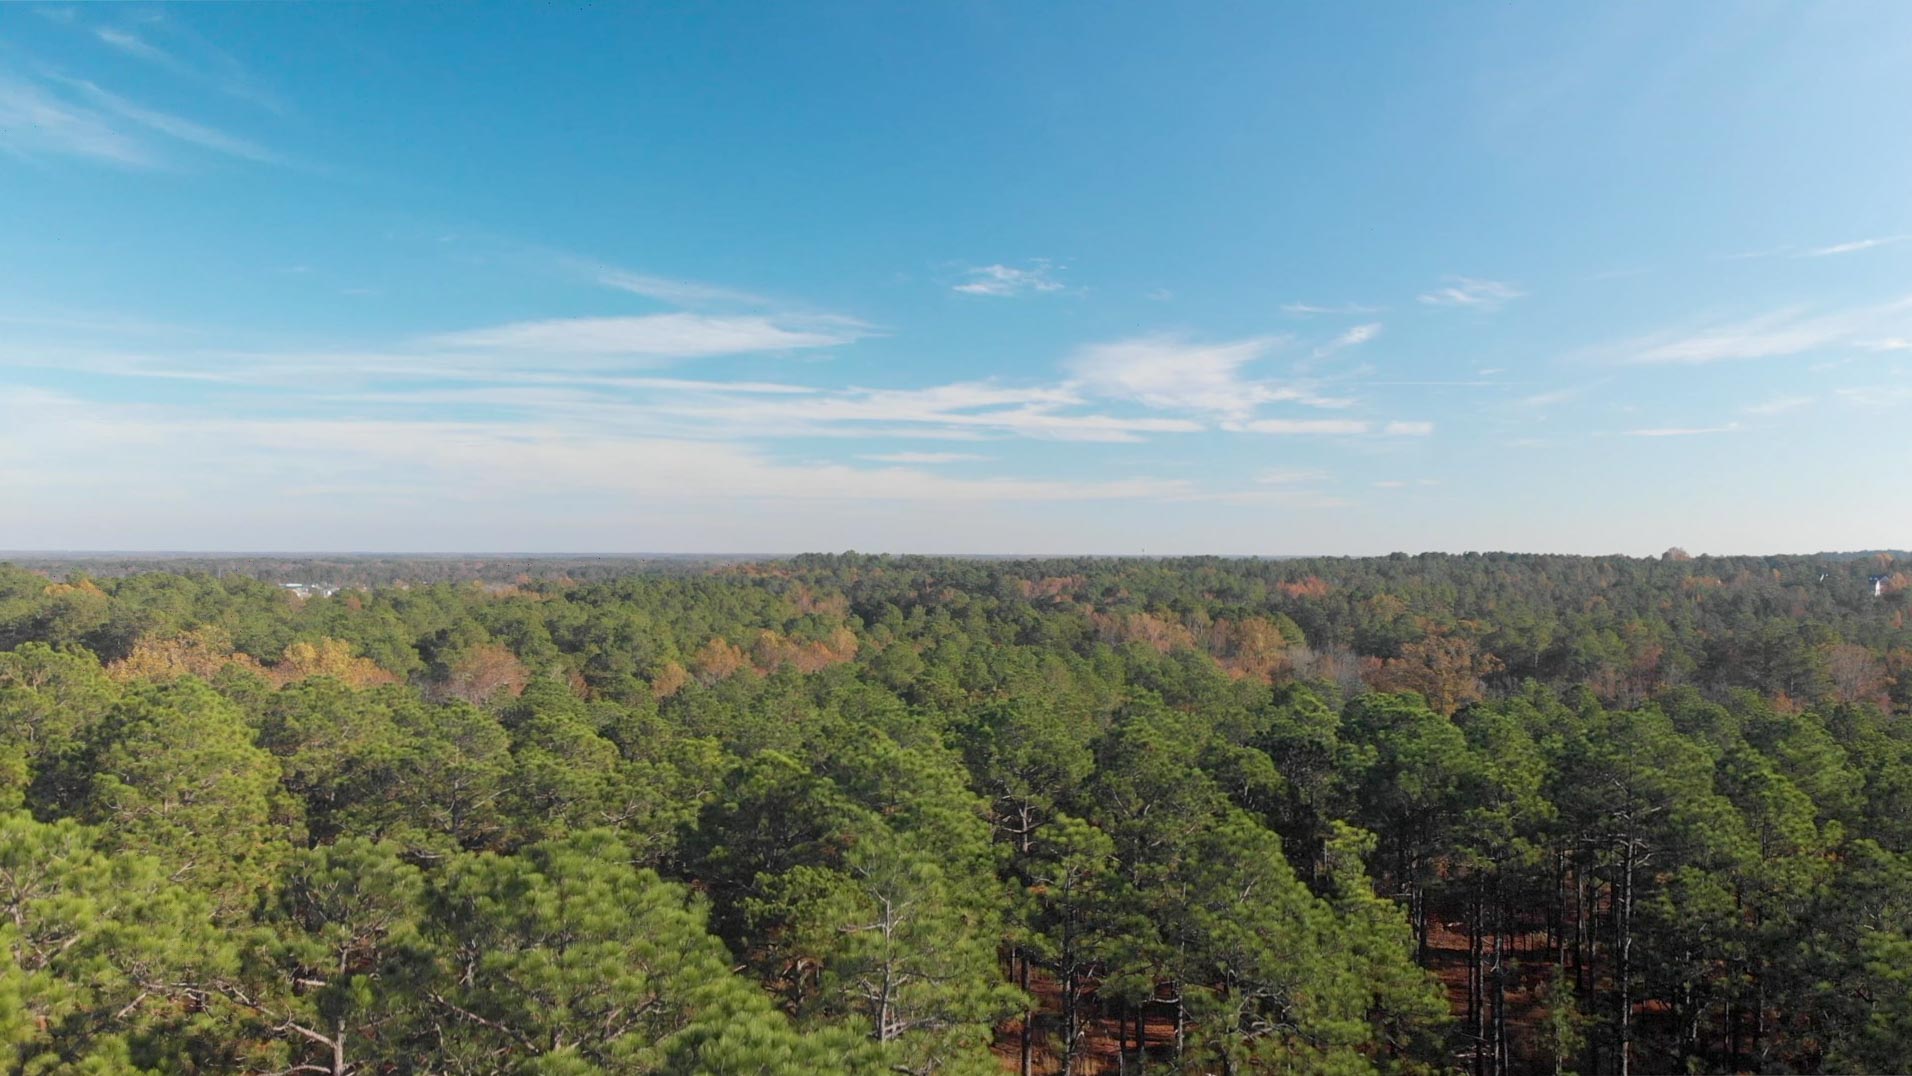
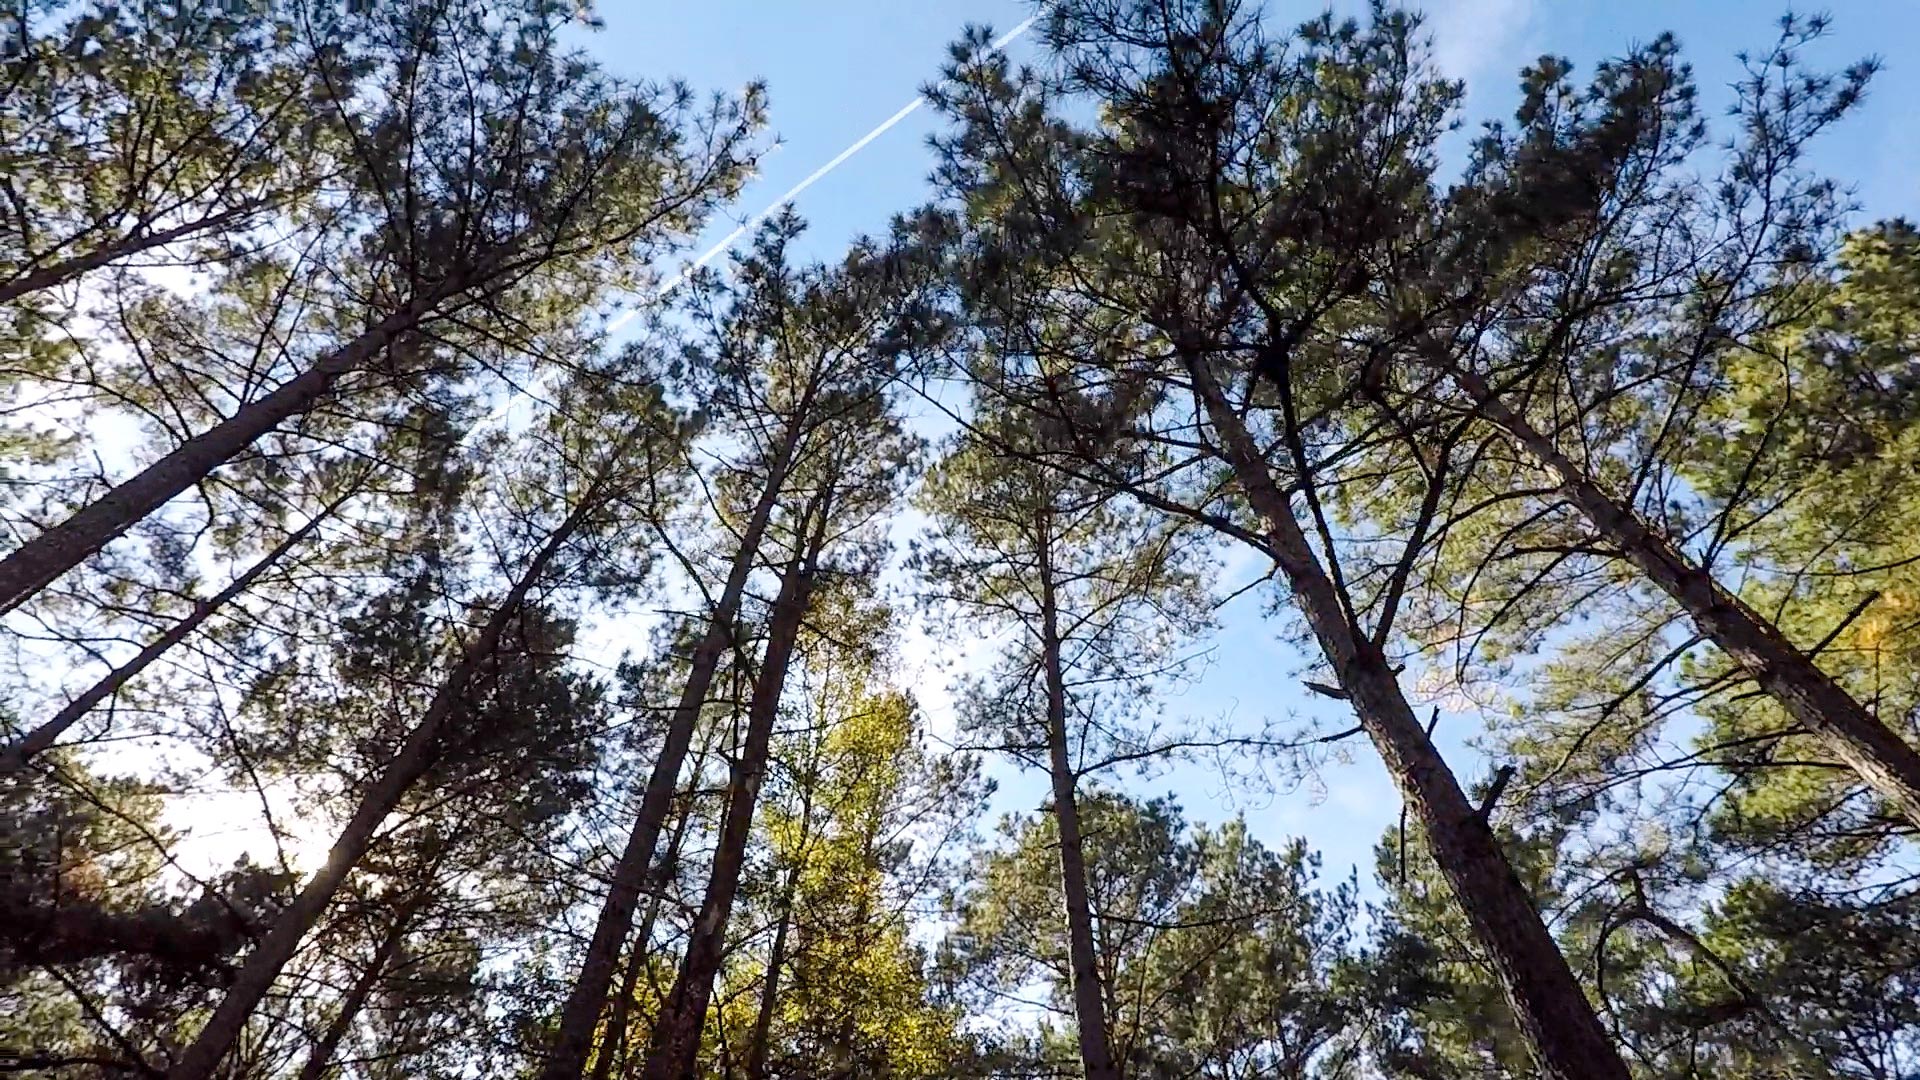
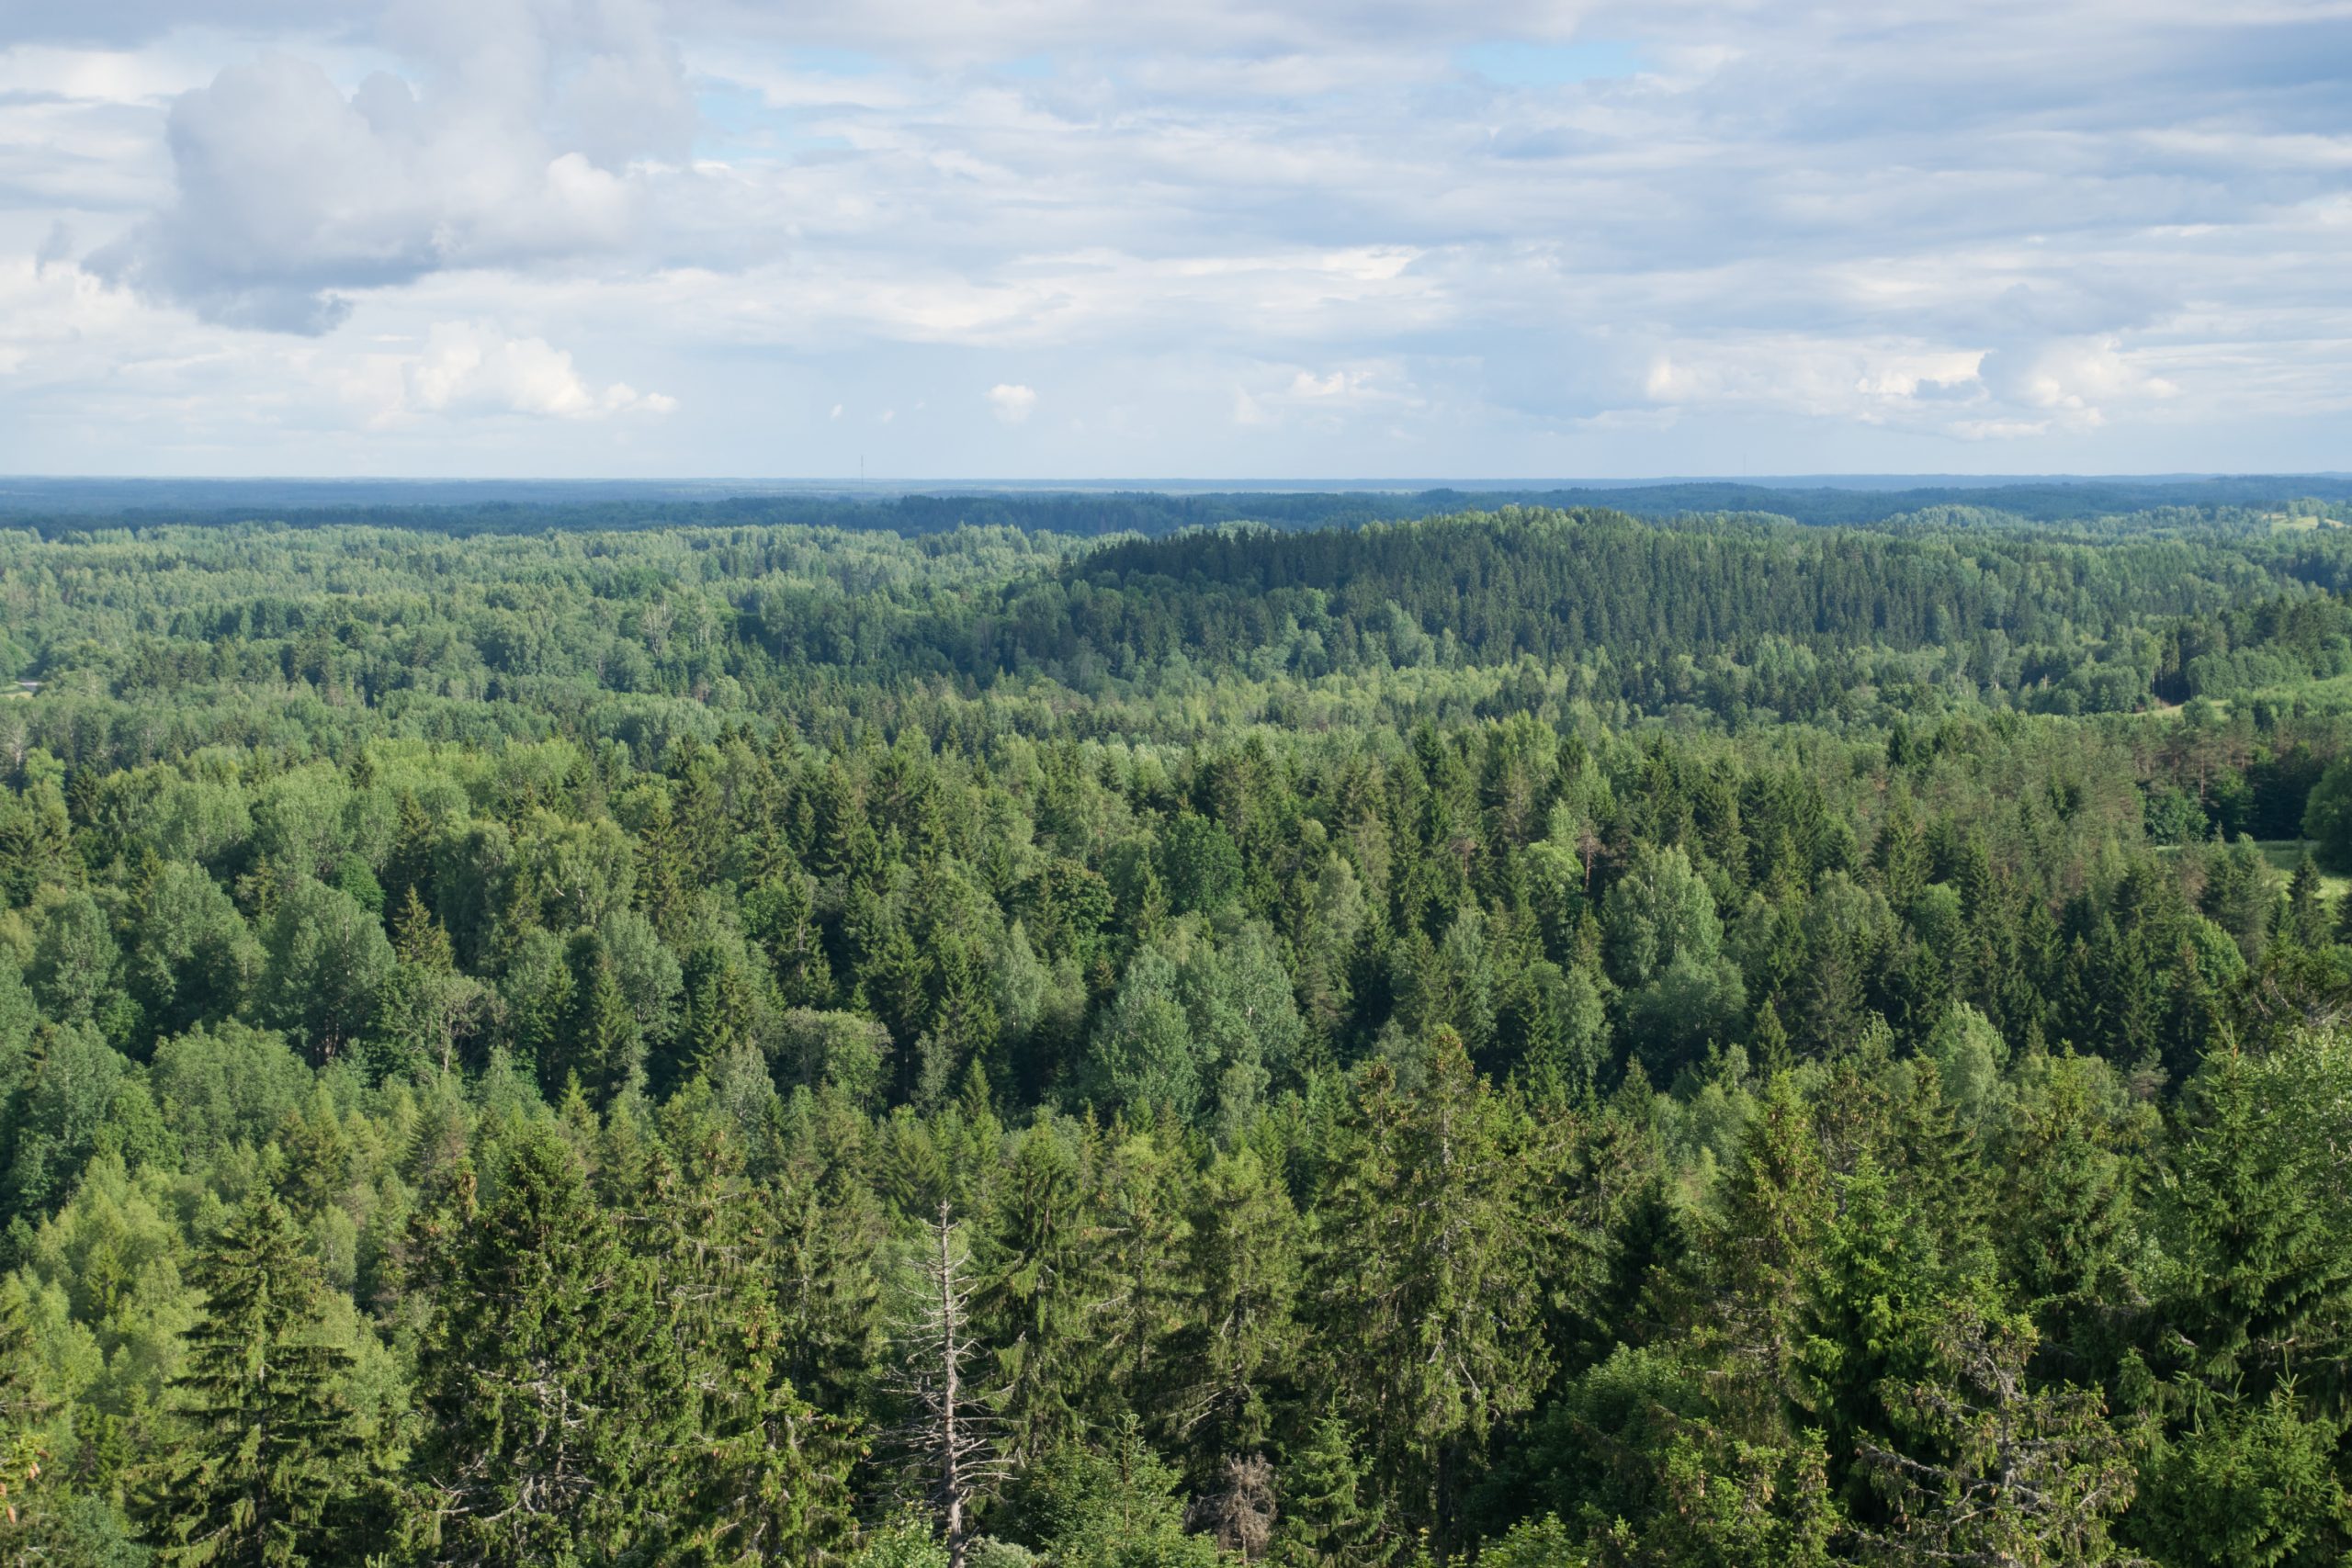
Pine forest in Latvia
Below, the consultant summarises the evidence of biomass impacts against key metrics in the forest industry of Latvia.
No impact. Both forest area and forest cover have increased during the last two decades. The main driver of the growing forest area has been the natural regeneration of agricultural lands that were left uncultivated during the Soviet regime.
No impact. Forest growing stock has steadily increased throughout the observation period.
The main driver for harvesting level is the roundwood demand from sawmills, panel mills and export. Wood-based bioenergy demand may increase thinnings and residue collection, but it is not as significant a driver for total harvests as the aforementioned. Exported pellets have accounted for approximately 10-14% of the total volume of annual harvests in recent years, depending on the assumed average dry densities of the harvested wood and pellets.
No impact / slight increasing impact. The national felling volume is only about 65% of the national forest increment. The total harvesting area has been declining, while the total harvested volume has increased in the past 20 years. This can be explained by the diminished share of thinnings and increased share of clear-cuts. A decline in both area and volume of fellings can be seen between 2002–2008 and 2010–2016.
The main drivers of harvesting levels are sawmill industry, panel industry and export demand. However, wood demand for energy purposes can still improve the overall income for the forest owner and therefore increase the total harvesting levels in private forests
Increasing impact. Most of the collected residues originate from clear-cuts in state forests. Most produced harvesting residues are left in situ, and they are not over-exploited.
Collection of wood residues from harvesting operations has been increasing for the last 15 years as a result of increased capacities and demand from heat and CHP plants. Latvia is increasingly relying on woody biomass for energy generation.
No apparent impact. The total forest area and growing stock have grown in the last decade.
According to Latvia’s National Forestry Accounting Plan 2021–2025, the forests are decreasing their GHG sequestration capacity. Even a low sequestration rate increases carbon storage, which explains the increases in forest growing stock and area. The decrease in GHG sequestration capacity is due to forest ageing, emissions from soils and the increased share of broadleaved forests, which have lower carbon accumulation capacity than conifers.
Removal of harvesting residues decreases carbon sequestration since the residues are an input to the soil carbon pool. However, the majority of the harvesting residues’ carbon is released to the atmosphere when the biomass decays, so the ultimate impact of harvesting residue collection is minimal if the collection is done on a sustainable level. The sustainability of the collection is determined by how the soil nutrient balance is impacted by collection. This is not accounting for the substitution effect that the harvesting residues may have, by, e.g. reducing the need to burn fossil fuels.
No impact. The Law on Forests regulates minimum forest age and diameter for clear-cuts. The LVM and large-scale forest owners often conduct clear-cuts at minimum diameter, whereas smallholders tend to wait until roundwood prices are high. Due to the regulation, an increase of wood-based bioenergy demand has not shortened rotations.
Increasing impact in naturally afforested former agricultural lands. No impacts on thinnings overall. The total harvested area has been declining, while the total harvested volume has increased in the past 20 years. This can be explained by the diminished share of thinnings, due to existing forest age structure, and increased share of clear-cuts. Most of the harvesting residues are collected from clear-cuts.
There is an increased demand for small diameter wood and harvesting/processing residues overall.
The increased demand for small-diameter hardwood has increased harvesting in previously unmanaged afforested agricultural lands, which usually overgrow with broadleaved trees. These kinds of lands are usually otherwise not significant for forest management.
No impact. No indication of hardwood conversion to softwood was found. Instead, pine forests are decreasing due to the favouring of natural regeneration, which usually results in spruce or broadleaved forests in nutrient-rich and/or wet soils.
No apparent impact. Production of sawnwood and wood-based panels have increased or remained steady, i.e. no evidence of diversion.
Several interviews confirmed that sawlogs are not processed for other products besides sawnwood and wood-based panels.
No apparent impact. Prices of all wood assortments increased in 2017–2018, most notably the prices of pulpwood. This was due to difficult harvesting conditions and increased demand for pulpwood in Finland and Sweden, because of high market pulp prices. Pulpwood prices returned to pre-surge levels in 2019. Fuelwood prices also increased temporarily, but at a much more moderate rate. The main driver for fuelwood price increases was the surge of pulpwood prices.
Forest owners have responded to the recovery in pine saw-timber markets, since the global financial crisis of 2008, by planting more forest and investing more in the management of their land. The same period has witnessed increased demand from the biomass sector which has replaced declining need for wood from pulp and paper markets.
The area of timberland (actively managed productive forest) has increase by around 89,000 hectares (ha) since 2010. This change is due to three important factors: new planting on agricultural land; the planting of low-grade self-seeded areas with more productive improved pine; and the re-classification by the US Forest Service (USFS) of some areas of naturally regenerated pine from woodland to timberland.
The 2018 data shows that pine forest makes up 46% of the timberland area, of which 61% is planted and the remainder naturally regenerated. Hardwoods cover 43% of the timberland area, with 93% of this naturally regenerated. The remaining area is mixed stands.
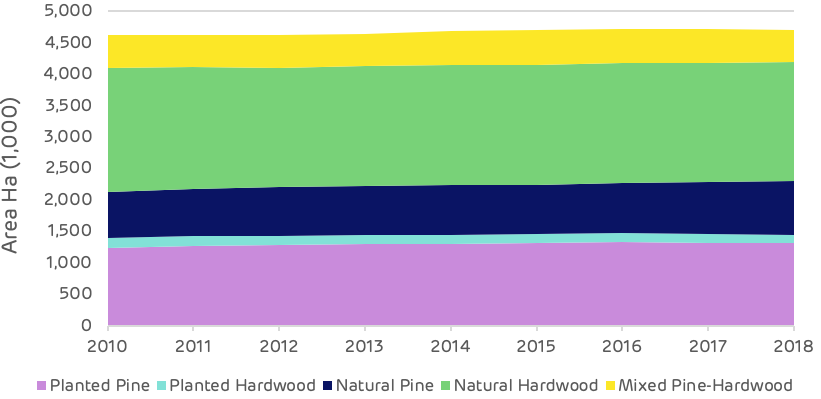
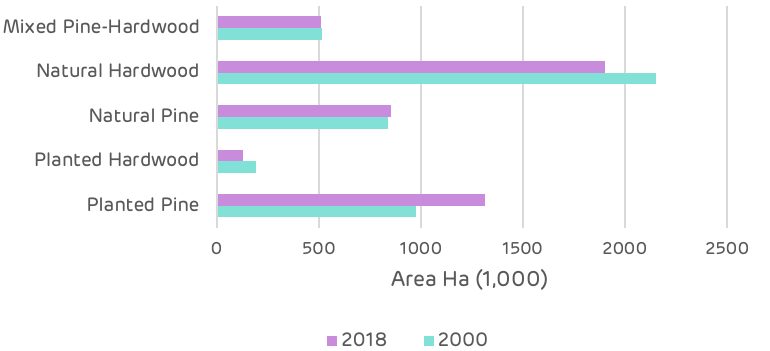
Since 2000 there have been some significant changes in the composition of the timberland area with a transition from hardwood to softwood. Pine has increased from 39% of the total area in 2000 to 46% in 2018 and hardwood has decreased from 50% to 43% over the same period.
All pine areas have increased since 2000 with naturally regenerated pine increasing by 13,000 ha and planted pine by 340,000 ha since 2000. Mixed stands have declined by 6,500 ha as some of these sites have been replanted with improved pine to increase growth and saw-timber production.
The biggest change has been in the hardwood areas where there has been a decline of around 314,000 ha, despite the total area of timberland increasing by 31,000 ha.
This change has been driven by private forest owners (representing 91% of the total timberland area), seeking to gain a better return on investment from their forest land.
Hardwood markets have declined since the 2008 recession and demand for hardwood saw-timber has not recovered. Demand for pine saw-timber has rebounded and is now as strong as pre-crisis.
Pine also offers much faster growth rates and higher total volumes in a much shorter time frame (typically 25-35 years compared to 75-80 years for hardwoods).
The decision to change species is similar to a farmer changing their agricultural crops based on market demand and prices for each product. Where forests are managed for revenue generation then it is reasonable to optimise the land and crop for this objective. This can be a significant positive, from a carbon perspective more carbon is sequestered in a shorter time frame and more carbon is stored in long term wood products, if the quantity if saw-timber is increased.
Increased revenue generation also helps to maintain the forest area (rather than conversion to urban development, agriculture or other uses).
A potential negative is the change in habitat from a pure hardwood stand to a pure pine stand, each providing a different ecosystem and supporting a different range of flora and fauna. There is no conclusive evidence that one forest type is better or worse than the other; there is a great deal of variety of each type.
Some hardwood forests are rich in species and biodiversity, others can be unremarkable. The key is not to endanger or risk losing any species or sensitive habitat and to ensure that any conversion only occurs where there is no loss of biodiversity and no negative impact to the ecosystem.
It is not clear whether all of the lost hardwood stands have been directly converted to pine forests, some hardwood stands may have been lost to other land uses (urban and other land has increased by 400,000 ha). Some may have been directly converted to pine by forest owners encouraged by the increase in pine saw-timber demand and prices.
Whatever the primary driver of this change it is clearly not being driven by the biomass sector.
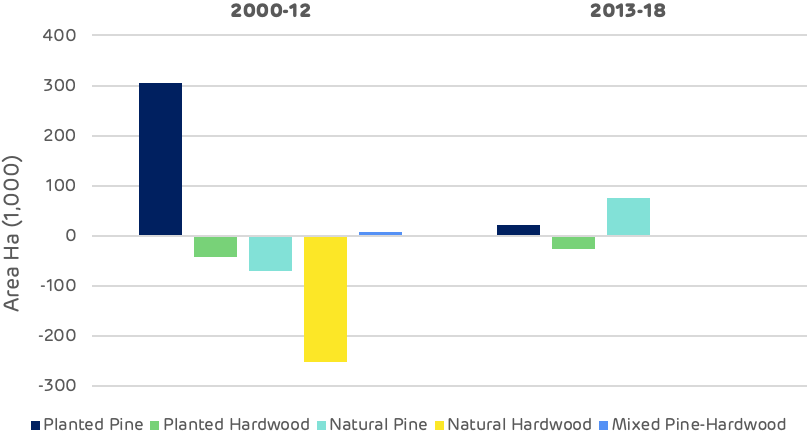
The chart above demonstrates that the biggest change, loss of hardwood and increase in planted pine, occurred between 2000 and 2012, prior to the operation of the pellet mills. Since 2012, there has been no significant loss of natural hardwood and only a small decline in planted hardwood.
Increased timberland, increased carbon stored in the forest, robust prices and new markets benefiting forest owners and forest workers, are among the findings of a report by Hood Consulting.
This fourth in a series of catchment area analyses for Drax looks at the area surrounding three pellet plants operated by Enviva: Ahoskie, Northampton and Southampton.
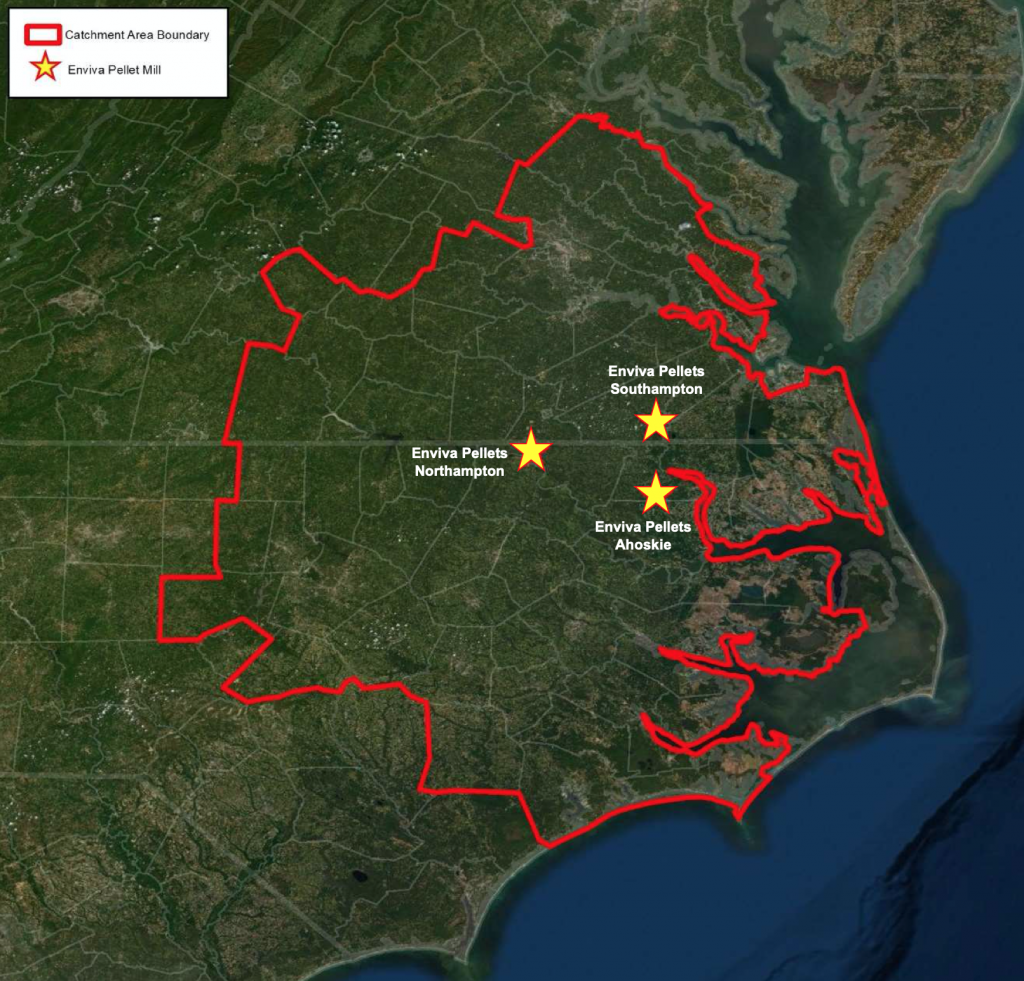
Enviva catchment area in Virginia and North Carolina
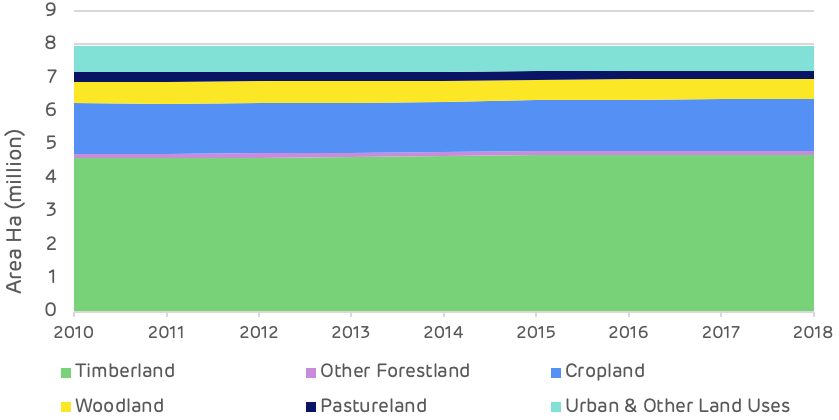
Forests and woodlands represent 68% of the total area at just over 5.4 million hectares (ha) with 87% of this area classified as timberland. The area of timberland (actively managed productive forest) has increased by around 89,000 ha since 2010 and there have been some significant changes in forest type.
The overall area of forest has increased and there is no evidence of deforestation occurring.
Since 2000, the total volume of standing timber in the catchment area has increased by 170 million cubic metres (m3). Sixty five percent of this increase has occurred since 2012, indicating a growing/maturing forest resource and an expanding forest area. Most of the increase in volume has been in the saw-timber categories for both pine and hardwood, although the hardwood pulpwood size class has also increased by nearly 10 million m3 since 2012 following a small decline between 2000 and 2012.
The increased demand from the three Enviva pellet mills, beginning operation in 2012 in the Chesapeake region, appears to have had no negative impact of the accumulation of forest carbon in the growing stock of the region. Since this time, all categories of timber product have increased.
This increase in inventory is also reflected in the comparison of average annual growth to removals. The surplus of un-cut growth has increased substantially since 2010 from 4.7 million m3 per year to 15.9 million m3 p.a. Over this period annual growth has increased by 35.5% whereas removals have decreased by 8.6%.
Demand for timber products has fluctuated since 2000. The global financial crisis in 2008-09 impacted all product categories, but particularly pine and hardwood saw-timber where there was a combined drop of over five million tonnes in 2010 compared to 2000. This was a loss of over 20% of total annual demand in the catchment area. Pine saw-timber has now recovered to pre-crisis levels, but hardwood demand has remained low. Hardwood pulpwood demand also declined around this time, with the closure and decline of existing pulp mills in the catchment area. Demand had fallen by one million tonnes p.a. by 2011 prior to the Enviva pellet mills opening. From 2012 the new biomass demand enabled the hardwood pulpwood market to recover to pre-crisis levels with demand in 2018 at almost exactly the same level as in 2000.
This fluctuation in demand is reflected in the average annual stumpage price data shown on the chart below, this is the value that the forest owner gets for each product. The trends are generally as expected, with the exception of the hardwood saw-timber price, which has increased substantially despite a decrease in demand. This is due to supply chain issues, reduced capacity of loggers and access to land.
The full version can be found in the main report.
No. US Forest Service (USFS) data shows the opposite. The total area of timberland in the Enviva Chesapeake catchment area has increased an estimated 82,818 hectares (+1.8%) since Enviva Pellets Ahoskie commenced full production in 2012.
No / Inconclusive. Changes in management practices have occurred in the catchment area since 2012, but there is little evidence to suggest that bioenergy demand has caused these changes. Conversion of hardwood and mixed pine-hardwood timberland to planted pine timberland has occurred in the catchment area.
No / Inconclusive. Since 2012, pulpwood demand not attributed to bioenergy has decreased 19%; however, this decrease is largely attributed to decreased demand from the pulp/paper sector. Also, demand for softwood and hardwood sawlogs have increased an estimated 14% and 7%, respectively, since 2012.
No / Inconclusive. The increase in hardwood biomass demand coincided with price increases of 10-24% for delivered hardwood pulpwood. These price increases were likely linked to a combination of both supply chain issues (shortage of local loggers following pulp/paper mill closures in the region) and elevated prices offered by Enviva to ensure guaranteed wood supply for the first several years of operation, as prices for delivered hardwood pulpwood and hardwood chips proceeded to decline 16% and 9%, respectively, from 2014 to2017 once the market stabilised.
Since 2014, prices for pine products have held flat even though softwood raw material purchases (demand) by Enviva have more than doubled. In this catchment area, changes in pine pulpwood and pine chip prices are largely driven by demand attributed to the pulp/paper sector.
No. Total growing stock inventory in the catchment area increased 19% from 2012 through 2018. Over this period, inventories increased as follows for each of the five major timber products: +33% for pine sawtimber, +23% for pine chip-n-saw, +14% for pine pulpwood, +12% for hardwood sawtimber, and +14% for hardwood pulpwood.
The increase in timber inventory can be linked to a combination of increased forest area (additional hectares = additional inventory) and annual harvest levels below the sustainable yield capacity of the catchment area forest (i.e. annual growth has continued to exceed annual removals, resulting in increased inventory levels).
No. US Forest Service data shows the average annual growth rate of growing stock timber has increased slightly since 2012. Increased timber growth rates/carbon sequestration rates can be linked to a combination of changes in species composition and silvicultural practices.
Softwood (pine) grows at a much quicker rate compared to hardwood species, and in the Enviva Chesapeake catchment area, pine timberland area increased from 43.6% of total timberland area in 2011 to 46.0% in 2018. Also, improvements in silviculture have continued to enhance growth and overall productivity. Together, these factors help explain how average per hectare volume growth increased from 5.9 m3 in 2011 to 7.7 m3 in 2018.
No. In 2018, the latest available, growth-to-removals ratio for pine and hardwood pulpwood, the timber products utilised by bioenergy, equalled 2.49 and 2.76, respectively (a value greater than 1.0 indicates sustainable harvest levels). Even with the increased harvesting required to satisfy bioenergy demand, harvest levels remain well below the sustainable yield capacity of the catchment forest area.
Neutral. Total wood demand increased an estimated 14% from 2012-2018, and much of that increase can be attributed to increased demand from bioenergy. In this catchment area, inventories are so substantial that increases in demand from bioenergy, as well as from other sources, have not been great enough to offset annual timber growth. Total growing stock inventory has continued to increase – an average of 2.9% per year since Enviva first entered this market in 2012.
Neutral. Timber growth rates have increased for pine sawtimber, pine chip-n-saw, pine pulpwood, and hardwood pulpwood since 2012; hardwood sawtimber growth rates have declined slightly. Evidence suggests these overall increases in growth rates are linked to changes in age class distribution (i.e. a younger forest), not due to changes in bioenergy demand
Positive / Neutral. Total forest (timberland) area in the catchment area increased nearly 83,000 hectares (+1.8%) from 2012 through 2018, the latest available. Our analysis of biomass demand and forest area found a strong positive correlation between these two variables but also a moderately strong correlation between softwood sawlog demand and forest area.
Neutral / Negative. The additional wood demand placed on this market by Enviva from 2012-2014 coincided with a 19% increase in delivered pine pulpwood price and a 24% increase in delivered hardwood pulpwood price. Pine and hardwood chip prices also increased 10-11% over this period. Analysis found evidence that increases in hardwood pulpwood and hardwood chip prices can be linked to increases in total hardwood pulpwood demand. However, given that hardwood bioenergy demand has accounted for over 75% of total hardwood pulpwood demand in the catchment area since 2014, it is reasonable to conclude that hardwood pulpwood demand attributed to bioenergy has had some level of impact on delivered hardwood pulpwood and hardwood chip prices.
Positive. In the Enviva Chesapeake catchment area, demand for softwood and hardwood sawlogs used to produce lumber and other solid wood products increased 15% and 9%, respectively, from 2012-2018. A by-product of the sawmilling process are sawmill residuals – a material utilied by Enviva’s three mills to produce wood pellets. With the increased production of both softwood and hardwood lumber, so too has come an increase in sawmill residuals, some of which has been purchased/consumed by Enviva.
Not only has Enviva benefited from the greater availability of this by-product, but lumber producers have also benefited, as Enviva’s three mills have provided an additional outlet for these producers and their by-products.
Positive. Increased demand attributed to bioenergy has been a positive for forest landowners in the Chesapeake catchment area. Not only has bioenergy provided an additional outlet for pulpwood (particularly hardwood pulpwood), but the increase in pulpwood prices as a result of an overall increase in both softwood and hardwood pulpwood demand has transferred through to landowners (improved compensation).
Specifically, since 2013 (the first year all three Enviva pellet mills were operating), hardwood pulpwood stumpage price – the price paid to landowners – has averaged roughly $5.60 per ton in the Chesapeake catchment area. This represents a 47% increase over the approximately $3.80 per ton averaged by hardwood pulpwood stumpage in the catchment area over the 10 years prior (2003-2012). Similarly, pine pulpwood stumpage price has averaged $12.95 per ton in the catchment area since 2013, up 67% from the 2003-2012 average of $7.75 per ton.
Estonia is a heavily forested country with a mature forest resource that has been neglected over many years due to political and ownership changes. Management of state and corporate owned forests is now good, but some small privately-owned areas of forest are still poorly managed.
Despite this, both the forest area and the growing stock have been increasing, largely due to new planting and the maturing age class of existing forest.
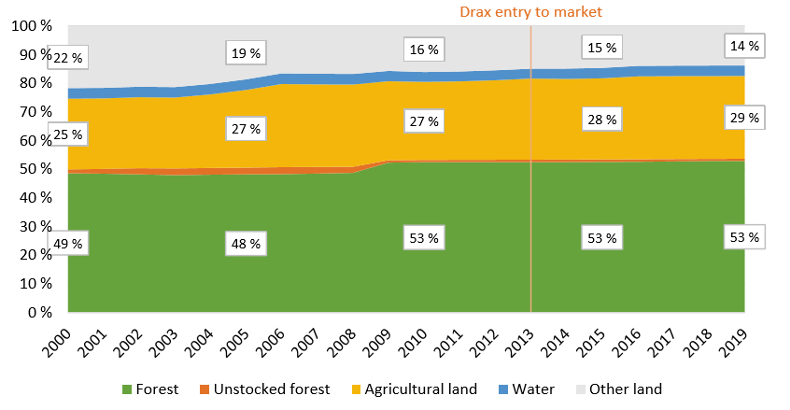
Forest area has increased from 49% to 52% of the total land, increasing by more than 118 thousand hectares since 2010.
Land use in Estonia [click to view/download]
Change in forest growing stock – Estonia [click to view/download]
Since 2008, harvesting and management has increased. Private and corporate forest owners have been harvesting forest that had been mature and ready for clear felling. The longer-term harvesting trend has been considerably lower than annual growth (increment) and the maximum sustainable harvesting level, as shown on the chart below.
Annual increment and harvesting levels [click to view/download]
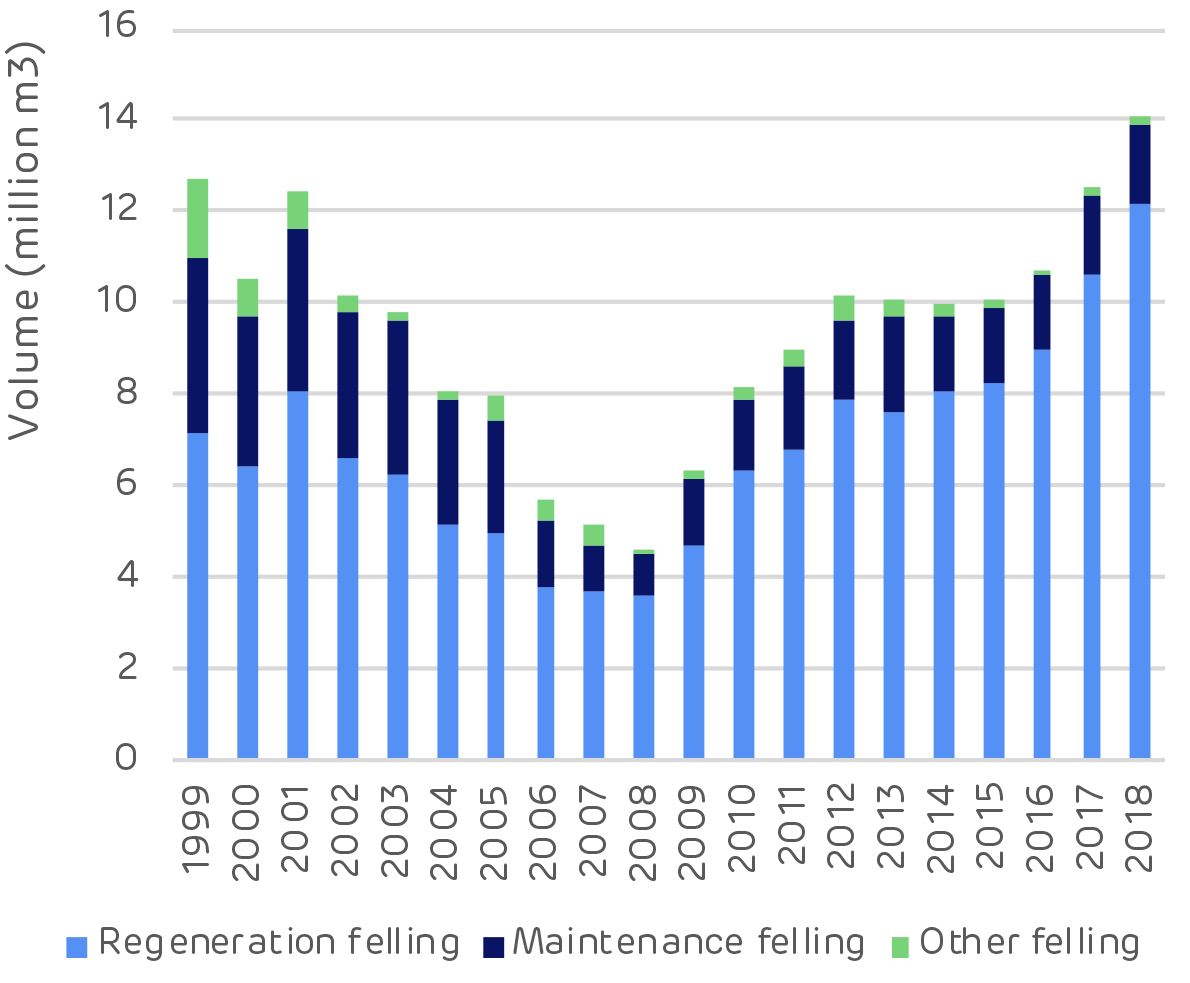
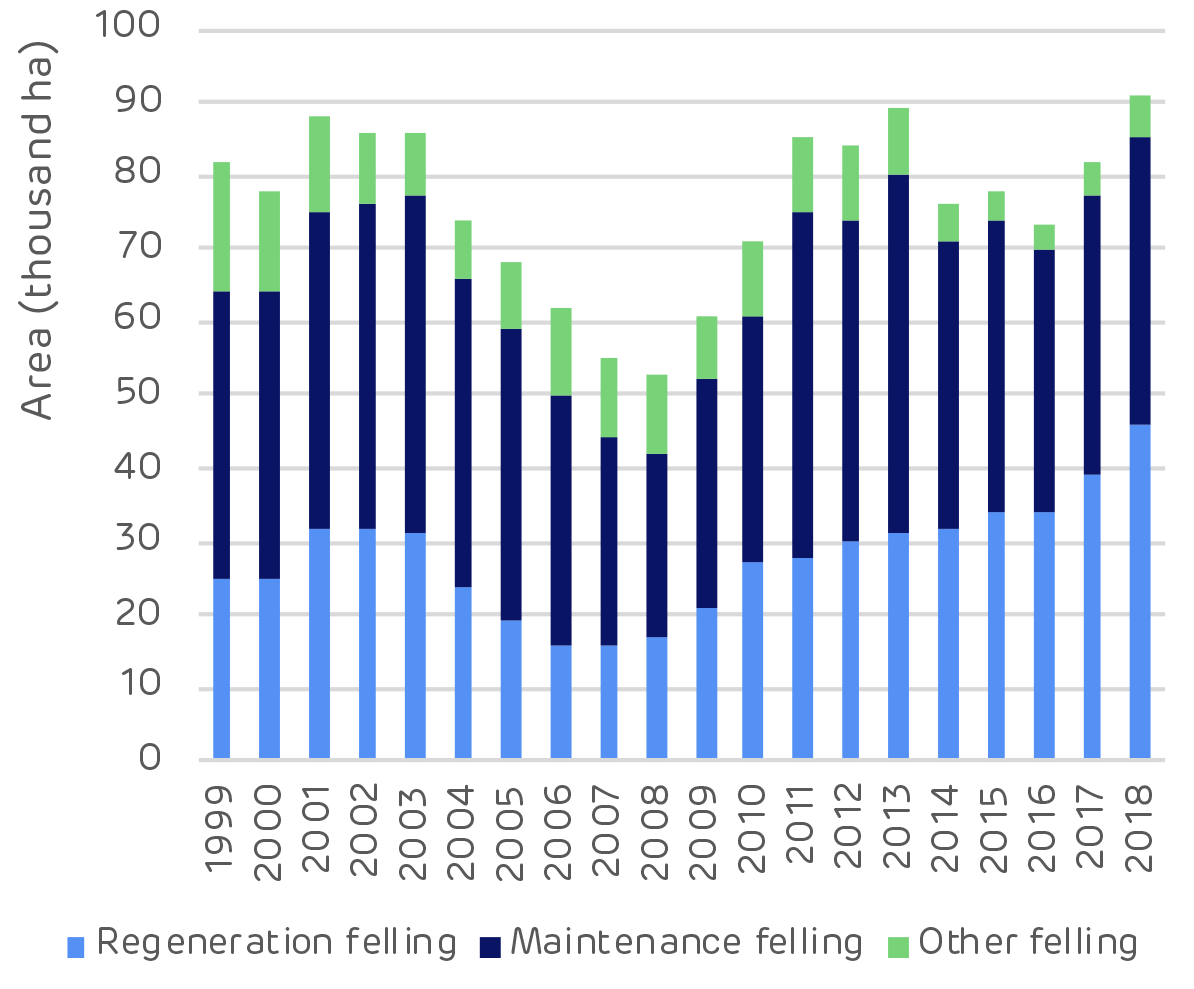
Clear cutting (regeneration felling) is the largest operation by volume but thinning (maintenance felling) is the largest by area.
This indicates a forest landscape in balance, with widespread thinning to produce more sawlog trees and a large volume of clear cuts in the mature stands to make way for the next generation of forests.
![Reforestation in Estonia. * Note: Since 2014 it has not been compulsory for private and other forest owners to submit reforestation data. [Click to view/download]](https://www.drax.com/wp-content/uploads/2020/03/figure_3.13.png)
Reforestation in Estonia. * Note: Since 2014 it has not been compulsory for private and other forest owners to submit reforestation data. [Click to view/download]
![Species mix in Estonian forests [Click to view/download]](https://www.drax.com/wp-content/uploads/2020/03/figure_3.3.png)
Species mix in Estonian forests [Click to view/download]
Sunrise and fog over forest landscape in Estonia
Pulpwood markets are limited in Estonia and this material has been historically exported to neighbouring Finland and Sweden. Export demand has had a significant impact on prices as can be seen in a spike in 2018 when demand was at its strongest.
The forest industry has been dominated by sawmills and panel board mills. Demand and production in this sector has been increasing and this has kept prices high. There is a substantial differential between sawlog and pulpwood pricing.
![Comparison of sawlog and pulpwood prices [click to view/download]](https://www.drax.com/wp-content/uploads/2020/03/Picture-1.pdf2_-1.png)
Comparison of sawlog and pulpwood prices [click to view/download]
Drax feedstocks from Estonia 2018 [click to view download]
Sunrise through forest in Estonia
No negative impact. Regardless of increasing domestic biomass utilisation for energy and exports, forest area has increased due to afforestation programmes. Forest cover is not as high as forest area, due to temporarily un-stocked area after clear-cut. Despite this, forest cover has continuously increased from 2010–2018.
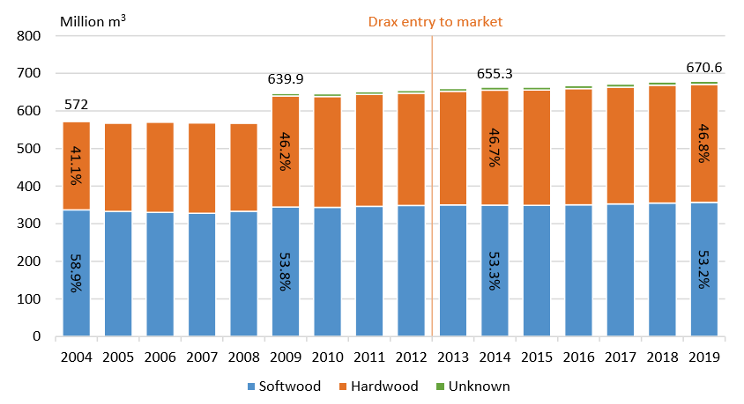
No negative impact. The total forest growing stock has been increasing for the last two decades. In 2018 the growth slowed or halted (official statistics show a decrease, but this is due to sampling error). In 2018 there was record-high wood demand from Finland, which was driven by high global pulp prices motivating maximal pulp production. This increased harvests to a previously unseen level.
Slight increasing impact. During 2004–2011, harvesting levels in Estonia were less than half of the estimated maximum sustainable level. This resulted in an increase in the maximum sustainable harvesting level for the 2011–2020 period. In 2018, the harvesting volumes were at the maximum sustainable level. The main drivers increasing the harvesting volumes have been increased sawmill capacity and production, high demand for pulpwood in Finland and Sweden and improved demand for energy wood. This was a temporary peak and demand has already slowed. Softwood lumber prices have decreased significantly in Europe due to an abundance of wood supply from Central Europe, which has been created by widespread bark beetle and other forest damages. Global pulp prices have also decreased to below 2017 prices.
Ambivalent impact. The annual increment has grown throughout the 2000–2018 period. Increased fuelwood price has enabled forest management in some of the alder forests that were completely unutilised in the past. Thinnings, both commercial and pre-commercial, accelerate long-term volume growth in forests, leading to increased carbon sequestration. Removal of harvesting residues decreases carbon sequestration since the residues are input to the soil carbon pool. However, the majority of the harvesting residues’ carbon is released to the atmosphere when the biomass decays, so the ultimate impact of harvesting residue collection is minimal if the collection is done on a sustainable level. The sustainability of the collection is determined by how the soil nutrient balance is impacted by collection. This is not accounting for the substitution effect that the harvesting residues may have, by e.g. reducing the need to burn fossil fuels. Utilisation of sawmill by-products does not directly impact forests’ carbon sequestration potential, but it can increase harvesting through improved sawmill overall profitability.
Neutral. Forest law regulates minimum forest age for clear-cuts. According to interviews, Riigimetsa Majandamise Keskus (RMK – the Estonian state forest company), often conducts the final felling at the minimum age. Due to the regulation, an increase of wood-based bioenergy demand has not shortened rotations at least in state-managed forests. In forests that are older than the minimum final felling age, sawlog price is a more important driver for final-felling decisions than wood-based bioenergy demand.
Increasing impact. The increase of bioenergy demand has increased the demand for small-diameter hardwood, which in turn has increased thinnings in previously unmanaged forest stands. This will increase the availability of good quality sawlogs and will also accelerate the carbon sequestration (tonnes/ha/year) of the forests. However, the total forest carbon stock (tonnes/ha) will be reduced; in unmanaged (e.g. no thinnings) mature stands, the carbon stock is larger than in managed stands of similar age. The carbon stock of a thinned stand will remain below that of an unthinned stand regardless of post-thinning accelerated growth.
Neutral. No indication of hardwood conversion to softwood was found.
Neutral. Production of sawnwood, wood-based panels, pulp and paper products have increased or remained steady, i.e. no evidence of diversion.
Slight increasing impact. During 2017–2018, the price of all roundwood assortments increased notably. The increase was strongest in pulpwood assortments, especially those that are not further processed domestically but are exported to mainly Finland and Sweden. Finnish demand for pulpwood was at a very high level in 2018. This was a temporary trend, however, and prices and demand have since decreased. The price increase for fuelwood was less dramatic, no sharp increases are observed. According to interviews, pellet production was the most important driver of fuelwood prices.

